Analys
SEB Jordbruksprodukter, 13 september 2012
 USDA släppte sin WASDE-rapport för september igår. Den var bearish för vete och majs och bullish för sojabönor. Om man tar siffrorna som de står vill säga.
Själva rapporten innehåller en hel del märkligheter. Medan hela världen ställt in sig på en skörd av vete i Australien på 22.5 mt, låter USDA bli att justera ner den från 26 mt. När det gäller majs gör man något så märkligt som att låta det som är skördat före 1 september hamna på utgående lager för förra året, men man ser inte riktigt effekten av detta på innevarande års utgående lager. För att lyckas med det här tycks man t ex ha låtit EU:s husdjur konsumera 4 mt mindre spannmål i år, och lämna EU med tre veckors lager av vete den sista juni nästa år.
Den oberoende (?) ryska analysfirman IKAR rapporterade igår också att skörden i Ryssland bara ger ett exportutrymme på 2 – 6 mt vete. Inte 12 som Kreml meddelade för en vecka sedan.
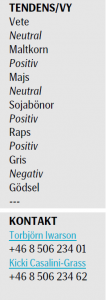
Vi väljer dock på tekniska grunder att rekommendera neutral position i vete och majs, men risken är på uppsidan om det skulle (be)visa sig att USDA varit allt för optimistiska. Sojabönor är vi positiva till, liksom raps. Socker kan ha funnit en botten.
Odlingsväder
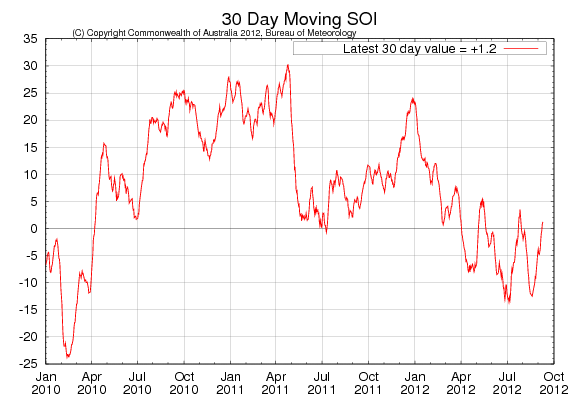
ENSO har minskat tendensen till El Niño den senaste veckan. Vi ser att Southern Oscillation Index har fortsatt att stiga och ligger på +1.2 nu. Ett värde under -8 indikerar El Niño-förhållanden. Molnighet och vindar stämmer överens med neutrala ENSO-förhållanden.
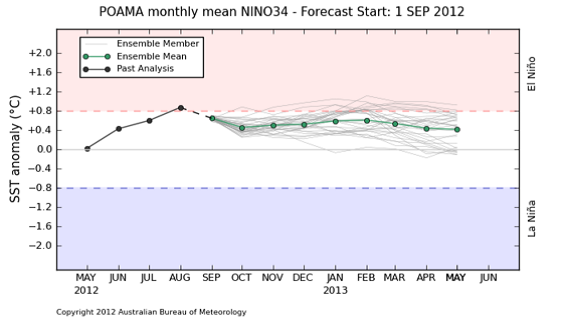
Bureau of Meteorology har också publicerat en ny ensembleprognos för ENSO och den ser vi nedan.
Vi ser att prognosen ligger nära El Niño-förhållanden, men nu lite lägre (lite mindre El Niño) än i förra prognosen som kom för en månad sedan.
 Vete
Vete
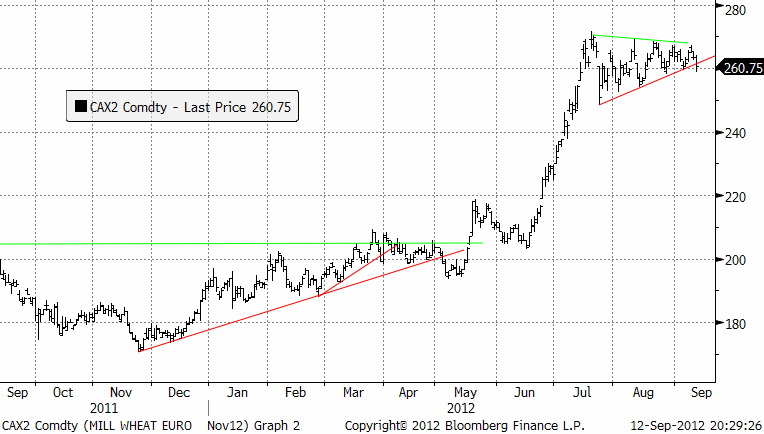
Tekniskt har Matif:s novemberkontrakt brutit nedåt, men stödet på 260 verkar ännu vara obrutet. Den tekniska bilden är otydlig, men man kan ändå säga att marknaden ur ett tekniskt perspektiv ser betydligt mindre positiv ut än förra veckan. Vi väljer därför att gå över till en neutral rekommendation.
Som vi ska se nedan tror vi svagheten i priset beror på att marknaden tog fasta på att WASDE-rapporten var mer rosenröd än befarat. Vi ska också visa att det finns en hel del svagheter bakom den rosigheten och vad gäller den fundamentala utbuds- och efterfrågesituationen, att läget kan vara väsentligt mörkare än vad USDA:s WASDE-rapport ger sken av.
Det kom dock igår också data från Frankrikes FranceAgriMer, som förutspådde att Frankrikes veteexport, som är den största bland de europeiska länderna, kommer att uppgå till 17.1 mt under marknadsföringsåret som slutar i juni nästa år. Året innan var exporten 16 mt. Exporten väntas öka till Spanien, UK och Egypten. Matif kan ha tyngts av detta också (mer än Chicago).
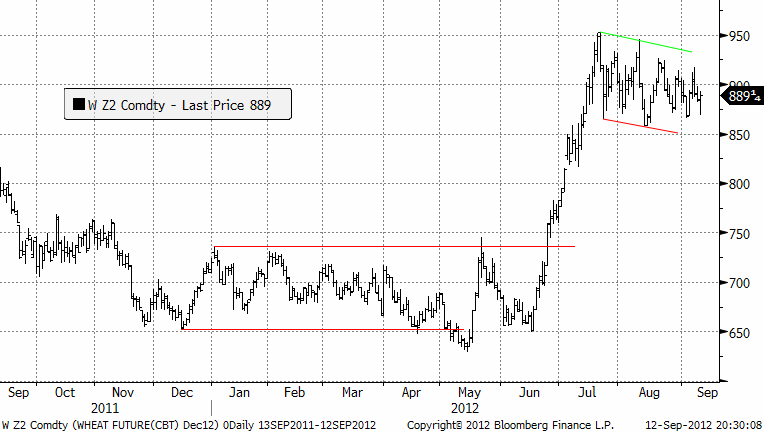
Nedan ser vi Chicagovetet med leverans i december. Den tekniska bilden här visar inte på samma svaghet – och här har priset under kvällen hunnit vända upp från dagens bottennivåer.
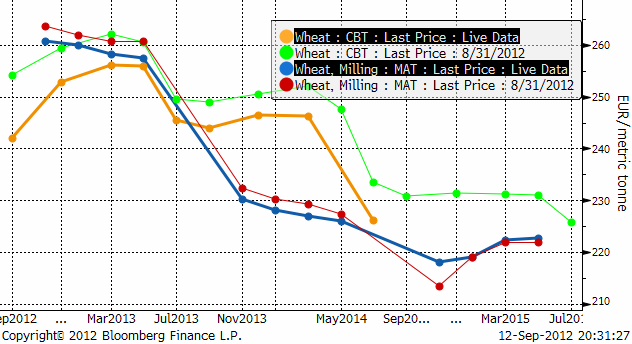
I diagrammet nedan ser vi terminspriserna framåt i tiden för Chicago och Matif och förändringen från 7 dagar sedan.
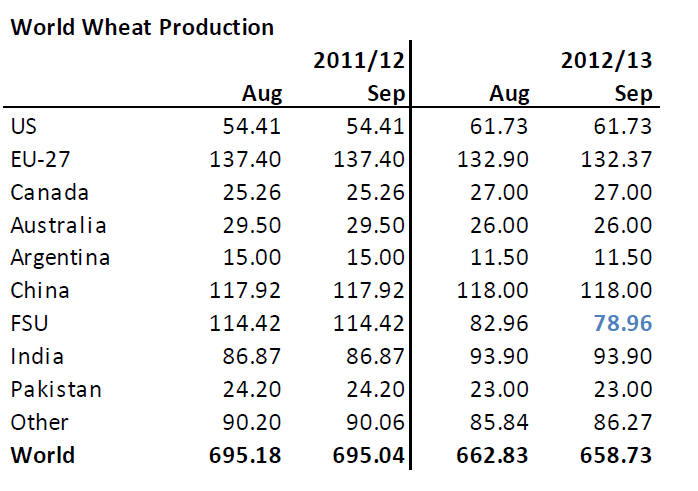
Nedan ser vi produktionsestimaten för de största producentländerna i världen från onsdagens WASDE-rapport.
Vi ser att man bara justerat ner Rysslands produktion. Och den har man bara justerat ner med 4 mt, vilket är mindre än vad ryssarna själva gjorde. Märkligt nog har man inte justerat Australiens, trots att ABARES i Australien själva säger att veteskörden kommer att bli 22.5 mt. Profarmer skriver att de flesta analytiker estimerar att skörden hamnar på 22.5 mt. Det är i linje med vad vi själva räknade ut genom att utgå från förändringen i skörd som normalt sker när det blir ett El Niño-år. Vi kan inte tro annat än att USDA mer eller mindre medvetet har kablat ut en felaktig siffra, eller så är man så tvärsäker på att man vet bäst, bättre än alla andra. Australien har varit utsedd till världens näst största exportör av vete efter USA och det kanske landet blir, men med största sannolikhet med 3.5 mt mindre än vad som sägs här.
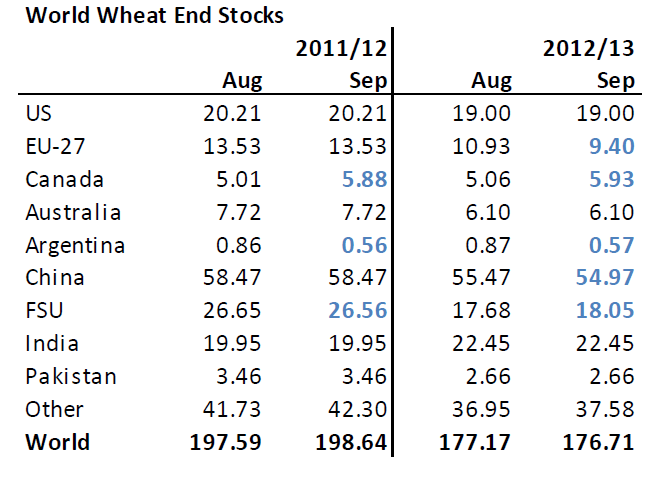
Utgående lager förändras inte i USDA:s rapport. Man sänker användningen av vete som foder, huvudsakligen i Ryssland. Notera att fd Sovjetunionen väntas ha högre utgående lager jämfört med vad man trodde i augusti!
För EU-27 har man sänkt skörden och ökat exporten, så att bara tre veckors konsumtion återstår den sista juni nästa år. Hur sannolikt är det?
Det här är en skum rapport för vete och utbuds/efterfrågebalansen är så ”tunn” att om det visar sig (som det har stor sannolikhet att göra) att något land bluffar, inför exportstopp eller vad som helst, som kan hända, då borde folk vara beredda att betala en hel del mer för det lilla som kommer att finnas på världsmarknaden.
När det gäller exportstopp hörde en uppmärksam läsare av veckobrevet av sig förra veckan och berättade att det lilla landet Kroatien redan infört exportstopp. Ukraina har gjort en frivillig uppgörelse med exportörerna som i praktiken innebär exportstopp. Exporten lär ta slut inom kort i alla fall, när majs fyller exportsilona i hamnarna. Rysslands ministrar ska snart träffas igen och kanske då sänka produktionen ytterligare, med följande minskning av ”exportpotentialen”.
Och visst finns det fristående analysfirmor som är dissidenter med såväl USDA som den officiella ryska rapporteringen och de finns i Moskva. Igår publicerade the Institute for Agricultural Market Studies (”IKAR” på ryska), avvikande data. De sade att per den första augusti var lagren av spannmål i Ryssland 10 mt lägre än de var i torkåret 2010 och faktiskt lägre än de varit något av de senaste fem åren. Vetelagren är 15-17% lägre än de var 2010. IKAR förutstår att spannmålsproduktionen hamnar på 69 – 72 mt. De förutspår att inhemsk konsumtion blir 66-67 mt. Exportpotentialen är alltså bara 2 – 6 mt, enligt IKAR. Inte 12 mt som Rysslands AgMin sade den 6 september.
Vi väljer alltså på tekniska grunder att förhålla oss neutrala till marknaden, men risken är allt jämt på uppsidan. Mot slutet av september ska USDA berätta om lagren av spannmål, t ex majs, per 1 september. Eftersom WASDE för majs målades i lika rosa skimmer, är det möjligt att det blir en trigger, eller så hinner något land införa exportbegräsningar innan.
Maltkorn
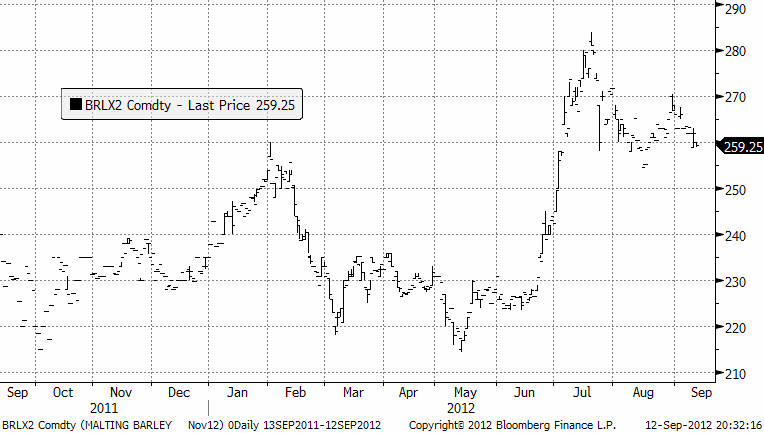
Novemberkontraktet på maltkorn ligger kvar kring 260 euro per ton och vi väntar oss sidledes rörelse i veckan som kommer.
Potatis
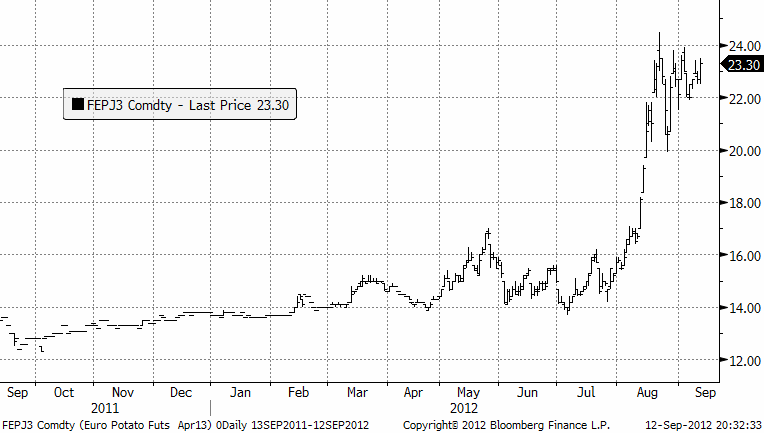
Förra veckan skrev vi att priset verkar ha stabiliserat sig mellan 20 och 24 euro per deciton och så ser det ut. Får vi se priser över 24 euro, kan det vara början på en ny prisuppgångsfas, ett pris under 22 kan å andra sidan signalera säljtryck.
Majs
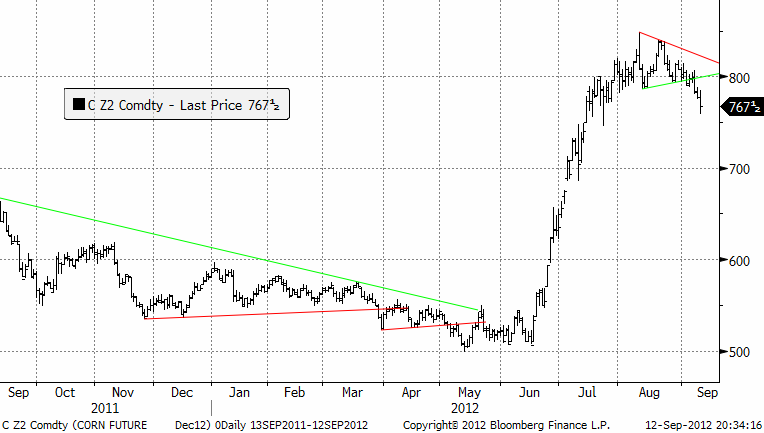
För två veckor sedan skrev vi att ett brott nedåt inte skulle vara bra och skulle innebära att vi skulle gå ur alla positioner och rentav kanske gå kort. Förra veckan skrev vi att detta just hänt. Nu kan vi följa upp och konstatera att priset fallit relativt ordentligt. Prisfallet har också accelererat, såsom det ofta gör när det går upp för marknaden att priset är för högt och att fallet kan bli djupt.
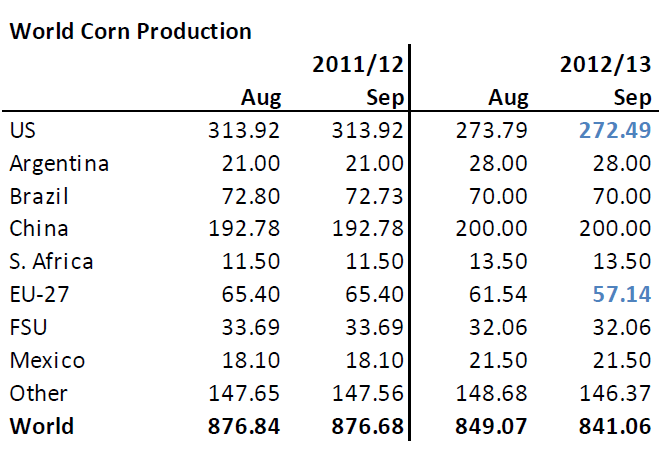
USDA justerade ner global produktion i gårdagens WASDE-rapport. Fristående analytiker som t ex Noel Fryer har dock sågat WASDE vid fotknölarna för den mycket blygsamma nedjusteringen av USA:s produktion. Han kallade det för ”impressive crap”.
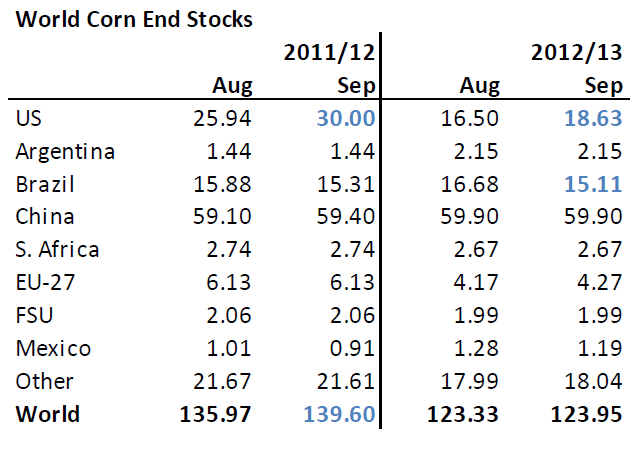
Nedan ser vi USDA:s tankar kring utgående lager.
Notera den märkliga höjningen av utgående lager för 2011/12 i USA. Det här kommer från den tidiga skörden, där 11% av amerikansk majs är skördat före den 1 september. De skriver så här: “150 Mbu old crop corn displaced from feed due to early new crop, which will also boost old crop stocks”. Men vänta lite… borde inte detta på något sätt ha påverkat 2012/13? 11% mindre hamnar trots allt på 2012/13.
För EU-27 sänkte man konsumtionen av majs med 4 mt. Men man justerade inte foderåtgången i EU med korn eller vete. Det är svångremstider även för djuren i Euroland.
En sälj-trigger vore om majs till etanol begränsades, men tiden rinner ut för att ta detta före valet i USA i november. Kongressen har misslyckats med att behandla och fatta beslut om den nya ”Farm bill” som ska gälla i de kommande fem åren. Den gamla går ut den sista september och då återvänder USA till den lag som stiftades 1949. Det mesta som är väsentligt som t ex crop insurance och food stamps (USDA:s största utgiftspost) styrs dock av andra lagar idag. Den republikanska majoriteten i Kongressen väntas faktiskt vilja vänta med förslaget till efter presidentvalet. Man kan tolka detta som att sannolikheten för att det ska hända något med majs-etanol-frågan är ganska liten i år.
Sojabönor
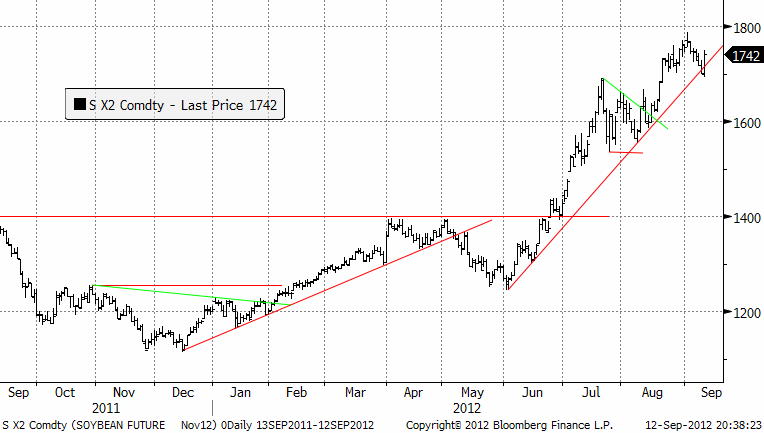
Sojabönsrapporten från USDA var tycks till skillnad från vete och majs, vara ganska genomtänkt. Den var ”bullish” för sojabönor och priset, som handlades ner innan, fick ny skjuts uppåt på rapporten.
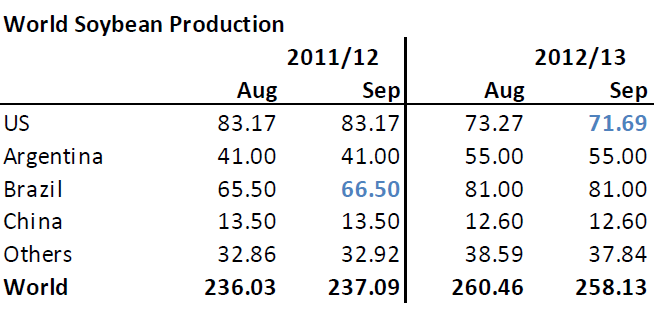
Nedan ser vi WASDE-rapportens produktionsestimat för olika länder och totalt i världen.
USA:s produktion väntas falla till den lägsta nivån på nio år. Den har fallit tre år i rad. USDA nämner den varmaste och torraste perioden juni-juli på 76 år som orsak. Skörden väntas bli 71.69 mt, vilket är lägre än vad analytiker tillfrågade av Bloomberg innan rapporten trodde. Skörden per acre väntas uppgå till 35.3 bushels, den lägsta nivån sedan 2008. I augusti trodde USDA att skörden skulle bli 36.1 bu/acre. Förra året låg den på 41.5 bu/acre.
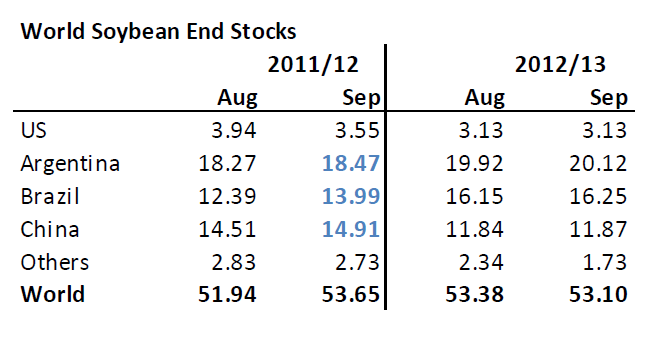
Ovanför ser vi globala utgående lager. USDA gör ett litet trick här för att lämna utgående lager 2012/13 nästan oförändrade. Man höjer utgående lager i Argentina och Brasilien och Kina med nästan 2 mt. Det verkar nästan för bra för att vara sant.
Det är, även utan att ifrågasätta hur man så lägligt kunde hitta mer sojabönor i Kina, en bullish rapport, som borde ta upp priset.
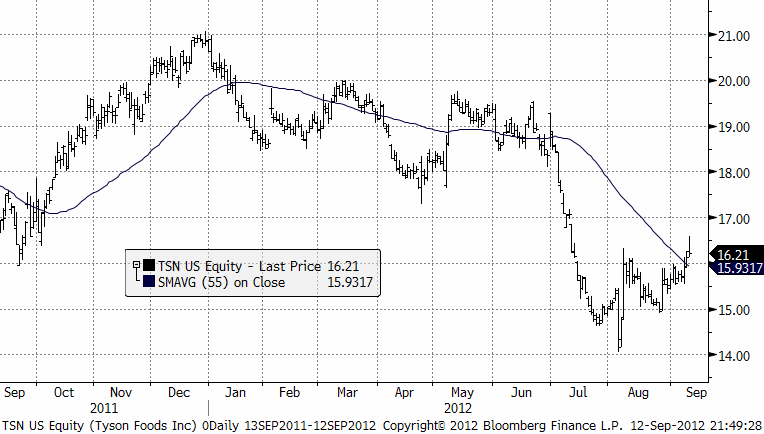
Det finns börsnoterade företag i USA som köper sojamjöl och producerar kött. Ett sådant bolag är Smithfield Foods. Ett annat är Tyson Foods. Nedan kan du se kursutvecklingen för den aktien. Notera hur tvärt kursuppgången, baserad på förhoppningar om mer helikopterpengar från Benny Bernanke, vände ner idag när WASDE-rapporten kom.
Raps
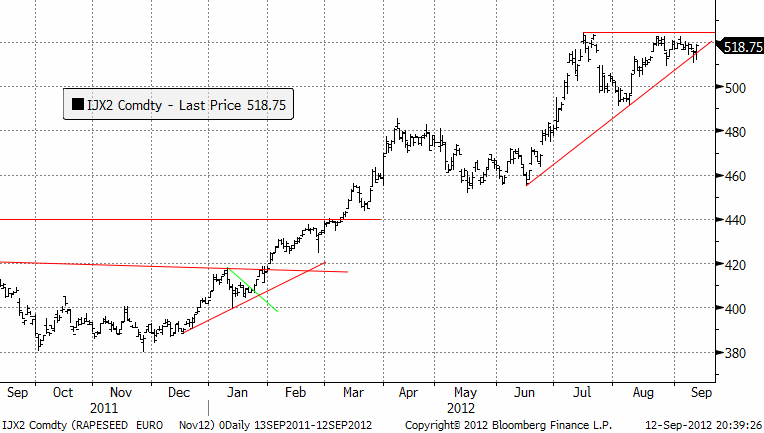
”Tryckkokaren” har fortsatt och ett utbrott uppåt rycker allt närmare. Vi rekommenderar att man behåller sin långa (köpta) position i rapsfrö. Om priset skulle gå under 497 bör man börja lätta på positionen, men priset kan faktiskt gå ända ner till bottennoteringen i augusti utan att den uppåtriktade trenden är bruten.
Gris
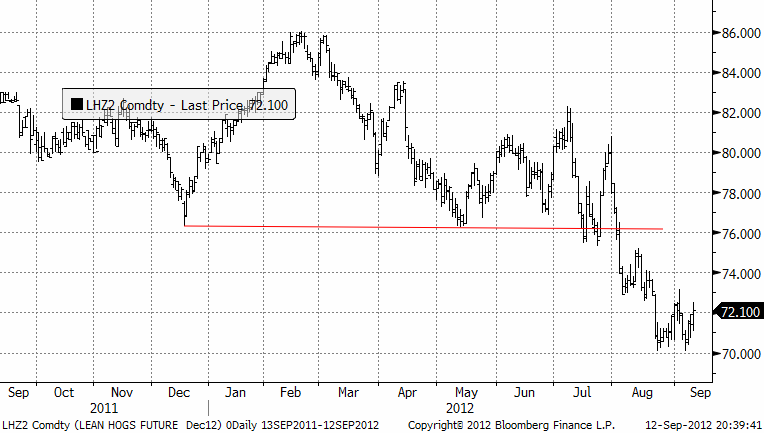
Grispriset befinner sig i en tydlig bear market. Men tycks ha kommit till en konsolideringsfas. 70 cent per pund ser ut att vara golvet på konsolideringsområdet.
Mjölk
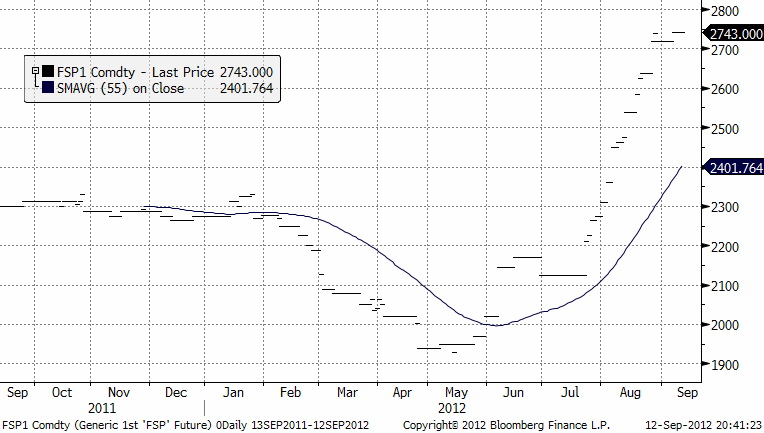
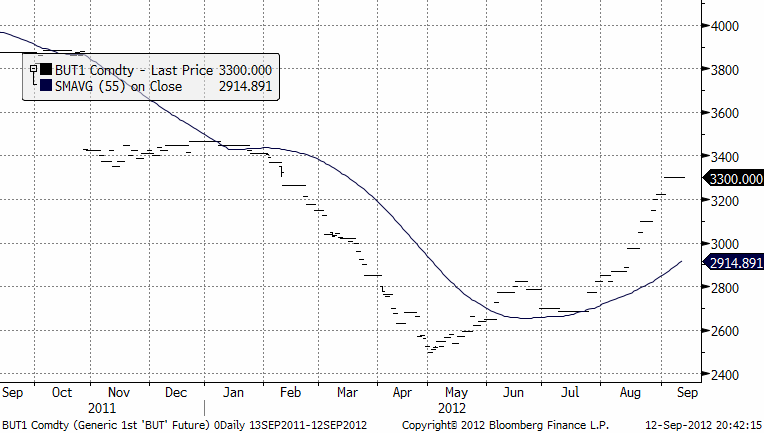
Priset på mjölkpulver i Nordeuropa ligger på samma prisnivå som förra veckan. Det är den andra veckan sedan juli när priset inte har stigit. Priset på smör ligger också oförändrat på 3300 euro per ton. Jag hade tänkt gå lite djupare i analysen av mjölkmarknaden den här veckan, men fokus hamnade på WASDE-rapportens spannmålsdelar.
Nedan ser vi priset på smör, också oktoberkontraktet såsom handlat på EUREX. Priset är angivet i euro per ton.
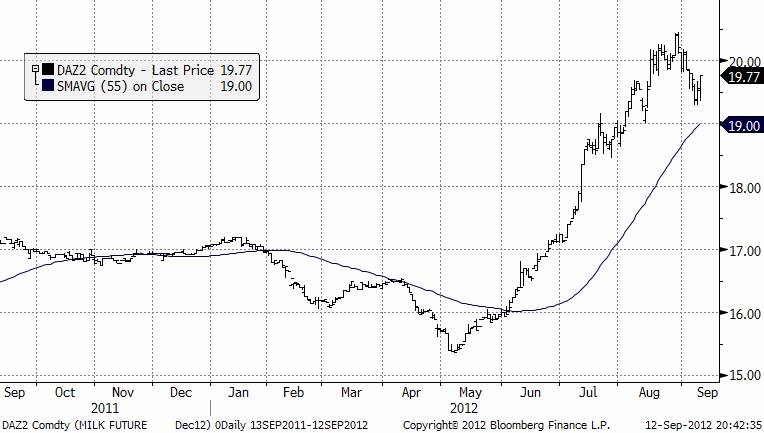
På den amerikanska börsen CME i Chicago rekylerade priset upp efter WASDE-rapporten och det högre sojapriset. Att mjölkpriset följt sojapriset så väl den senaste tiden – och det faktum att sojan ser ut att gå mot högre höjder – gör att vi tror på ett nytt test av 20 cent per pund mjölk igen.
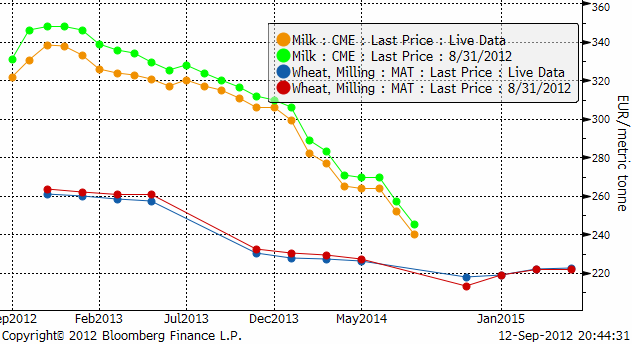
Vad säger då marknaden just nu om priserna för leverans av mjölk i USA i framtiden? Nedan ser vi terminspriserna som kurva som de ser ut idag och hur de såg ut för 7 dagar sedan. Alla priser är i euro per ton. Notera att jag också lagt in terminskurvorna idag och för 7 dagar sedan på Matifs kvarnvete.
Förra veckan berättade vi om det nya vasslepulverkontrakt som noteras på Eurex den 28 september. Det är ytterligare en viktig del för att prissätta mjölkprodukterna. Råolja prissätter man genom ”netback pricing”. Dvs genom att prissätta raffinaderiernas produkter, kan man räkna bakåt till vad ett fat råolja ”borde” vara värt. På samma sätt gör man med råvaran mjölk. Dvs man utgår från vad skummjölkspulver är värt och vad smör är värt och räknar bakåt till mjölken. Om man har ostpriser och lägger till vasslepulver, kan man räkna bakåt även för de produkterna. För att tillverka skummjölkspulver åtgår energi och tar man hänsyn till energikomponenten också kan man simulera ett mejeris marginal-ekonomi.
Socker
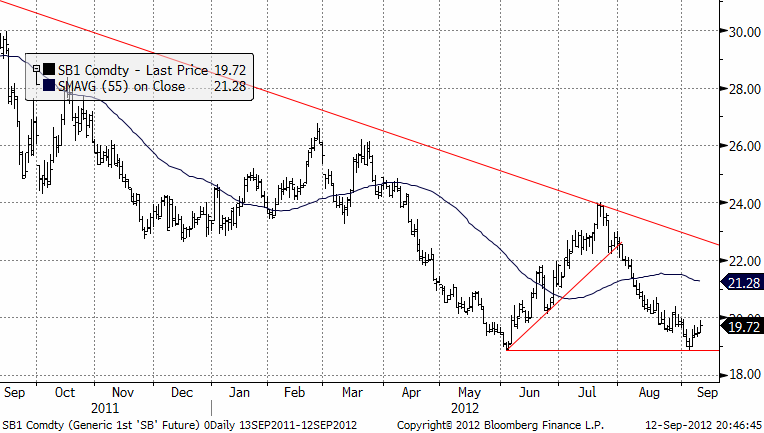
Priset på socker, tycks ha funnit ett stöd. Priset vände upp på samma nivå som i juni. Det skulle inte förvåna om priset nu steg upp mot motståndslinjen, dvs till 21 – 22 cent per pund.
EURSEK
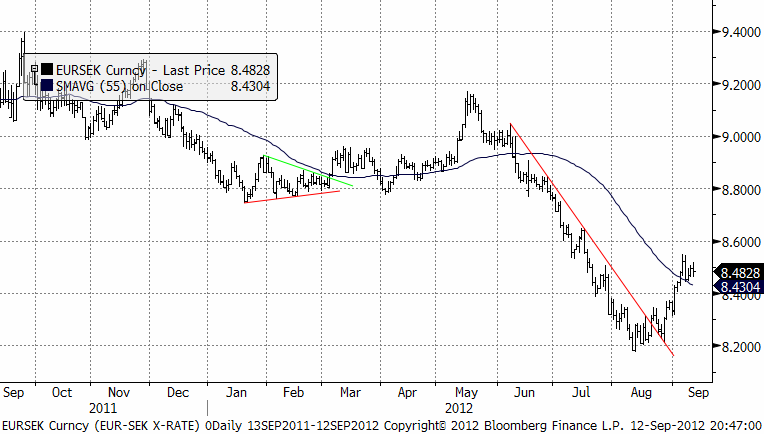
EURSEK har nått så långt upp som den borde enligt teknisk analys. Tekniskt pekar det nedåt nu och vi har säljrekommendation på euro mot kronor.
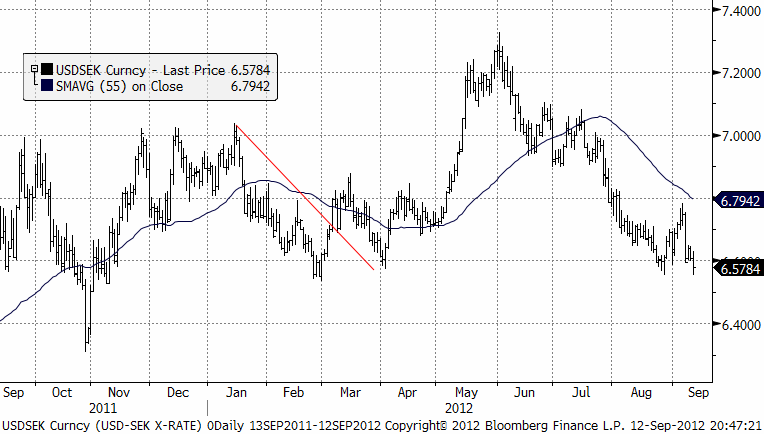
USDSEK
Dollarn befinner sig på en kursnivå med gott om stöd, historiskt. Vi tror därför på ”sidledes rörelse”.
[box]SEB Veckobrev Jordbruksprodukter är producerat av SEB Merchant Banking och publiceras i samarbete och med tillstånd på Råvarumarknaden.se[/box]
Disclaimer
The information in this document has been compiled by SEB Merchant Banking, a division within Skandinaviska Enskilda Banken AB (publ) (“SEB”).
Opinions contained in this report represent the bank’s present opinion only and are subject to change without notice. All information contained in this report has been compiled in good faith from sources believed to be reliable. However, no representation or warranty, expressed or implied, is made with respect to the completeness or accuracy of its contents and the information is not to be relied upon as authoritative. Anyone considering taking actions based upon the content of this document is urged to base his or her investment decisions upon such investigations as he or she deems necessary. This document is being provided as information only, and no specific actions are being solicited as a result of it; to the extent permitted by law, no liability whatsoever is accepted for any direct or consequential loss arising from use of this document or its contents.
About SEB
SEB is a public company incorporated in Stockholm, Sweden, with limited liability. It is a participant at major Nordic and other European Regulated Markets and Multilateral Trading Facilities (as well as some non-European equivalent markets) for trading in financial instruments, such as markets operated by NASDAQ OMX, NYSE Euronext, London Stock Exchange, Deutsche Börse, Swiss Exchanges, Turquoise and Chi-X. SEB is authorized and regulated by Finansinspektionen in Sweden; it is authorized and subject to limited regulation by the Financial Services Authority for the conduct of designated investment business in the UK, and is subject to the provisions of relevant regulators in all other jurisdictions where SEB conducts operations. SEB Merchant Banking. All rights reserved.
Analys
Crude oil soon coming to a port near you

Rebounding along with most markets. But concerns over solidity of Gaza peace may also contribute. Brent crude fell 0.8% yesterday to $61.91/b and its lowest close since May this year. This morning it is bouncing up 0.9% to $62.5/b along with a softer USD amid positive sentiment with both equities and industrial metals moving higher. Concerns that the peace in Gaza may be less solid than what one might hope for also yields some support to Brent. Bets on tech stocks are rebounding, defying fears of trade war. Money moving back into markets. Gold continues upwards its strong trend and a softer dollar helps it higher today as well.

US crude & products probably rose 5.6 mb last week (API) versus a normal seasonal decline of 2.4 mb. The US API last night partial and thus indicative data for US oil inventories. Their data indicates that US crude stocks rose 7.4 mb last week, gasoline stocks rose 3.0 mb while Distillate stocks fell 4.8 mb. Altogether an increase in commercial crude and product stocks of 5.6 mb. Commercial US crude and product stocks normally decline by 2.4 mb this time of year. So seasonally adjusted the US inventories rose 8 mb last week according to the indicative numbers by the API. That is a lot. Also, the counter seasonal trend of rising stocks versus normally declining stocks this time of year looks on a solid pace of continuation. If the API is correct then total US crude and product stocks would stand 41 mb higher than one year ago and 6 mb higher than the 2015-19 average. And if we combine this with our knowledge of a sharp increase in production and exports by OPEC(+) and a large increase in oil at sea, then the current trend in US oil inventories looks set to continue. So higher stocks and lower crude oil prices until OPEC(+) switch to cuts. Actual US oil inventory data today at 18:00 CET.
US commercial crude and product stocks rising to 1293 mb in week 41 if last nights indicative numbers from API are correct.

Crude oil soon coming to a port near you. OPEC has lifted production sharply higher this autumn. At the same time demand for oil in the Middle-East has fallen as we have moved out of summer heat and crude oil burn for power for air-conditioning. The Middle-East oil producers have thus been able to lift exports higher on both accounts. Crude oil and condensates on water has shot up by 177 mb since mid-August. This oil is now on its way to ports around the world. And when they arrive, it will likely help to lift stocks onshore higher. That is probably when we will lose the last bit of front-end backwardation the the crude oil curves. That will help to drive the front-month Brent crude oil price down to the $60/b line and revisit the high $50ies/b. Then the eyes will be all back on OPEC+ when they meet in early November and then again in early December.
Crude oil and condensates at sea have moved straight up by 177 mb since mid-August as OPEC(+) has produced more, consumed less and exported more.

Analys
The Mid-East anchor dragging crude oil lower

When it starts to move lower it moves rather quickly. Gaza, China, IEA. Brent crude is down 2.1% today to $62/b after having traded as high as $66.58/b last Thursday and above $70/b in late September. The sell-off follows the truce/peace in Gaze, a flareup in US-China trade and yet another bearish oil outlook from the IEA.

A lasting peace in Gaze could drive crude oil at sea to onshore stocks. A lasting peace in Gaza would probably calm down the Houthis and thus allow more normal shipments of crude oil to sail through the Suez Canal, the Red Sea and out through the Bab-el-Mandeb Strait. Crude oil at sea has risen from 48 mb in April to now 91 mb versus a pre-Covid normal of about 50-60 mb. The rise to 91 mb is probably the result of crude sailing around Africa to be shot to pieces by the Houthis. If sailings were to normalize through the Suez Canal, then it could free up some 40 mb in transit at sea moving onshore into stocks.
The US-China trade conflict is of course bearish for demand if it continues.
Bearish IEA yet again. Getting closer to 2026. Credibility rises. We expect OPEC to cut end of 2025. The bearish monthly report from the IEA is what it is, but the closer we get to 2026, the more likely the IEA is of being ball-park right in its outlook. In its monthly report today the IEA estimates that the need for crude oil from OPEC in 2026 will be 25.4 mb/d versus production by the group in September of 29.1 mb/d. The group thus needs to do some serious cutting at the end of 2025 if it wants to keep the market balanced and avoid inventories from skyrocketing. Given that IEA is correct that is. We do however expect OPEC to implement cuts to avoid a large increase in inventories in Q1-26. The group will probably revert to cuts either at its early December meeting when they discuss production for January or in early January when they discuss production for February. The oil price will likely head yet lower until the group reverts to cuts.
Dubai: The Mid-East anchor dragging crude oil lower. Surplus emerging in Mid-East pricing. Crude oil prices held surprisingly strong all through the summer. A sign and a key source of that strength came from the strength in the front-end backwardation of the Dubai crude oil curve. It held out strong from mid-June and all until late September with an average 1-3mth time-spread premium of $1.8/b from mid-June to end of September. The 1-3mth time-spreads for Brent and WTI however were in steady deterioration from late June while their flat prices probably were held up by the strength coming from the Persian Gulf. Then in late September the strength in the Dubai curve suddenly collapsed. Since the start of October it has been weaker than both the Brent and the WTI curves. The Dubai 1-3mth time-spread now only stands at $0.25/b. The Middle East is now exporting more as it is producing more and also consuming less following elevated summer crude burn for power (Aircon) etc.
The only bear-element missing is a sudden and solid rise in OECD stocks. The only thing that is missing for the bear-case everyone have been waiting for is a solid, visible rise in OECD stocks in general and US oil stocks specifically. So watch out for US API indications tomorrow and official US oil inventories on Thursday.
No sign of any kind of fire-sale of oil from Saudi Arabia yet. To what we can see, Saudi Arabia is not at all struggling to sell its oil. It only lowered its Official Selling Prices (OSPs) to Asia marginally for November. A surplus market + Saudi determination to sell its oil to the market would normally lead to a sharp lowering of Saudi OSPs to Asia. Not yet at least and not for November.
The 5yr contract close to fixed at $68/b. Of importance with respect to how far down oil can/will go. When the oil market moves into a surplus then the spot price starts to trade in a large discount to the 5yr contract. Typically $10-15/b below the 5yr contract on average in bear-years (2009, 2015, 2016, 2020). But the 5yr contract is usually pulled lower as well thus making this approach a moving target. But the 5yr contract price has now been rock solidly been pegged to $68/b since 2022. And in the 2022 bull-year (Brent spot average $99/b), the 5yr contract only went to $72/b on average. If we assume that the same goes for the downside and that 2026 is a bear-year then the 5yr goes to $64/b while the spot is trading at a $10-15/b discount to that. That would imply an average spot price next year of $49-54/b. But that is if OPEC doesn’t revert to cuts and instead keeps production flowing. We think OPEC(+) will trim/cut production as needed into 2026 to prevent a huge build-up in global oil stocks and a crash in prices. But for now we are still heading lower. Into the $50ies/b.
Analys
More weakness and lower price levels ahead, but the world won’t drown in oil in 2026

Some rebound but not much. Brent crude rebounded 1.5% yesterday to $65.47/b. This morning it is inching 0.2% up to $65.6/b. The lowest close last week was on Thursday at $64.11/b.

The curve structure is almost as week as it was before the weekend. The rebound we now have gotten post the message from OPEC+ over the weekend is to a large degree a rebound along the curve rather than much strengthening at the front-end of the curve. That part of the curve structure is almost as weak as it was last Thursday.
We are still on a weakening path. The message from OPEC+ over the weekend was we are still on a weakening path with rising supply from the group. It is just not as rapidly weakening as was feared ahead of the weekend when a quota hike of 500 kb/d/mth for November was discussed.
The Brent curve is on its way to full contango with Brent dipping into the $50ies/b. Thus the ongoing weakening we have had in the crude curve since the start of the year, and especially since early June, will continue until the Brent crude oil forward curve is in full contango along with visibly rising US and OECD oil inventories. The front-month Brent contract will then flip down towards the $60/b-line and below into the $50ies/b.
At what point will OPEC+ turn to cuts? The big question then becomes: When will OPEC+ turn around to make some cuts? At what (price) point will they choose to stabilize the market? Because for sure they will. Higher oil inventories, some more shedding of drilling rigs in US shale and Brent into the 50ies somewhere is probably where the group will step in.
There is nothing we have seen from the group so far which indicates that they will close their eyes, let the world drown in oil and the oil price crash to $40/b or below.
The message from OPEC+ is also about balance and stability. The world won’t drown in oil in 2026. The message from the group as far as we manage to interpret it is twofold: 1) Taking back market share which requires a lower price for non-OPEC+ to back off a bit, and 2) Oil market stability and balance. It is not just about 1. Thus fretting about how we are all going to drown in oil in 2026 is totally off the mark by just focusing on point 1.
When to buy cal 2026? Before Christmas when Brent hits $55/b and before OPEC+ holds its last meeting of the year which is likely to be in early December.
Brent crude oil prices have rebounded a bit along the forward curve. Not much strengthening in the structure of the curve. The front-end backwardation is not much stronger today than on its weakest level so far this year which was on Thursday last week.

The front-end backwardation fell to its weakest level so far this year on Thursday last week. A slight pickup yesterday and today, but still very close to the weakest year to date. More oil from OPEC+ in the coming months and softer demand and rising inventories. We are heading for yet softer levels.

-

 Nyheter3 veckor sedan
OPEC+ missar produktionsmål, stöder oljepriserna
-

 Nyheter4 veckor sedan
Ett samtal om guld, olja, fjärrvärme och förnybar energi
-

 Nyheter2 veckor sedan
Goldman Sachs höjer prognosen för guld, tror priset når 4900 USD
-

 Nyheter3 veckor sedan
Blykalla och amerikanska Oklo inleder ett samarbete
-

 Nyheter2 veckor sedan
Guld nära 4000 USD och silver 50 USD, därför kan de fortsätta stiga
-

 Analys4 veckor sedan
Are Ukraine’s attacks on Russian energy infrastructure working?
-

 Nyheter4 veckor sedan
Guldpriset uppe på nya höjder, nu 3750 USD
-

 Nyheter3 veckor sedan
Ett samtal om guld, olja, koppar och stål


