

Analys
“OPEC-put” gives floor to crude oil prices

 Oil ministers in “OPEC+” met in Abu Dhabi this weekend. There were many grades of statements but the overall takeaway was clear: “There will be cuts if needed”. I.e. if there is a “persistent supply glut”. This has been our view all the time. The market has however traded lately as if Saudi Arabia now would sit back and watch an oil market surplus evolve and say: “Well, well, nothing we can do about it.” Saudi Arabia both can and will act. They can because they produced at the highest level ever in October at 10.68 m bl/d. I.e. it is easy for them to cut back a little. Donald Trump got what he wanted to mid-term elections: a lower or at least a dampened oil price which did not fly to the sky on Iran sanctions which fully kicked in on 4 November. Now it is Saudi Arabia’s turn to get what it wants: an oil price from which it can survive. Preferably USD 85/bl but absolutely not USD 60/bl. Saudi Arabia communicated very clearly over the weekend that it will reduce oil nominations by 0.5 m bl/d in December. And voila, there you go. OPEC production down from 33 m bl/d in October to 32.5 m bl/d in December (probably). Our projected call-on-OPEC for 2019 is 32.1 m bl/d thus a little more trimming is needed, but not much.

Bjarne Schieldrop, Chief analyst commodities
Several comments from weekend’ meeting portrayed a situation where Saudi Arabia and Russia are on opposite sides. We don’t think there is all that much of a difference. None of them really want to cut, but both of them probably will cut if needed.
Aleksander Novak, the Russian energy minister, stated that we don’t even know if there will be a surplus in 2019. We completely agree. Though we have an estimated call-on-OPEC of 32.1 m bl/d for 2019 the future is definitely uncertain and the global oil market has many moving parts with Libya and Venezuela being big wild cards for 2019 on the supply side just to name a few. Just last week the IEA stated that the global oil market is entering RED-ZONE with less and less spare capacity and that OPEC needs to produce more in 2019 rather than less in order to fend off upside price with reference to reduced supply from Iran and collapsing production in Venezuela.
Our call-on-OPEC for 2019 of 32.1 m bl/d is of course fairly muted but it totally disguises the internal dynamics where declines in Venezuela and Iran leads us to a projected call-on-Saudi for 2019 of 10.7 m bl/d though highly dependent on production from the other OPEC producers for example by Libya.
The ministerial meeting between the extended OPEC group this weekend clearly launched discussions about production cuts leading up to the official OPEC meeting on 6 December in Vienna. What they all want is to avoid a consistent surplus and stock building in 2019 developing into a contango crude oil market where the spot price trades at a significant discount to longer dated prices. That would undo all of their efforts through 2017 and 2018 to draw down inventories and drive the crude curve into backwardation.
It is of course impossible for OPEC+ to predict exactly how much to produce in 2019 in advance given the multitude of moving parts in the oil market on both supply and demand. We thus expect OPEC+ to hammer out a cooperative foundation under which it has the ability to act when needed. It also needs to continue to emphasize its willingness to act when needed.
This morning Brent crude has jumped 2% on confidence that OPEC+ will cut if needed but at the moment of writing Brent is only up 1.2% from Friday at USD 71/bl. A continued stronger USD with the dollar index today climbing 0.5% to 97.4 (highest since June 2017) is a clear headwind for crude oil price gains. November month is normally a very strong dollar month. We probably need the USD index to turn to a weakening trend to properly drive the Brent crude oil price higher. A price floor for the Brent crude front month price has however now probably been set at around the USD 70/bl mark.
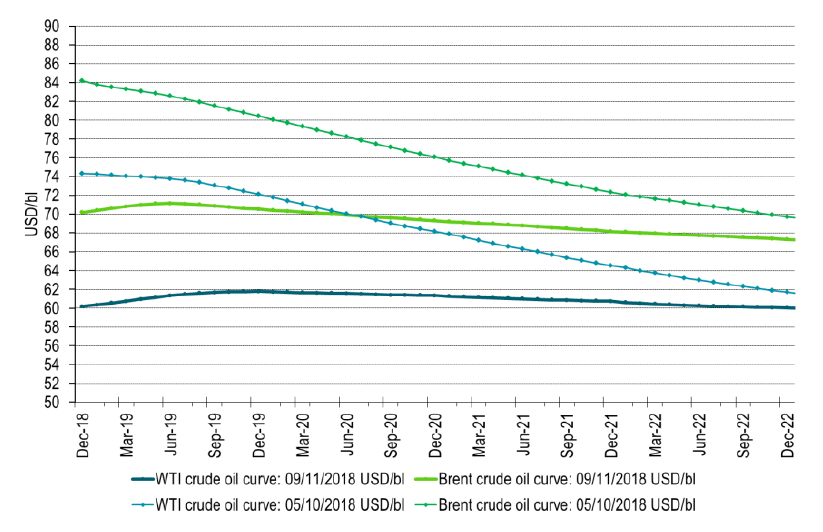
Ch1: Crude oil price curves on Friday and five weeks earlier. From backwardation to contango. Contango is what crude oil producers hate more than anything: Selling at a discount.
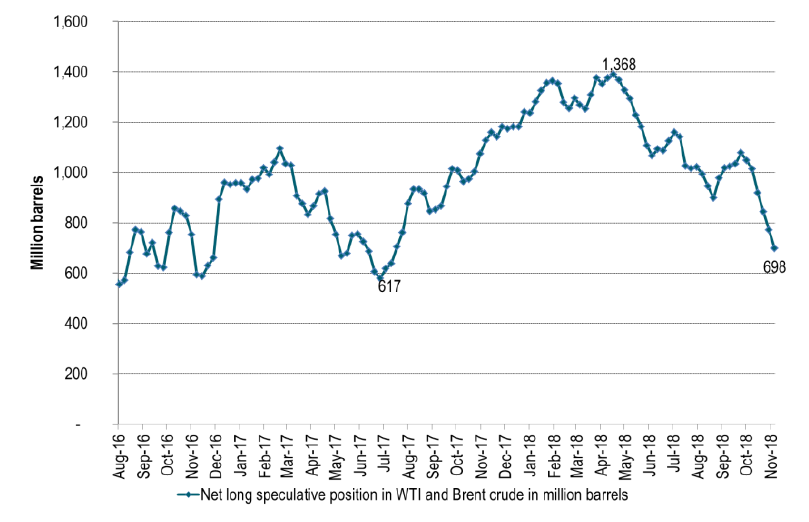
Ch2: Speculators took further exit last week and are now down towards the lowest level since mid-2017 in terms of net long contracts
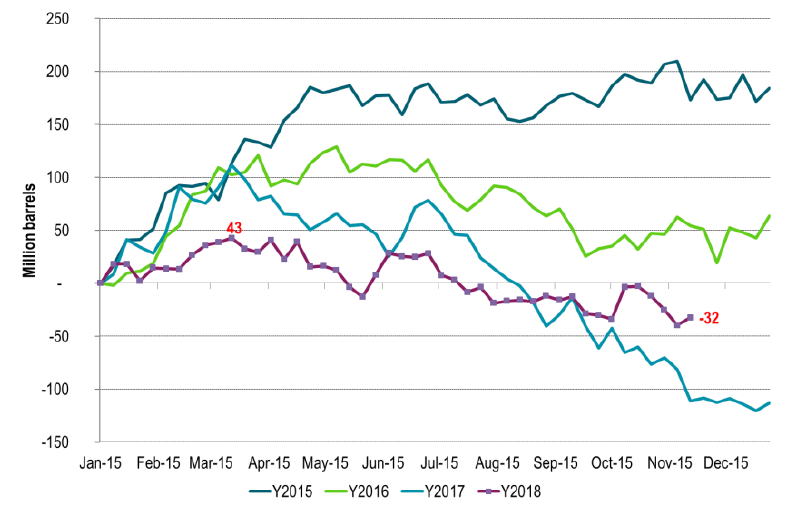
Ch4: Weekly inventories (US, EU, Sing, floating) increased a little last week. Except for a brief bump up in early October inventories have
mostly ticked lower. Inventories in the US have however increased since early October due to lack of pipelines to the US Gulf.

The latest weekly report from the US DOE showed a substantial drawdown across key petroleum categories, adding more upside potential to the fundamental picture.

Commercial crude inventories (excl. SPR) fell by 5.8 million barrels, bringing total inventories down to 415.1 million barrels. Now sitting 11% below the five-year seasonal norm and placed in the lowest 2015-2022 range (see picture below).
Product inventories also tightened further last week. Gasoline inventories declined by 2.1 million barrels, with reductions seen in both finished gasoline and blending components. Current gasoline levels are about 3% below the five-year average for this time of year.
Among products, the most notable move came in diesel, where inventories dropped by almost 4.1 million barrels, deepening the deficit to around 20% below seasonal norms – continuing to underscore the persistent supply tightness in diesel markets.
The only area of inventory growth was in propane/propylene, which posted a significant 5.1-million-barrel build and now stands 9% above the five-year average.
Total commercial petroleum inventories (crude plus refined products) declined by 4.2 million barrels on the week, reinforcing the overall tightening of US crude and products.


A classic case of “buy the rumor, sell the news” played out in oil markets, as Brent crude has dropped sharply – down nearly USD 10 per barrel since yesterday evening – following Iran’s retaliatory strike on a U.S. air base in Qatar. The immediate reaction was: “That was it?” The strike followed a carefully calibrated, non-escalatory playbook, avoiding direct threats to energy infrastructure or disruption of shipping through the Strait of Hormuz – thus calming worst-case fears.
After Monday morning’s sharp spike to USD 81.4 per barrel, triggered by the U.S. bombing of Iranian nuclear facilities, oil prices drifted sideways in anticipation of a potential Iranian response. That response came with advance warning and caused limited physical damage. Early this morning, both the U.S. President and Iranian state media announced a ceasefire, effectively placing a lid on the immediate conflict risk – at least for now.
As a result, Brent crude has now fallen by a total of USD 12 from Monday’s peak, currently trading around USD 69 per barrel.
Looking beyond geopolitics, the market will now shift its focus to the upcoming OPEC+ meeting in early July. Saudi Arabia’s decision to increase output earlier this year – despite falling prices – has drawn renewed attention considering recent developments. Some suggest this was a response to U.S. pressure to offset potential Iranian supply losses.
However, consensus is that the move was driven more by internal OPEC+ dynamics. After years of curbing production to support prices, Riyadh had grown frustrated with quota-busting by several members (notably Kazakhstan). With Saudi Arabia cutting up to 2 million barrels per day – roughly 2% of global supply – returns were diminishing, and the risk of losing market share was rising. The production increase is widely seen as an effort to reassert leadership and restore discipline within the group.
That said, the FT recently stated that, the Saudis remain wary of past missteps. In 2018, Riyadh ramped up output at Trump’s request ahead of Iran sanctions, only to see prices collapse when the U.S. granted broad waivers – triggering oversupply. Officials have reportedly made it clear they don’t intend to repeat that mistake.
The recent visit by President Trump to Saudi Arabia, which included agreements on AI, defense, and nuclear cooperation, suggests a broader strategic alignment. This has fueled speculation about a quiet “pump-for-politics” deal behind recent production moves.
Looking ahead, oil prices have now retraced the entire rally sparked by the June 13 Israel–Iran escalation. This retreat provides more political and policy space for both the U.S. and Saudi Arabia. Specifically, it makes it easier for Riyadh to scale back its three recent production hikes of 411,000 barrels each, potentially returning to more moderate increases of 137,000 barrels for August and September.
In short: with no major loss of Iranian supply to the market, OPEC+ – led by Saudi Arabia – no longer needs to compensate for a disruption that hasn’t materialized, especially not to please the U.S. at the cost of its own market strategy. As the Saudis themselves have signaled, they are unlikely to repeat previous mistakes.
Conclusion: With Brent now in the high USD 60s, buying oil looks fundamentally justified. The geopolitical premium has deflated, but tensions between Israel and Iran remain unresolved – and the risk of missteps and renewed escalation still lingers. In fact, even this morning, reports have emerged of renewed missile fire despite the declared “truce.” The path forward may be calmer – but it is far from stable.
Analys
A muted price reaction. Market looks relaxed, but it is still on edge waiting for what Iran will do
Brent crossed the 80-line this morning but quickly fell back assigning limited probability for Iran choosing to close the Strait of Hormuz. Brent traded in a range of USD 70.56 – 79.04/b last week as the market fluctuated between ”Iran wants a deal” and ”US is about to attack Iran”. At the end of the week though, Donald Trump managed to convince markets (and probably also Iran) that he would make a decision within two weeks. I.e. no imminent attack. Previously when when he has talked about ”making a decision within two weeks” he has often ended up doing nothing in the end. The oil market relaxed as a result and the week ended at USD 77.01/b which is just USD 6/b above the year to date average of USD 71/b.

Brent jumped to USD 81.4/b this morning, the highest since mid-January, but then quickly fell back to a current price of USD 78.2/b which is only up 1.5% versus the close on Friday. As such the market is pricing a fairly low probability that Iran will actually close the Strait of Hormuz. Probably because it will hurt Iranian oil exports as well as the global oil market.
It was however all smoke and mirrors. Deception. The US attacked Iran on Saturday. The attack involved 125 warplanes, submarines and surface warships and 14 bunker buster bombs were dropped on Iranian nuclear sites including Fordow, Natanz and Isfahan. In response the Iranian Parliament voted in support of closing the Strait of Hormuz where some 17 mb of crude and products is transported to the global market every day plus significant volumes of LNG. This is however merely an advise to the Supreme leader Ayatollah Ali Khamenei and the Supreme National Security Council which sits with the final and actual decision.
No supply of oil is lost yet. It is about the risk of Iran closing the Strait of Hormuz or not. So far not a single drop of oil supply has been lost to the global market. The price at the moment is all about the assessed risk of loss of supply. Will Iran choose to choke of the Strait of Hormuz or not? That is the big question. It would be painful for US consumers, for Donald Trump’s voter base, for the global economy but also for Iran and its population which relies on oil exports and income from selling oil out of that Strait as well. As such it is not a no-brainer choice for Iran to close the Strait for oil exports. And looking at the il price this morning it is clear that the oil market doesn’t assign a very high probability of it happening. It is however probably well within the capability of Iran to close the Strait off with rockets, mines, air-drones and possibly sea-drones. Just look at how Ukraine has been able to control and damage the Russian Black Sea fleet.
What to do about the highly enriched uranium which has gone missing? While the US and Israel can celebrate their destruction of Iranian nuclear facilities they are also scratching their heads over what to do with the lost Iranian nuclear material. Iran had 408 kg of highly enriched uranium (IAEA). Almost weapons grade. Enough for some 10 nuclear warheads. It seems to have been transported out of Fordow before the attack this weekend.
The market is still on edge. USD 80-something/b seems sensible while we wait. The oil market reaction to this weekend’s events is very muted so far. The market is still on edge awaiting what Iran will do. Because Iran will do something. But what and when? An oil price of 80-something seems like a sensible level until something do happen.


USA ska införa 50 procent tull på koppar

Ryska staten siktar på att konfiskera en av landets största guldproducenter

Hur säkrar vi Sveriges tillgång till kritiska metaller och mineral i en ny geopolitisk verklighet?

Lundin Mining ska bli en av de tio största kopparproducenterna i världen

Sommarvädret styr elpriset i Sverige

Stor uppsida i Lappland Guldprospekterings aktie enligt analys

Silverpriset släpar efter guldets utveckling, har mer uppsida

Uppgången i oljepriset planade ut under helgen

Mahvie Minerals växlar spår – satsar fullt ut på guld

Låga elpriser i sommar – men mellersta Sverige får en ökning
-
 Nyheter4 veckor sedan
Stor uppsida i Lappland Guldprospekterings aktie enligt analys
-
 Nyheter4 veckor sedan
Silverpriset släpar efter guldets utveckling, har mer uppsida
-
 Nyheter3 veckor sedan
Uppgången i oljepriset planade ut under helgen
-
 Nyheter2 veckor sedan
Mahvie Minerals växlar spår – satsar fullt ut på guld
-
 Nyheter3 veckor sedan
Låga elpriser i sommar – men mellersta Sverige får en ökning
-
Analys3 veckor sedan
Very relaxed at USD 75/b. Risk barometer will likely fluctuate to higher levels with Brent into the 80ies or higher coming 2-3 weeks
-

 Nyheter2 veckor sedan
Oljan, guldet och marknadens oroande tystnad
-

 Nyheter2 veckor sedan
Jonas Lindvall är tillbaka med ett nytt oljebolag, Perthro, som ska börsnoteras