

Analys
Oil price bottoming in Q1-19 seems like a fair bet

 Q1: When will pledged cuts by OPEC+ become visible in oil inventory data?
Q2: When will we see softer US oil production growth due to lower oil prices?
Q3: When will the global growth cooldown bottom out?
These are probably the key questions for when the oil price sell-off will bottom out as well. As of yet we have seen none of the above. US oil production continues to rise strongly while global growth continues to deteriorate.

Bjarne Schieldrop, Chief analyst commodities, SEB
The latest PMI’s in Asia have declined below the 50 line and thus into contractionary territory. The US EIA official October crude oil production came in at 11.537 m bl/d which is 177 k bl/d higher than what the EIA used for October in its latest monthly report. The EIA will likely have to lift its US production projection for 2019 accordingly.
During Q1-19 however we should probably see some positive effects of the cuts by OPEC+, some US oil rig count decline due to lower oil prices while the low point in bearishness over global growth will hopefully have bottomed out.
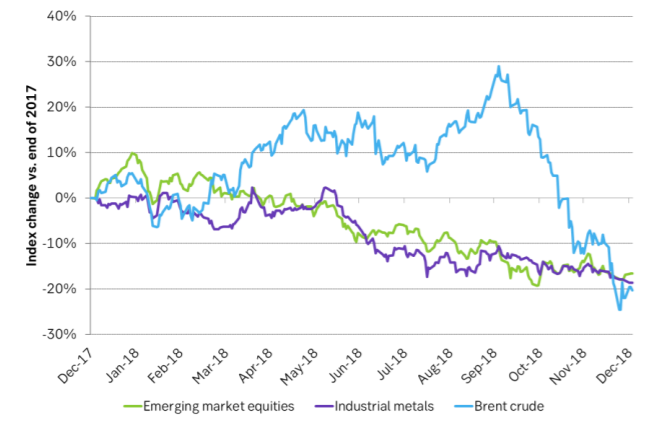
The front month Brent crude oil price declined 19.5% from end of 2017 to end of 2018 when it settled at $53.8/bl. Medium term oil prices however moved very little as the the rolling Brent crude 3yr contract only moved down 0.8% to $57.72/bl. It was of course not just oil prices which had a bad year in 2018. Industrial metals also sold off 18.6% along with emerging market equities which declined 16.6%.
The sell-off in crude oil in 2018 thus matches well with the overall sell-off in emerging market equities and industrial metals in 2018. Thus global economic cooldown in general and emerging market specifically seems to be a highly important factor for the oil price sell-off in 2018.
This brings us back to Q3 above: When will we see global growth cooldown bottom out? As we have seen with the latest PMI’s the signs are still pointing negative and lower. Data for US Q4-18 GDP is due on January 30th. This has the potential to be a real disappointment and could as such be the low point as it could change the direction of the Fed’s tightening monetary policy path.
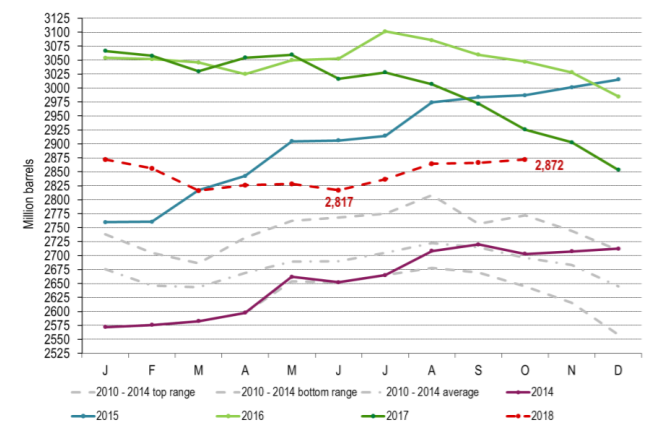
Q1 above is a bit tricky. Firstly because the pledged cuts from OPEC+ are not so big that we expect to see a steep decline in inventories but rather inventory stabilization. Thirdly because there is typically a significant delay from cuts appears to when inventories are impacted and lastly because there is also a lag in the reporting of the OECD inventories of about two months. So when we get the IEA report in April we should have the OECD inventory data for February which then should hopefully show a good stabilization of inventories. Before that we have to contend with weekly inventory data which will be followed closely and which definitely can provide some positive news much earlier than the IEA reports in March and April.
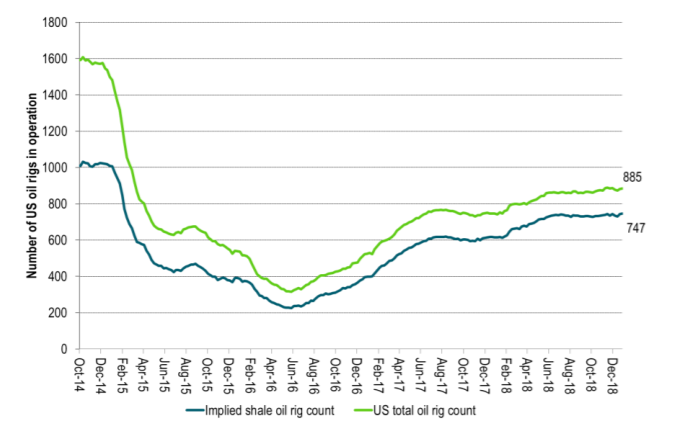
On Q2 above there have been a few US shale oil companies who have signalled that they will reduce activity/spending on drilling and completions in 2019 due to lower oil prices and we expect to see more of this. This has however not yet been reflected in a lower rig count or a lower level of well completions. During the previous “shale oil reset” the typical price inflection point was when the WTI 18 months forward crude contract moved above $45-47/bl. That was when the US shale oil rig count started to rise back in June 2016 however with a typical 6 week time lag versus the oil price. At the moment the WTI 18 mths contract trades at $48.8/bl and over the past 6 weeks it has averaged $52.2/bl. The comparable local Permian crude oil price does however trade some $5-6/bl lower with a proxy “Permian 18 mths contract” averaging $45/bl over the past 6 weeks. As such we could start to see weekly US oil rig count declines about now.
If we look ahead into Q1-19 we are likely to experience yet more negative headwinds for oil from the macroeconomic side potentially culminating with a bad Q4-18 US GDP report on 30 January. Some US oil rig count decline should materialize at current oil prices but the US EIA is likely to revise its projection for US 2019 crude production higher in its STEO report in January due to the latest October data. Inventory draws as a result of cuts by OPEC+ may not be so easily visible for a while but avoiding a steep inventory increase in H1-19 is what the market needs to see. A bottoming for the oil price during Q1-19 seems like a fair bet with higher oil prices thereafter.
Ch1: Lower oil prices have not yet started to drag US oil rig count lower. Current prices should lead to declines in Jan/Feb
Ch2: OECD oil inventories with a two months lag. Cuts by OPEC+ starts in January. Inventory effects may be visible in weekly inventory data in Jan/Feb but we will not see OECD inventoris for Jan/Feb before IEA releases its monthly oil report in Mar/Apr. OECD inventories were probably close to unchanged from Dec-17 to Dec-18.
Ch3: Industrial metals, emerging market equities and oil were not so different after all. A turn to a more positive outlook for global growth in general and emerging markets specifically may be needed to push all of them higher again even though OPEC+ is lending a helping hand to the oil market through its cuts.
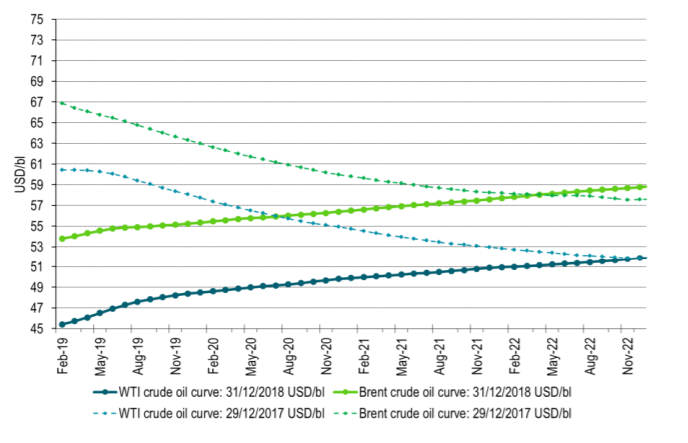
Ch4: Crude oil forward curves end of 2017 versus end of 2018. Difference is all in the front end of the curves. One year ago it was a tightening market, declining inventories and backwardation with speculators rolling into the market. Now it is contango, weakening global growth backdrop and slightly rising inventories and a huge exit of speculators from the market over the past 6 to 9 months. The longer term price anchor with Brent crude pegged around $60/bl is however intact. A flat, neutral oil market should thus maybe be around the $60/bl mark for Brent crude. Though with a question mark for the Brent to WTI crude oil price spread which may evaporate with new oil pipelines coming on-line in 2019/2020.
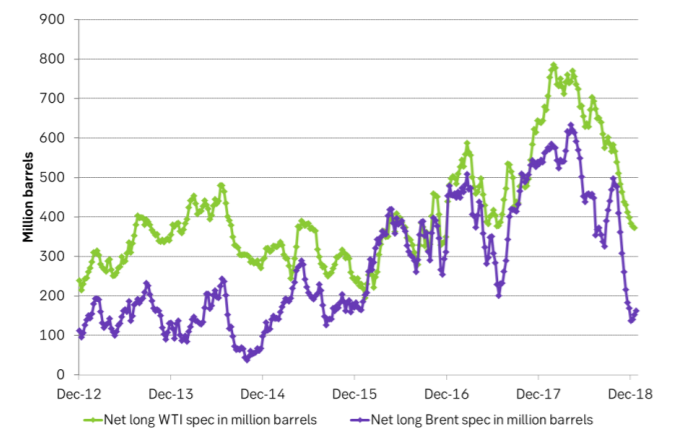
Ch5: Speculators will roll back into the market again at some point. Not a lot of net long spec in Brent crude at the moment.
Parts of the Brent crude curve dipping into the high $50ies/b. Brent crude fell 2.3% over the week to Friday. It closed the week at $61.29/b, a slight gain on the day, but also traded to a low of $60.14/b that same day and just barely avoided trading into the $50ies/b. This morning it is risk-on in equities which seems to help industrial metals a little higher. But no such luck for oil. It is down 0.8% at $60.8/b. This week looks set for Brent crude to dip its feet in the $50ies/b. The Brent 3mth contract actually traded into the high $50ies/b on Friday.

The front-end backwardation has been on a weakening foot and is now about to fully disappear. The lowest point of the crude oil curve has also moved steadily lower and lower and its discount to the 5yr contract is now $6.8/b. A solid contango. The Brent 3mth contract did actually dip into the $50ies/b intraday on Friday when it traded to a low point of $59.93/b.
More weakness to come as lots of oil at sea comes to ports. Mid-East OPEC countries have boosted exports along with lower post summer consumption and higher production. The result is highly visibly in oil at sea which increased by 17 mb to 1,311 mb over the week to Sunday. Up 185 mb since mid-August. On its way to discharge at a port somewhere over the coming month or two.
Don’t forget that the oil market path ahead is all down to OPEC+. Remember that what is playing out in the oil market now is all by design by OPEC+. The group has decided that the unwind of the voluntary cuts is what it wants to do. In a combination of meeting demand from consumers as well as taking back market share. But we need to remember that how this plays out going forward is all at the mercy of what OPEC+ decides to do. It will halt the unwinding at some point. It will revert to cuts instead of unwind at some point.
A few months with Brent at $55/b and 40-50 US shale oil rigs kicked out may be what is needed. We think OPEC+ needs to see the exit of another 40-50 drilling rigs in the US shale oil patches to set US shale oil production on a path to of a 1 mb/d year on year decline Dec-25 to Dec-26. We are not there yet. But a 2-3 months period with Brent crude averaging $55/b would probably do it.
Oil on water increased 17 mb over the week to Sunday while oil in transit increased by 23 mb. So less oil was standing still. More was moving.

Crude oil floating storage (stationary more than 7 days). Down 11 mb over week to Sunday

The lowest point of the Brent crude oil curve versus the 5yr contract. Weakest so far this year.

Crude oil 1mth to 3mth time-spreads. Dubai held out strongly through summer, but then that center of strength fell apart in late September and has been leading weakness in crude curves lower since then.

Rebounding along with most markets. But concerns over solidity of Gaza peace may also contribute. Brent crude fell 0.8% yesterday to $61.91/b and its lowest close since May this year. This morning it is bouncing up 0.9% to $62.5/b along with a softer USD amid positive sentiment with both equities and industrial metals moving higher. Concerns that the peace in Gaza may be less solid than what one might hope for also yields some support to Brent. Bets on tech stocks are rebounding, defying fears of trade war. Money moving back into markets. Gold continues upwards its strong trend and a softer dollar helps it higher today as well.
US crude & products probably rose 5.6 mb last week (API) versus a normal seasonal decline of 2.4 mb. The US API last night partial and thus indicative data for US oil inventories. Their data indicates that US crude stocks rose 7.4 mb last week, gasoline stocks rose 3.0 mb while Distillate stocks fell 4.8 mb. Altogether an increase in commercial crude and product stocks of 5.6 mb. Commercial US crude and product stocks normally decline by 2.4 mb this time of year. So seasonally adjusted the US inventories rose 8 mb last week according to the indicative numbers by the API. That is a lot. Also, the counter seasonal trend of rising stocks versus normally declining stocks this time of year looks on a solid pace of continuation. If the API is correct then total US crude and product stocks would stand 41 mb higher than one year ago and 6 mb higher than the 2015-19 average. And if we combine this with our knowledge of a sharp increase in production and exports by OPEC(+) and a large increase in oil at sea, then the current trend in US oil inventories looks set to continue. So higher stocks and lower crude oil prices until OPEC(+) switch to cuts. Actual US oil inventory data today at 18:00 CET.
US commercial crude and product stocks rising to 1293 mb in week 41 if last nights indicative numbers from API are correct.

Crude oil soon coming to a port near you. OPEC has lifted production sharply higher this autumn. At the same time demand for oil in the Middle-East has fallen as we have moved out of summer heat and crude oil burn for power for air-conditioning. The Middle-East oil producers have thus been able to lift exports higher on both accounts. Crude oil and condensates on water has shot up by 177 mb since mid-August. This oil is now on its way to ports around the world. And when they arrive, it will likely help to lift stocks onshore higher. That is probably when we will lose the last bit of front-end backwardation the the crude oil curves. That will help to drive the front-month Brent crude oil price down to the $60/b line and revisit the high $50ies/b. Then the eyes will be all back on OPEC+ when they meet in early November and then again in early December.
Crude oil and condensates at sea have moved straight up by 177 mb since mid-August as OPEC(+) has produced more, consumed less and exported more.

When it starts to move lower it moves rather quickly. Gaza, China, IEA. Brent crude is down 2.1% today to $62/b after having traded as high as $66.58/b last Thursday and above $70/b in late September. The sell-off follows the truce/peace in Gaze, a flareup in US-China trade and yet another bearish oil outlook from the IEA.
A lasting peace in Gaze could drive crude oil at sea to onshore stocks. A lasting peace in Gaza would probably calm down the Houthis and thus allow more normal shipments of crude oil to sail through the Suez Canal, the Red Sea and out through the Bab-el-Mandeb Strait. Crude oil at sea has risen from 48 mb in April to now 91 mb versus a pre-Covid normal of about 50-60 mb. The rise to 91 mb is probably the result of crude sailing around Africa to be shot to pieces by the Houthis. If sailings were to normalize through the Suez Canal, then it could free up some 40 mb in transit at sea moving onshore into stocks.
The US-China trade conflict is of course bearish for demand if it continues.
Bearish IEA yet again. Getting closer to 2026. Credibility rises. We expect OPEC to cut end of 2025. The bearish monthly report from the IEA is what it is, but the closer we get to 2026, the more likely the IEA is of being ball-park right in its outlook. In its monthly report today the IEA estimates that the need for crude oil from OPEC in 2026 will be 25.4 mb/d versus production by the group in September of 29.1 mb/d. The group thus needs to do some serious cutting at the end of 2025 if it wants to keep the market balanced and avoid inventories from skyrocketing. Given that IEA is correct that is. We do however expect OPEC to implement cuts to avoid a large increase in inventories in Q1-26. The group will probably revert to cuts either at its early December meeting when they discuss production for January or in early January when they discuss production for February. The oil price will likely head yet lower until the group reverts to cuts.
Dubai: The Mid-East anchor dragging crude oil lower. Surplus emerging in Mid-East pricing. Crude oil prices held surprisingly strong all through the summer. A sign and a key source of that strength came from the strength in the front-end backwardation of the Dubai crude oil curve. It held out strong from mid-June and all until late September with an average 1-3mth time-spread premium of $1.8/b from mid-June to end of September. The 1-3mth time-spreads for Brent and WTI however were in steady deterioration from late June while their flat prices probably were held up by the strength coming from the Persian Gulf. Then in late September the strength in the Dubai curve suddenly collapsed. Since the start of October it has been weaker than both the Brent and the WTI curves. The Dubai 1-3mth time-spread now only stands at $0.25/b. The Middle East is now exporting more as it is producing more and also consuming less following elevated summer crude burn for power (Aircon) etc.
The only bear-element missing is a sudden and solid rise in OECD stocks. The only thing that is missing for the bear-case everyone have been waiting for is a solid, visible rise in OECD stocks in general and US oil stocks specifically. So watch out for US API indications tomorrow and official US oil inventories on Thursday.
No sign of any kind of fire-sale of oil from Saudi Arabia yet. To what we can see, Saudi Arabia is not at all struggling to sell its oil. It only lowered its Official Selling Prices (OSPs) to Asia marginally for November. A surplus market + Saudi determination to sell its oil to the market would normally lead to a sharp lowering of Saudi OSPs to Asia. Not yet at least and not for November.
The 5yr contract close to fixed at $68/b. Of importance with respect to how far down oil can/will go. When the oil market moves into a surplus then the spot price starts to trade in a large discount to the 5yr contract. Typically $10-15/b below the 5yr contract on average in bear-years (2009, 2015, 2016, 2020). But the 5yr contract is usually pulled lower as well thus making this approach a moving target. But the 5yr contract price has now been rock solidly been pegged to $68/b since 2022. And in the 2022 bull-year (Brent spot average $99/b), the 5yr contract only went to $72/b on average. If we assume that the same goes for the downside and that 2026 is a bear-year then the 5yr goes to $64/b while the spot is trading at a $10-15/b discount to that. That would imply an average spot price next year of $49-54/b. But that is if OPEC doesn’t revert to cuts and instead keeps production flowing. We think OPEC(+) will trim/cut production as needed into 2026 to prevent a huge build-up in global oil stocks and a crash in prices. But for now we are still heading lower. Into the $50ies/b.


Gruvbolaget Boliden överträffade analytikernas förväntningar

Australien och USA investerar 8,5 miljarder USD för försörjningskedja av kritiska mineraler
Brent crude set to dip its feet into the high $50ies/b this week

Vad guldets uppgång egentligen betyder för världen

Spotpriset på guld över 4300 USD och silver över 54 USD

OPEC+ missar produktionsmål, stöder oljepriserna

Goldman Sachs höjer prognosen för guld, tror priset når 4900 USD

Blykalla och amerikanska Oklo inleder ett samarbete
Guld nära 4000 USD och silver 50 USD, därför kan de fortsätta stiga
Are Ukraine’s attacks on Russian energy infrastructure working?
-
 Nyheter4 veckor sedan
OPEC+ missar produktionsmål, stöder oljepriserna
-
 Nyheter2 veckor sedan
Goldman Sachs höjer prognosen för guld, tror priset når 4900 USD
-
 Nyheter3 veckor sedan
Blykalla och amerikanska Oklo inleder ett samarbete
-
 Nyheter3 veckor sedan
Guld nära 4000 USD och silver 50 USD, därför kan de fortsätta stiga
-
Analys4 veckor sedan
Are Ukraine’s attacks on Russian energy infrastructure working?
-

 Nyheter2 veckor sedan
Leading Edge Materials är på rätt plats i rätt tid
-

 Nyheter3 veckor sedan
Ett samtal om guld, olja, koppar och stål
-

 Nyheter2 veckor sedan
Nytt prisrekord, guld stiger över 4000 USD