

Analys
Oil and Dollar – A self-reinforcing feedback loop

 There is an intimate relationship between the oil price and the USD. Looking back at the crude oil price and the USD Index since 2013 they are mirror images of each other. We argue that it is not only a one way street from a weaker USD to a nominally higher crude oil price. There is also likely a link from a stronger crude oil price to a weaker USD as well. In addition we also have that OPEC & Co is forcing the oil price higher through their cuts while Donald Trump is promoting a softer USD amid a global economy which is reviving. We are currently in a Merry-go-round circle which is feeding on itself pushing crude prices higher, the USD lower which again is bullish for Emerging Markets which is bullish again for commodity demand,… If the circle is not stopped by verbal intervention from either OPEC & Co on the oil price or ECB on the Eurodollar side then this circle could spiral higher with Brent crude rising another 10% to $77/bl while the USD Index moves back to its 2014 level of 80 points. But both the dollar and crude prices are technically very stretch at the moment and ripe for corrections.
Price action – Higher on a softer USD and bullish WTI on Cushing draw
Yesterday the USD Index fell 1% while the Brent 1mth contract gained 0.8% to $70.53/bl. Brent crude thus actually fell 0.2% in real terms. The dollar was trading lower and lower all through the day. Brent crude also traded in bearish territory most of the day while it normally should have taken a bullish queue from the softer USD. The view that Brent has gone too far already probably weighted on the crude oil price. Brent was trying to move lower while the softening USD Index pulled stronger and stronger in the bullish direction.
Brent crude caved in to bullish push from the weaker dollar when the US inventory data came in at 16:30 CET. It showed that US crude stocks declined 1.1 m bl last week while the market had feared a gain of 4.8 m bl following the indicative numbers from API on Tuesday evening. Great relief. No decline. In addition the crude stocks in Cushing declined a full 3.2 m bl which gave a real boost to WTI crude prices relative to Brent crude. All in all for crude, gasoline and middle distillates there was a rise of 3.6 m bl which is not really all bullish. However, it was clearly bullish for WTI crude prices versus Brent and the whole mood just turned bullish. The Brent bears caved in to the bullish push from WTI and the strong bullish push from the weaker USD and up it went. This morning we have some follow-through as the USD Index declines another 0.2% while Brent trades 0.5% higher at $70.9/bl.
A higher crude oil price is dollar bearish – The feedback loop
A pure 50% devaluation of the USD would obviously lead to a doubling of the nominal crude oil price. The dollar is just a unit of measure. If the yardstick shrinks by 50% then the amount measured will have to double.
There is also another effect in reverse. If the crude oil price increases strongly then it is also dollar bearish and if it falls strongly it is dollar bullish. This is probably why we have such an incredible mirror image of the USD Index and the Brent crude oil price since 2013. The huge drop in the Brent crude oil price from mid-2014 was not driven by a weaker USD but by surplus crude and OPEC moving from a price game to a market share game.
In 2014 the US had a net petroleum import of 5 m bl/d and China imported of 6 m bl/d. Every dollar increase in the crude oil price results in a $4bn increase in the yearly expenditure of USD for China and US crude imports.
From mid-2014 the crude oil price moved from $110/bl to a low of $27/bl in early 2016. That is a decline of 83 dollar per barrel. If this difference sustained for a full year it would have and impact of $333bn. In comparison the US trade deficit is roughly $500bn per year. So the oil price drop equaled a 70% drop in the US trade deficit in terms of magnitude.
When the US spends USD on oil imports it receives crude oil and sends USD into the global market place. First into the pockets of global oil producers like Russia and OPEC. Then these dollars are spent in the global market place by them. A high crude oil price results in a larger flow of dollar from the US into the global market place and is thus dollar bearish. Russia for example will have a good dollar situation when the oil price is high as it receives a lot of USDs. A sharp decline in the oil price leads to less dollar being sent out of the US to global oil producers and into the global market place and is thus dollar bullish.
Most other countries than the US do not have this impact on the dollar cycle because they do not have dollar as their currency. When Europe for example purchases and imports crude oil it has to first buy the dollars in the global market place in exchange for euros. Then it spends the dollar for oil sending them to Russia and OPEC which then sends them back into the global market place when they spend it. Thus Europe’s oil imports are dollar neutral in terms of varying crude oil prices.
China is however a different case than most other countries. It has a dollar surplus to start with due to its trade surplus with the US. Normally this surplus of dollars are recirculated back into the US as China buys US treasuries, different bonds, equities or other US assets. A part of China’s dollar surplus is however spent on its crude oil imports and is thus fed to Russia or OPEC and then into the global market. China does not need to go into the market in the first place to purchase the dollar which it spends on crude oil imports. When the price of crude oil falls sharply then China will spend less of its surplus of dollar on crude oil and instead recirculate it back into the US by purchasing US assets. So a sharply lower oil price means China will feed a significantly lower amount of dollar into the global market place. Due to its dollar surplus and dollar recycling China is not dollar neutral in its crude oil import as Europe is.
The crude oil price has moved higher since early 2016 and sharply higher since June 2017. It has probably had an impact on the USD as it means a larger flow of dollar from the US and from China being fed into the global offshore dollar market via global oil producers like OPEC and Russia. It has relieved a dollar shortage among the world’s oil producers
At the moment there is thus likely a self-reinforcing cycle feeding a higher crude oil price and a softer USD. The USD is of course primed for weakness due to other reasons as well. That is also the case for Brent crude for which OPEC & Co has set the market up for tightness. So crude oil moves higher, the dollar moves lower which again implies a higher nominal crude price. The softer dollar is also EM bullish as it reduces their dollar payment burden of debt. So softer dollar leads to more bullish EM which again means stronger commodity demand and again a higher oil price. That’s a great Merry go round circle!
In the shorter term we are likely set for a correction in the dollar weakening. Verbal intervention from the ECB is probable. That would also likely be a trigger for a correction in Brent crude as it now has the most technically stretched level since 2011.
However, if there really is significant relationship going from the crude oil price to to dollar it means that the current crude oil price revival is now pointing us in the direction of a dollar Index level which we last saw back in 2014 which is another 10% lower at an index level of 80. A 10% softer USD also means a 10% nominally higher crude oil price. The current [oil to dollar] feeding cycle can thus go upwards/downwards to $77/bl for Brent crude oil and to 80 for the dollar index unless OPEC & Co stops the oil rally or the ECB stops the euro appreciation and the dollar weakening.
Chart 1: US dollar and oil – The mirror image
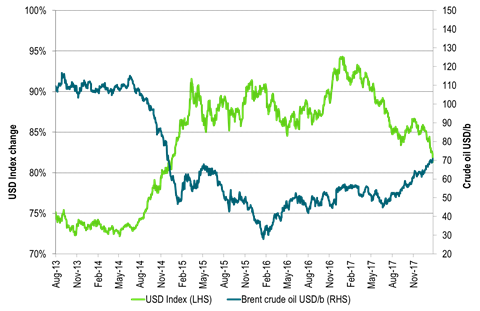
Chart 2: The market is tight as in 2013/14 shown by Brent spot versus Brent 1mth contract
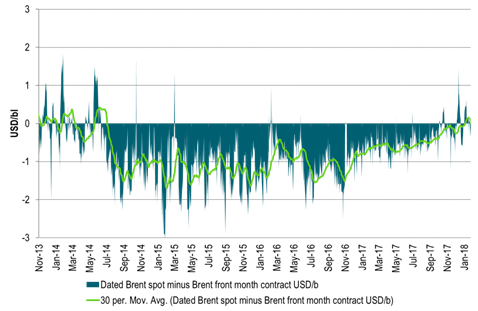
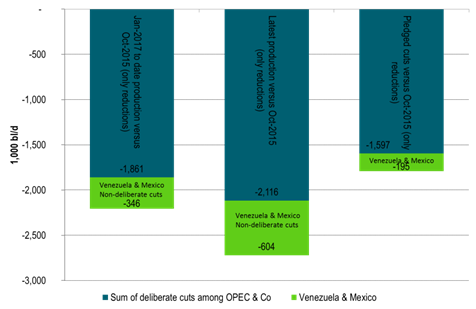
Chart 3: Deliberate OPEC & Co production cuts of 2.1 m bl/d
Sum of cuts not including gains by Libya, Nigeria etc
Kind regards
Bjarne Schieldrop
Chief analyst, Commodities
SEB Markets
Merchant Banking
Down on Friday. Up on Monday. The Brent June crude oil contract traded down 5.1% last week to a close of $90.38/b. It reached a high of $103.87/b last Monday and a low of $86.09/b on Friday as Iran announced that the Strait of Hormuz was fully open for transit. That quickly changed over the weekend as the US upheld its blockade of Iranian oil exports while Iran naturally responded by closing the SoH again. The US blew a hole in the engine room of the Iranian ship TOUSKA and took custody of the ship on Sunday. Brent crude is up 5.6% this morning to $95.4/b.

The cease-fire is expiring tomorrow. The US has said it will send a delegation for a second round of negotiations in Islamabad in Pakistan. But Iran has for now rejected a second round of talks as it views US demands as unrealistic and excessive while the US is also blocking the Strait of Hormuz.
While Brent is up 5% this morning, the financial market is still very optimistic that progress will be made. That talks will continue and that the SoH will fully open by the start of May which is consistent with a rest-of-year average Brent crude oil price of around $90/b with the market now trading that balance at around $88/b.
Financial optimism vs. physical deterioration. We have a divergence where the financial market is trading negotiations, improvements and resolution while at the same time the physical market is deteriorating day by day. Physical oil flows remain constrained by disrupted flows, longer voyage times and elevated freight and insurance costs.
Financial markets are betting that a US/Iranian resolution will save us in time from violent shortages down the road. But every day that the SoH remains closed is bringing us closer to a potentially very painful point of shortages and much higher prices.
The US blockade is also a weapon of leverage against its European and Asian allies. When Iran closed the SoH it held the world economy as a hostage against the US. The US blockade of the SoH is of course blocking Iranian oil exports. But it is also an action of disruption directed towards Europe and Asia. The US has called for the rest of the world to engaged in the war with Iran: ”If you want oil from the Persian Gulf, then go and get it”. A risk is that the US plays brinkmanship with the global oil market directed towards its European and Asian allies and maybe even towards China to force them to engage and take part. Maybe unthinkable. But unthinkable has become the norm with Trump in the White House.
Wild moves yesterday. Brent crude traded to a high of $114.43/b and a low of $96.0/b and closed at $99.94/b yesterday.
US – Iran negotiations ongoing or not? What a day. Donald Trump announced that good talks were ongoing between Iran and the US and that the 48 hour deadline before bombing Iranian power plants and energy infrastructure was postponed by five days subject to success of ongoing meetings. Iranian media meanwhile stated that no meetings were ongoing at all.
Today we are scratching our heads trying to figure out what yesterday was all about.
Friends and family playing the market? Was it just Trump and his friends and family who were playing with oil and equity markets with $580m and $1.46bn in bets being placed by someone in oil and equity markets just 15 minutes before Trump’s announcement?
Was Trump pulling a TACO as he reached his political and economic pain point: Brent at $112/b, US Gas at $4/gal, SPX below 200dma and US 10yr above 4.4%?
Different Iranian factions with Trump talking with one of them? Are there real negotiations going on but with the US talking to one faction in Iran while another, the hardliners, are not involved and are denying any such negotiations going on?
Extending the ultimatum to attack and invade Kharg island next weekend? Or, is the five day delay of the deadline a tactical decision to allow US amphibious assault ships and marines to arrive in the Gulf in the upcoming weekend while US and Israeli continues to degrade Iranian military targets till then. And then next weekend a move by the US/Israel to attack and conquer for example the Kharg island?
We do not really know which it is or maybe a combination of these.
We did get some kind of TACO ydy. But markets have been waiting for some kind of TACO to happen and yesterday we got some kind of TACO. And Brent crude is now trading at $101.5/b as a result rather than at $112-114/b as it did no the high yesterday.
But what really matters in our view is the political situation on the ground in Iran. Will hardliners continue to hold power or will a more pragmatic faction gain power?
If the hardliners remain in power then oil pain should extend all the way to US midterm elections. The hardliners were apparently still in charge as of last week. Iran immediately retaliated and damaged LNG infrastructure in Qatar after Israel hit Iranian South Pars. The SoH was still closed and all messages coming out of Iran indicated defiance. Hardliners continues in power has a huge consequence for oil prices going forward. The regime has played its ’oil-weapon’ (closing or chocking the Strait of Hormuz). It is using it to achieve political goals. Deterrence: it needs to be so politically and economically expensive to attack Iran that it won’t happen again in the future. Or at least that the US/Israel thinks 10-times over before they attack again. The highest Brent crude oil closing price since the start of the war is $112.19/b last Friday. In comparison the 20-year inflation adjusted Brent price is $103/b. So Brent crude last Friday at $112.19/b isn’t a shockingly high price. And it is still far below the nominal high of $148/b from 2008 which is $220/b if inflation adjusted. So once in a lifetime Iran activates its most powerful weapon. The oil weapon. It needs to show the power of this weapon and it needs to reap political gains. Getting Brent to $112/b and intraday high of $119.5/b (9 March) isn’t a display of the power of that weapon. And it is not a deterrence against future attacks.
So if the hardliners remain in power in Iran, then the SoH will likely remain chocked all the way to US midterm elections and Brent crude will at a minimum go above the historical nominal high of $148/b from 2008.
Thus the outlook for the oil price for the rest of the year doesn’t depend all that much of whether Trump pulls a TACO or not. Stops bombing or not. It depends more on who is in charge in Iran. If it is the hardliners, then deterrence against future attacks via chocking of the SoH and high oil prices is the likely line of action. It is impacting the world but the Iranian ’oil-weapon’ is directed towards the US president and the the US midterm elections.
If a pragmatic faction gets to power in Iran, then a very prosperous future is possible. However, if power is shifting towards a more pragmatic faction in Iran then a completely different direction could evolve. Such a faction could possibly be open for cooperation with the US and the GCC and possibly put its issues versus Israel aside. Then the prosperity we have seen evolving in Dubai could be a possible future also for Iran.
So far it looks like the hardliners are fully in charge. As far as we can see, the hardliners are still fully in control in Iran. That points towards continued chocking of the SoH and oil prices ticking higher as global inventories (the oil market buffers) are drawn lower. And not just for a few more weeks, but possibly all the way to the US midterm elections.
A brief sigh of relief yesterday as oil infra at Kharg wasn’t damaged. But higher today. Brent crude dabbled around a bit yesterday in relief that oil infrastructure at Iran’s Kharg island wasn’t damaged. It traded briefly below the 100-line and in a range of $99.54 – 106.5/b. Its close was near the low at $100.21/b.
No easy victorious way out for Trump. So no end in sight yet. Brent is up 3.2% today to $103.4/b with no signs that the war will end anytime soon. Trump has no easy way to declare victory and mission accomplished as long as Iran is in full control of the Strait of Hormuz while also holding some 440 kg of uranium enriched to 60% and not far from weapons grade at 90%. As long as these two factors are unresolved it is difficult for Trump to pull out of the Middle East. Naturally he gets increasingly frustrated over the situation as the oil price and US retail gas prices keeps ticking higher while the US is tied into the mess in the Middle East. Trying to drag NATO members into his mess but not much luck there.
When commodity prices spike they spike 2x, 3x, 4x or 5x. Supply and demand for commodities are notoriously inflexible. When either of them shifts sharply, the the price can easily go to zero (April 2022) or multiply 2x, 3x, or even 5x of normal. Examples in case cobalt in 2025 where Kongo restricted supply and the price doubled. Global LNG in 2022 where the price went 5x normal for the full year average. Demand for tungsten in ammunition is up strongly along with full war in the middle east. And its price? Up 537%.
Why hasn’t the Brent crude oil price gone 2x, 3x, 4x or 5x versus its normal of $68/b given close to full stop in the flow of oil of the Strait of Hormuz? We are after all talking about close to 20% of global supply being disrupted. The reason is the buffers. It is fairly easy to store oil. Commercial operators only hold stocks for logistical variations. It is a lot of oil in commercial stocks, but that is predominantly because the whole oil system is so huge. In addition we have Strategic Petroleum Reserves (SPRs) of close to 2500 mb of crude and 1000 mb of oil products. The IEA last week decided to release 400 mb from global SPR. Equal to 20 days of full closure of the Strait of Hormuz. Thus oil in commercial stocks on land, commercial oil in transit at sea and release of oil from SPRs is currently buffering the situation.
But we are running the buffers down day by day. As a result we see gradually increasing stress here and there in the global oil market. Asia is feeling the pinch the most. It has very low self sufficiency of oil and most of the exports from the Gulf normally head to Asia. Availability of propane and butane many places in India (LPG) has dried up very quickly. Local prices have tripled as a result. Local availability of crude, bunker oil, fuel oil, jet fuel, naphtha and other oil products is quickly running down to critical levels many places in Asia with prices shooting up. Oman crude oil is marked at $153/b. Jet fuel in Singapore is marked at $191/b.
Oil at sea originating from Strait of Hormuz from before 28 Feb is rapidly emptied. Oil at sea is a large pool of commercial oil. An inventory of oil in constant move. If we assume that the average journey from the Persian Gulf to its destinations has a volume weighted average of 13.5 days then the amount of oil at sea originating from the Persian Gulf when the the US/Israel attacked on 28 Feb was 13.5 days * 20 mb/d = 269 mb. Since the strait closed, this oil has increasingly been delivered at its destinations. Those closest to the Strait, like Pakistan, felt the emptying of this supply chain the fastest. Propane prices shooting to 3x normal there already last week and restaurants serving cold food this week is a result of that. Some 50-60% of Asia’s imports of Naphtha normally originates from the Persian Gulf. So naphtha is a natural pain point for Asia. The Gulf also a large and important exporter of Jet fuel. That shut in has lifted jet prices above $200/b.
To simplify our calculations we assume that no oil has left the Strait since that date and that there is no increase in Saudi exports from Yanbu. Then the draining of this inventory at sea originated from the Persian Gulf will essentially look like this:
The supply chain of oil at sea originating from the Strait of Hormuz is soon empty. Except for oil allowed through the Strait of Hormuz by Iran and increased exports from Yanbu in the Red Sea. Not included here.

Oil at sea is falling fast as oil is delivered without any new refill in the Persian Gulf. Waivers for Russian crude is also shifting Russian crude to consumers. Brent crude will likely start to feel the pinch much more forcefully when oil at sea is drawn down another 200 mb to around 1000 mb. That is not much more than 10 days from here.

Oil and oil products are starting to become very pricy many places. Brent crude has still been shielded from spiking like the others.


Market Still Betting on Timely Resolution, But Each Day Raises Shortage Risk

Christian Kopfer om läget för oljan

Marknaden måste börja betrakta de höga kopparpriserna som det nya normala

Det fysiska spotpriset på brentolja har slagit nytt rekord

40 minuter med Javier Blas om hur världen verkligen påverkas av energikrisen
40 minuter med Javier Blas om hur världen verkligen påverkas av energikrisen

Elpriserna fördubblas, stor osäkerhet inför sommaren

MP Materials, USA:s svar på Kinas dominans över sällsynta jordartsmetaller
Det fysiska spotpriset på brentolja har slagit nytt rekord

Studsvik har idag ansökt om att få bygga 1200-1600 MW kärnkraft i Valdemarsvik
-
 Nyheter3 veckor sedan
40 minuter med Javier Blas om hur världen verkligen påverkas av energikrisen
-
 Nyheter4 veckor sedan
Elpriserna fördubblas, stor osäkerhet inför sommaren
-
 Nyheter4 veckor sedan
MP Materials, USA:s svar på Kinas dominans över sällsynta jordartsmetaller
-
 Nyheter3 veckor sedan
Det fysiska spotpriset på brentolja har slagit nytt rekord
-
 Nyheter4 veckor sedan
Studsvik har idag ansökt om att få bygga 1200-1600 MW kärnkraft i Valdemarsvik
-
 Nyheter2 veckor sedan
Marknaden måste börja betrakta de höga kopparpriserna som det nya normala
-
Analys4 veckor sedan
TACO (or Whatever It Was) Sends Oil Lower — Iran Keeps Choking Hormuz
-

 Nyheter4 veckor sedan
Matproduktion är beroende av gödsel, Gulfkriget skapar brist