

Analys
Oil and Dollar – A self-reinforcing feedback loop

 There is an intimate relationship between the oil price and the USD. Looking back at the crude oil price and the USD Index since 2013 they are mirror images of each other. We argue that it is not only a one way street from a weaker USD to a nominally higher crude oil price. There is also likely a link from a stronger crude oil price to a weaker USD as well. In addition we also have that OPEC & Co is forcing the oil price higher through their cuts while Donald Trump is promoting a softer USD amid a global economy which is reviving. We are currently in a Merry-go-round circle which is feeding on itself pushing crude prices higher, the USD lower which again is bullish for Emerging Markets which is bullish again for commodity demand,… If the circle is not stopped by verbal intervention from either OPEC & Co on the oil price or ECB on the Eurodollar side then this circle could spiral higher with Brent crude rising another 10% to $77/bl while the USD Index moves back to its 2014 level of 80 points. But both the dollar and crude prices are technically very stretch at the moment and ripe for corrections.
Price action – Higher on a softer USD and bullish WTI on Cushing draw
Yesterday the USD Index fell 1% while the Brent 1mth contract gained 0.8% to $70.53/bl. Brent crude thus actually fell 0.2% in real terms. The dollar was trading lower and lower all through the day. Brent crude also traded in bearish territory most of the day while it normally should have taken a bullish queue from the softer USD. The view that Brent has gone too far already probably weighted on the crude oil price. Brent was trying to move lower while the softening USD Index pulled stronger and stronger in the bullish direction.
Brent crude caved in to bullish push from the weaker dollar when the US inventory data came in at 16:30 CET. It showed that US crude stocks declined 1.1 m bl last week while the market had feared a gain of 4.8 m bl following the indicative numbers from API on Tuesday evening. Great relief. No decline. In addition the crude stocks in Cushing declined a full 3.2 m bl which gave a real boost to WTI crude prices relative to Brent crude. All in all for crude, gasoline and middle distillates there was a rise of 3.6 m bl which is not really all bullish. However, it was clearly bullish for WTI crude prices versus Brent and the whole mood just turned bullish. The Brent bears caved in to the bullish push from WTI and the strong bullish push from the weaker USD and up it went. This morning we have some follow-through as the USD Index declines another 0.2% while Brent trades 0.5% higher at $70.9/bl.
A higher crude oil price is dollar bearish – The feedback loop
A pure 50% devaluation of the USD would obviously lead to a doubling of the nominal crude oil price. The dollar is just a unit of measure. If the yardstick shrinks by 50% then the amount measured will have to double.
There is also another effect in reverse. If the crude oil price increases strongly then it is also dollar bearish and if it falls strongly it is dollar bullish. This is probably why we have such an incredible mirror image of the USD Index and the Brent crude oil price since 2013. The huge drop in the Brent crude oil price from mid-2014 was not driven by a weaker USD but by surplus crude and OPEC moving from a price game to a market share game.
In 2014 the US had a net petroleum import of 5 m bl/d and China imported of 6 m bl/d. Every dollar increase in the crude oil price results in a $4bn increase in the yearly expenditure of USD for China and US crude imports.
From mid-2014 the crude oil price moved from $110/bl to a low of $27/bl in early 2016. That is a decline of 83 dollar per barrel. If this difference sustained for a full year it would have and impact of $333bn. In comparison the US trade deficit is roughly $500bn per year. So the oil price drop equaled a 70% drop in the US trade deficit in terms of magnitude.
When the US spends USD on oil imports it receives crude oil and sends USD into the global market place. First into the pockets of global oil producers like Russia and OPEC. Then these dollars are spent in the global market place by them. A high crude oil price results in a larger flow of dollar from the US into the global market place and is thus dollar bearish. Russia for example will have a good dollar situation when the oil price is high as it receives a lot of USDs. A sharp decline in the oil price leads to less dollar being sent out of the US to global oil producers and into the global market place and is thus dollar bullish.
Most other countries than the US do not have this impact on the dollar cycle because they do not have dollar as their currency. When Europe for example purchases and imports crude oil it has to first buy the dollars in the global market place in exchange for euros. Then it spends the dollar for oil sending them to Russia and OPEC which then sends them back into the global market place when they spend it. Thus Europe’s oil imports are dollar neutral in terms of varying crude oil prices.
China is however a different case than most other countries. It has a dollar surplus to start with due to its trade surplus with the US. Normally this surplus of dollars are recirculated back into the US as China buys US treasuries, different bonds, equities or other US assets. A part of China’s dollar surplus is however spent on its crude oil imports and is thus fed to Russia or OPEC and then into the global market. China does not need to go into the market in the first place to purchase the dollar which it spends on crude oil imports. When the price of crude oil falls sharply then China will spend less of its surplus of dollar on crude oil and instead recirculate it back into the US by purchasing US assets. So a sharply lower oil price means China will feed a significantly lower amount of dollar into the global market place. Due to its dollar surplus and dollar recycling China is not dollar neutral in its crude oil import as Europe is.
The crude oil price has moved higher since early 2016 and sharply higher since June 2017. It has probably had an impact on the USD as it means a larger flow of dollar from the US and from China being fed into the global offshore dollar market via global oil producers like OPEC and Russia. It has relieved a dollar shortage among the world’s oil producers
At the moment there is thus likely a self-reinforcing cycle feeding a higher crude oil price and a softer USD. The USD is of course primed for weakness due to other reasons as well. That is also the case for Brent crude for which OPEC & Co has set the market up for tightness. So crude oil moves higher, the dollar moves lower which again implies a higher nominal crude price. The softer dollar is also EM bullish as it reduces their dollar payment burden of debt. So softer dollar leads to more bullish EM which again means stronger commodity demand and again a higher oil price. That’s a great Merry go round circle!
In the shorter term we are likely set for a correction in the dollar weakening. Verbal intervention from the ECB is probable. That would also likely be a trigger for a correction in Brent crude as it now has the most technically stretched level since 2011.
However, if there really is significant relationship going from the crude oil price to to dollar it means that the current crude oil price revival is now pointing us in the direction of a dollar Index level which we last saw back in 2014 which is another 10% lower at an index level of 80. A 10% softer USD also means a 10% nominally higher crude oil price. The current [oil to dollar] feeding cycle can thus go upwards/downwards to $77/bl for Brent crude oil and to 80 for the dollar index unless OPEC & Co stops the oil rally or the ECB stops the euro appreciation and the dollar weakening.
Chart 1: US dollar and oil – The mirror image
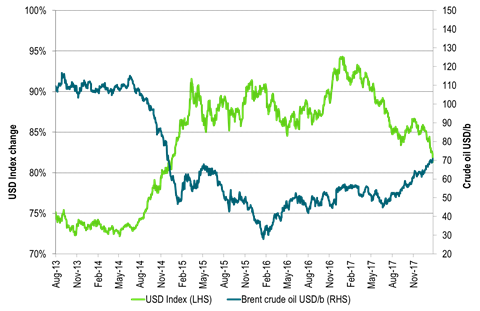
Chart 2: The market is tight as in 2013/14 shown by Brent spot versus Brent 1mth contract
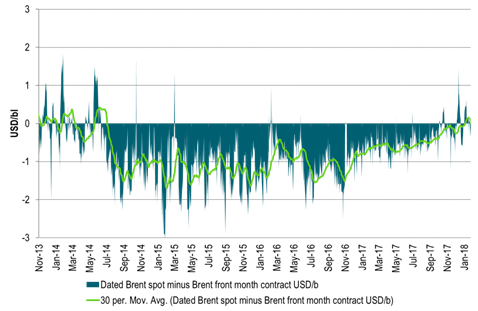
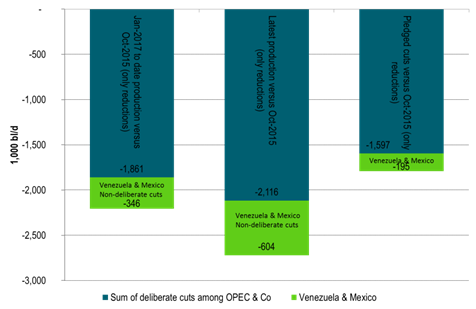
Chart 3: Deliberate OPEC & Co production cuts of 2.1 m bl/d
Sum of cuts not including gains by Libya, Nigeria etc
Kind regards
Bjarne Schieldrop
Chief analyst, Commodities
SEB Markets
Merchant Banking
Hesitant today. Brent jumped to an intraday high of $66.36/b yesterday after having touched an intraday low of $60.07/b on Monday as Indian and Chinese buyers cancelled some Russian oil purchases and instead redirected their purchases towards the Middle East due to the news US sanctions. Brent is falling back 0.4% this morning to $65.8/b.

It’s our strong view that the only sensible thing is to sell this rally. In all Trump’s unpredictability he has become increasingly predictable. Again and again he has rumbled about how he is going to be tough on Putin. Punish Putin if he won’t agree to peace in Ukraine. Recent rumbling was about the Tomahawk rockets which Trump threatened on 10 October and 12 October to sell/send to Ukraine. Then on 17 October he said that ”the U.S. didn’t want to give away weapons (Tomahawks) it needs”.
All of Trump’s threats towards Putin have been hot air. So far Trump’s threats have been all hot air and threats which later have evaporated after ”great talks with Putin”. After all these repetitions it is very hard to believe that this time will be any different. The new sanctions won’t take effect before 21. November. Trump has already said that: ”he was hoping that these new sanctions would be very short-lived in any case”. Come 21. November these new sanctions will either evaporate like all the other threats Trump has thrown at Putin before fading them. Or the sanctions will be postponed by another 4 weeks or 8 weeks with the appearance that Trump is even more angry with Putin. But so far Trump has done nothing that hurt Putin/Russia. We can’t imagine that this will be different. The only way forward in our view for a propre lasting peace in Ukraine is to turn Ukraine into defensive porcupine equipped with a stinging tail if need be.
China will likely stand up to Trump if new sanctions really materialize on 21 Nov. Just one country has really stood up to Trump in his tariff trade war this year: China. China has come of age and strength. I will no longer be bullied. Trump upped tariffs. China responded in kind. Trump cut China off from high-end computer chips. China put on the breaks on rare earth metals. China won’t be bullied any more and it has the power to stand up. Some Chinese state-owned companies like Sinopec have cancelled some of their Russian purchases. But China’s Foreign Ministry spokesperson Guo Jiakun has stated that China “oppose unilateral sanctions which lack a basis in international law and authorization of the UN Security Council”. Thus no one, not even the US shall unilaterally dictate China from whom they can buy oil or not. This is yet another opportunity for China to show its new strength and stand up to Trump in a show of force. Exactly how China choses to play this remains to be seen. But China won’t be bullied by over something as important as its oil purchases. So best guess here is that China will defy Trump on this. But probably China won’t need to make a bid deal over this. Firstly because these new sanctions will either evaporate as all the other threats or be postponed once we get to 21 November. Secondly because the sanctions are explicit towards US persons and companies but only ”may” be enforced versus non-US entities.
Sanctions is not a reduction in global supply of oil. Just some added layer of friction. Anyhow, the new sanctions won’t reduce the supply of Russian crude oil to the market. It will only increase the friction in the market with yet more need for the shadow fleet and ship to ship transfer of Russian oil to dodge the sanctions. If they materialize at all.
The jump in crude oil prices is probably due to redirections of crude purchases to the Mid-East and not because all speculators are now turned bullish. Has oil rallied because all speculators now suddenly have turned bullish? We don’t think so. Brent crude has probably jumped because some Indian and Chinese oil purchasers of have redirected their purchases from Russia towards the Mid-East just in case the sanctions really materializes on 21 November.
Parts of the Brent crude curve dipping into the high $50ies/b. Brent crude fell 2.3% over the week to Friday. It closed the week at $61.29/b, a slight gain on the day, but also traded to a low of $60.14/b that same day and just barely avoided trading into the $50ies/b. This morning it is risk-on in equities which seems to help industrial metals a little higher. But no such luck for oil. It is down 0.8% at $60.8/b. This week looks set for Brent crude to dip its feet in the $50ies/b. The Brent 3mth contract actually traded into the high $50ies/b on Friday.
The front-end backwardation has been on a weakening foot and is now about to fully disappear. The lowest point of the crude oil curve has also moved steadily lower and lower and its discount to the 5yr contract is now $6.8/b. A solid contango. The Brent 3mth contract did actually dip into the $50ies/b intraday on Friday when it traded to a low point of $59.93/b.
More weakness to come as lots of oil at sea comes to ports. Mid-East OPEC countries have boosted exports along with lower post summer consumption and higher production. The result is highly visibly in oil at sea which increased by 17 mb to 1,311 mb over the week to Sunday. Up 185 mb since mid-August. On its way to discharge at a port somewhere over the coming month or two.
Don’t forget that the oil market path ahead is all down to OPEC+. Remember that what is playing out in the oil market now is all by design by OPEC+. The group has decided that the unwind of the voluntary cuts is what it wants to do. In a combination of meeting demand from consumers as well as taking back market share. But we need to remember that how this plays out going forward is all at the mercy of what OPEC+ decides to do. It will halt the unwinding at some point. It will revert to cuts instead of unwind at some point.
A few months with Brent at $55/b and 40-50 US shale oil rigs kicked out may be what is needed. We think OPEC+ needs to see the exit of another 40-50 drilling rigs in the US shale oil patches to set US shale oil production on a path to of a 1 mb/d year on year decline Dec-25 to Dec-26. We are not there yet. But a 2-3 months period with Brent crude averaging $55/b would probably do it.
Oil on water increased 17 mb over the week to Sunday while oil in transit increased by 23 mb. So less oil was standing still. More was moving.

Crude oil floating storage (stationary more than 7 days). Down 11 mb over week to Sunday

The lowest point of the Brent crude oil curve versus the 5yr contract. Weakest so far this year.

Crude oil 1mth to 3mth time-spreads. Dubai held out strongly through summer, but then that center of strength fell apart in late September and has been leading weakness in crude curves lower since then.

Rebounding along with most markets. But concerns over solidity of Gaza peace may also contribute. Brent crude fell 0.8% yesterday to $61.91/b and its lowest close since May this year. This morning it is bouncing up 0.9% to $62.5/b along with a softer USD amid positive sentiment with both equities and industrial metals moving higher. Concerns that the peace in Gaza may be less solid than what one might hope for also yields some support to Brent. Bets on tech stocks are rebounding, defying fears of trade war. Money moving back into markets. Gold continues upwards its strong trend and a softer dollar helps it higher today as well.
US crude & products probably rose 5.6 mb last week (API) versus a normal seasonal decline of 2.4 mb. The US API last night partial and thus indicative data for US oil inventories. Their data indicates that US crude stocks rose 7.4 mb last week, gasoline stocks rose 3.0 mb while Distillate stocks fell 4.8 mb. Altogether an increase in commercial crude and product stocks of 5.6 mb. Commercial US crude and product stocks normally decline by 2.4 mb this time of year. So seasonally adjusted the US inventories rose 8 mb last week according to the indicative numbers by the API. That is a lot. Also, the counter seasonal trend of rising stocks versus normally declining stocks this time of year looks on a solid pace of continuation. If the API is correct then total US crude and product stocks would stand 41 mb higher than one year ago and 6 mb higher than the 2015-19 average. And if we combine this with our knowledge of a sharp increase in production and exports by OPEC(+) and a large increase in oil at sea, then the current trend in US oil inventories looks set to continue. So higher stocks and lower crude oil prices until OPEC(+) switch to cuts. Actual US oil inventory data today at 18:00 CET.
US commercial crude and product stocks rising to 1293 mb in week 41 if last nights indicative numbers from API are correct.

Crude oil soon coming to a port near you. OPEC has lifted production sharply higher this autumn. At the same time demand for oil in the Middle-East has fallen as we have moved out of summer heat and crude oil burn for power for air-conditioning. The Middle-East oil producers have thus been able to lift exports higher on both accounts. Crude oil and condensates on water has shot up by 177 mb since mid-August. This oil is now on its way to ports around the world. And when they arrive, it will likely help to lift stocks onshore higher. That is probably when we will lose the last bit of front-end backwardation the the crude oil curves. That will help to drive the front-month Brent crude oil price down to the $60/b line and revisit the high $50ies/b. Then the eyes will be all back on OPEC+ when they meet in early November and then again in early December.
Crude oil and condensates at sea have moved straight up by 177 mb since mid-August as OPEC(+) has produced more, consumed less and exported more.


Sell the rally. Trump has become predictable in his unpredictability

Gruvbolaget Boliden överträffade analytikernas förväntningar

Australien och USA investerar 8,5 miljarder USD för försörjningskedja av kritiska mineraler
Brent crude set to dip its feet into the high $50ies/b this week

Vad guldets uppgång egentligen betyder för världen

OPEC+ missar produktionsmål, stöder oljepriserna

Goldman Sachs höjer prognosen för guld, tror priset når 4900 USD

Blykalla och amerikanska Oklo inleder ett samarbete

Guld nära 4000 USD och silver 50 USD, därför kan de fortsätta stiga

Leading Edge Materials är på rätt plats i rätt tid
-
 Nyheter4 veckor sedan
OPEC+ missar produktionsmål, stöder oljepriserna
-
 Nyheter3 veckor sedan
Goldman Sachs höjer prognosen för guld, tror priset når 4900 USD
-
 Nyheter3 veckor sedan
Blykalla och amerikanska Oklo inleder ett samarbete
-
 Nyheter3 veckor sedan
Guld nära 4000 USD och silver 50 USD, därför kan de fortsätta stiga
-
 Nyheter2 veckor sedan
Leading Edge Materials är på rätt plats i rätt tid
-

 Nyheter3 veckor sedan
Nytt prisrekord, guld stiger över 4000 USD
-

 Nyheter3 veckor sedan
Ett samtal om guld, olja, koppar och stål
-
Analys3 veckor sedan
OPEC+ will likely unwind 500 kb/d of voluntary quotas in October. But a full unwind of 1.5 mb/d in one go could be in the cards