

Analys
Market consensus is forming. Brent crude centering in on $55/b

 A market consensus is forming with Brent crude centering in on $55/b. Caught between the OPEC put at $50/b US shale oil likely to expand strongly above $60/b
Price action – Could not find more room on the downside
 After closing close to the intraday low on Wednesday at $53.92/b it did not take much for the oil price to close up 0.4% yesterday at $54.16/b. It traded fairly stable through the day but after some early gains it fell back again following rising US oil inventories and declining US refining utilization.
Crude oil comment – Market consensus is forming. Brent crude centering in on $55/b
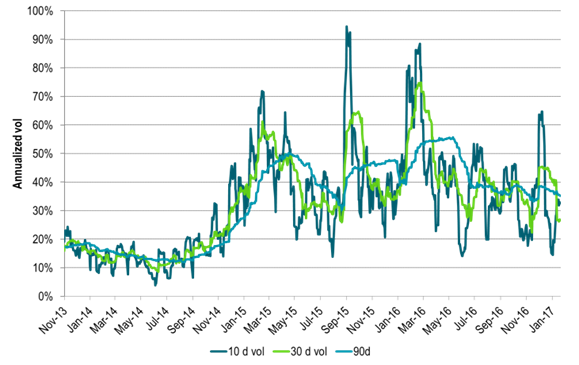
A market hypothesis is starting to form being that the “OPEC put” is placing a floor price for Brent crude at $50/b while US shale oil is placing a cap on the upside at $60/b as that would strongly accelerate US shale oil production. Last year prices were swinging wildly as strongly convicted bulls as well as bears were tugging the oil price in opposite directions. Substantial uncertainties regarding the actual supply/demand balance last year also added force to the price swings. Realized, daily, annualized volatility came in at 44% versus a historically more normal 30%. As a new consensus is starting to form, the fog around the oil market balance is starting to clear and the oil price is likely going to start to stabilize.
Last year there were definitely huge doubts about to what degree the US shale players were hurt and weakened by the downturn. Would they be able to respond to higher prices or would they just slowly limp along with little response despite higher prices? Few placed much faith in any OPEC action as production from that side mostly was rising strongly. Now however the uncertainty around both of these factors has cleared to a large degree. US shale oil producers look close to live and kicking. They added 180 rigs in H2-16 in response to a US shale oil relevant WTI forward curve price averaging $52/b in H2-16. Price action is responding to this and we see the Brent crude oil prices have been rejected to the upside at $57-58/b and supported to the downside around $54/b. There are of course still a lot of wet dreams out there about much higher prices ahead, but for now a market consensus seems to be forming around these two supply forces: OPEC cuts at $50/b versus US shale supply boost at $60/b.
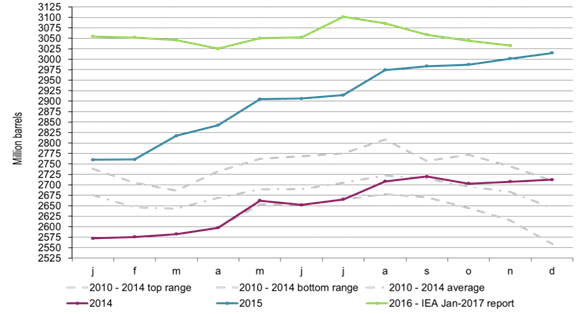
The IEA yesterday released its monthly oil market report. Notable again was that OECD inventories was heading down for the fourth month in a row. From December 2015 to November 2016 they were up by only 17.5 mb versus a normal seasonal gain over the same period of about 39 mb. Thus over the last year the OECD commercial inventories actually declined 21.5 mb versus normal for that period. This is really the proof of the pudding: Inventories did not rise last year, thus the oil market was in balance. We have several times before commented that the IEA had an inconsistency when they reported sideways inventories while at the same time putting forward an estimated surplus of 0.7 mb/d (256 mb) for the year. And sure enough, yesterday they adjusted down their estimated surplus from 0.7 mb/d to 0.5 mb/d. We think they still have this estimate too high and that in the coming months or year they will adjust it down to about 0.2 mb/d. That is at least our estimate.
Today at 19:00 CET we have the US rig count by Baker Hughes. For the two weeks of the year there has only been added 1 new shale oil rig versus a weekly average of 6.1 rigs/week in H2-16 and versus our expectations for 7 additional shale oil rigs per week in H1-17 in response to a shale oil relevant forward curve WTI price which now stands at $55/b versus $52/b in H2-16.
Ch1: OECD commercial oil inventories – There was no surplus in 2016
Ch2: Brent crude front month volatility declining
Will decline further as market normalizes and price consensus forms
Down to the lowest since early May. Brent crude has fallen sharply the latest four days. It closed at USD 64.11/b yesterday which is the lowest since early May. It is staging a 1.3% rebound this morning along with gains in both equities and industrial metals with an added touch of support from a softer USD on top.

What stands out the most to us this week is the collapse in the Dubai one to three months time-spread.
Dubai is medium sour crude. OPEC+ is in general medium sour crude production. Asian refineries are predominantly designed to process medium sour crude. So Dubai is the real measure of the balance between OPEC+ holding back or not versus Asian oil demand for consumption and stock building.
A sharp weakening of the front-end of the Dubai curve. The front-end of the Dubai crude curve has been holding out very solidly throughout this summer while the front-end of the Brent and WTI curves have been steadily softening. But the strength in the Dubai curve in our view was carrying the crude oil market in general. A source of strength in the crude oil market. The core of the strength.
The now finally sharp decline of the front-end of the Dubai crude curve is thus a strong shift. Weakness in the Dubai crude marker is weakness in the core of the oil market. The core which has helped to hold the oil market elevated.
Facts supports the weakening. Add in facts of Iraq lifting production from Kurdistan through Turkey. Saudi Arabia lifting production to 10 mb/d in September (normal production level) and lifting exports as well as domestic demand for oil for power for air con is fading along with summer heat. Add also in counter seasonal rise in US crude and product stocks last week. US oil stocks usually decline by 1.3 mb/week this time of year. Last week they instead rose 6.4 mb/week (+7.2 mb if including SPR). Total US commercial oil stocks are now only 2.1 mb below the 2015-19 seasonal average. US oil stocks normally decline from now to Christmas. If they instead continue to rise, then it will be strongly counter seasonal rise and will create a very strong bearish pressure on oil prices.
Will OPEC+ lift its voluntary quotas by zero, 137 kb/d, 500 kb/d or 1.5 mb/d? On Sunday of course OPEC+ will decide on how much to unwind of the remaining 1.5 mb/d of voluntary quotas for November. Will it be 137 kb/d yet again as for October? Will it be 500 kb/d as was talked about earlier this week? Or will it be a full unwind in one go of 1.5 mb/d? We think most likely now it will be at least 500 kb/d and possibly a full unwind. We discussed this in a not earlier this week: ”500 kb/d of voluntary quotas in October. But a full unwind of 1.5 mb/d”
The strength in the front-end of the Dubai curve held out through summer while Brent and WTI curve structures weakened steadily. That core strength helped to keep flat crude oil prices elevated close to the 70-line. Now also the Dubai curve has given in.

Brent crude oil forward curves

Total US commercial stocks now close to normal. Counter seasonal rise last week. Rest of year?

Total US crude and product stocks on a steady trend higher.

Analys
OPEC+ will likely unwind 500 kb/d of voluntary quotas in October. But a full unwind of 1.5 mb/d in one go could be in the cards
Down to mid-60ies as Iraq lifts production while Saudi may be tired of voluntary cut frugality. The Brent December contract dropped 1.6% yesterday to USD 66.03/b. This morning it is down another 0.3% to USD 65.8/b. The drop in the price came on the back of the combined news that Iraq has resumed 190 kb/d of production in Kurdistan with exports through Turkey while OPEC+ delegates send signals that the group will unwind the remaining 1.65 mb/d (less the 137 kb/d in October) of voluntary cuts at a pace of 500 kb/d per month pace.
Signals of accelerated unwind and Iraqi increase may be connected. Russia, Kazakhstan and Iraq were main offenders versus the voluntary quotas they had agreed to follow. Russia had a production ’debt’ (cumulative overproduction versus quota) of close to 90 mb in March this year while Kazakhstan had a ’debt’ of about 60 mb and the same for Iraq. This apparently made Saudi Arabia angry this spring. Why should Saudi Arabia hold back if the other voluntary cutters were just freeriding? Thus the sudden rapid unwinding of voluntary cuts. That is at least one angle of explanations for the accelerated unwinding.
If the offenders with production debts then refrained from lifting production as the voluntary cuts were rapidly unwinded, then they could ’pay back’ their ’debts’ as they would under-produce versus the new and steadily higher quotas.
Forget about Kazakhstan. Its production was just too far above the quotas with no hope that the country would hold back production due to cross-ownership of oil assets by international oil companies. But Russia and Iraq should be able to do it.
Iraqi cumulative overproduction versus quotas could reach 85-90 mb in October. Iraq has however steadily continued to overproduce by 3-5 mb per month. In July its new and gradually higher quota came close to equal with a cumulative overproduction of only 0.6 mb that month. In August again however its production had an overshoot of 100 kb/d or 3.1 mb for the month. Its cumulative production debt had then risen to close to 80 mb. We don’t know for September yet. But looking at October we now know that its production will likely average close to 4.5 mb/d due to the revival of 190 kb/d of production in Kurdistan. Its quota however will only be 4.24 mb/d. Its overproduction in October will thus likely be around 250 kb/d above its quota with its production debt rising another 7-8 mb to a total of close to 90 mb.
Again, why should Saudi Arabia be frugal while Iraq is freeriding. Better to get rid of the voluntary quotas as quickly as possible and then start all over with clean sheets.
Unwinding the remaining 1.513 mb/d in one go in October? If OPEC+ unwinds the remaining 1.513 mb/d of voluntary cuts in one big go in October, then Iraq’s quota will be around 4.4 mb/d for October versus its likely production of close to 4.5 mb/d for the coming month..
OPEC+ should thus unwind the remaining 1.513 mb/d (1.65 – 0.137 mb/d) in one go for October in order for the quota of Iraq to be able to keep track with Iraq’s actual production increase.
October 5 will show how it plays out. But a quota unwind of at least 500 kb/d for Oct seems likely. An overall increase of at least 500 kb/d in the voluntary quota for October looks likely. But it could be the whole 1.513 mb/d in one go. If the increase in the quota is ’only’ 500 kb/d then Iraqi cumulative production will still rise by 5.7 mb to a total of 85 mb in October.
Iraqi production debt versus quotas will likely rise by 5.7 mb in October if OPEC+ only lifts the overall quota by 500 kb/d in October. Here assuming historical production debt did not rise in September. That Iraq lifts its production by 190 kb/d in October to 4.47 mb/d (August level + 190 kb/d) and that OPEC+ unwinds 500 kb/d of the remining quotas in October when they decide on this on 5 October.

U.S. commercial crude inventories posted a marginal draw last week, falling by 0.6 million barrels to 414.8 million barrels. Inventories remain 4% below the five-year seasonal average, but the draw is far smaller than last week’s massive 9.3-million-barrel decline. Higher crude imports (+803,000 bl d WoW) and steady refinery runs (93% utilization) helped keep the crude balance relatively neutral.

Yet another drawdown indicates commercial crude inventories continue to trend below the 2015–2022 seasonal norm (~440 million barrels), though at 414.8 million barrels, levels are now almost exactly in line with both the 2023 and 2024 trajectory, suggesting stable YoY conditions (see page 3 attached).
Gasoline inventories dropped by 1.1 million barrels and are now 2% below the five-year average. The decline was broad-based, with both finished gasoline and blending components falling, indicating lower output and resilient end-user demand as we enter the shoulder season post-summer (see page 6 attached).
On the diesel side, distillate inventories declined by 1.7 million barrels, snapping a two-week streak of strong builds. At 125 million barrels, diesel inventories are once again 8% below the five-year average and trending near the low end of the historical range.
In total, commercial petroleum inventories (excl. SPR) slipped by 0.5 million barrels on the week to ish 1,281.5 million barrels. While essentially flat, this ends a two-week streak of meaningful builds, reflecting a return to a slightly tighter situation.
On the demand side, the DOE’s ‘products supplied’ metric (see page 6 attached), a proxy for implied consumption, softened slightly. Total demand for crude oil over the past four weeks averaged 20.5 million barrels per day, up just 0.9% YoY.
Summing up: This week’s report shows a re-tightening in diesel supply and modest draws across the board, while demand growth is beginning to flatten. Inventories remain structurally low, but the tone is less bullish than in recent weeks.


A sharp weakening at the core of the oil market: The Dubai curve

Guld nära 4000 USD och silver 50 USD, därför kan de fortsätta stiga
OPEC+ will likely unwind 500 kb/d of voluntary quotas in October. But a full unwind of 1.5 mb/d in one go could be in the cards

Blykalla och amerikanska Oklo inleder ett samarbete

Fortsatt stabilt elpris – men dubbelt så dyrt som i fjol

Mahvie Minerals i en guldtrend

Guldpriset kan närma sig 5000 USD om centralbankens oberoende skadas

OPEC signalerar att de inte bryr sig om oljepriset faller kommande månader
Volatile but going nowhere. Brent crude circles USD 66 as market weighs surplus vs risk

Aktier i guldbolag laggar priset på guld
-
 Nyheter3 veckor sedan
Mahvie Minerals i en guldtrend
-
 Nyheter4 veckor sedan
Guldpriset kan närma sig 5000 USD om centralbankens oberoende skadas
-
 Nyheter4 veckor sedan
OPEC signalerar att de inte bryr sig om oljepriset faller kommande månader
-
Analys3 veckor sedan
Volatile but going nowhere. Brent crude circles USD 66 as market weighs surplus vs risk
-
 Nyheter3 veckor sedan
Aktier i guldbolag laggar priset på guld
-

 Nyheter3 veckor sedan
Kinas elproduktion slog nytt rekord i augusti, vilket även kolkraft gjorde
-
 Nyheter3 veckor sedan
Tyskland har så höga elpriser att företag inte har råd att använda elektricitet
-

 Nyheter3 veckor sedan
Guld når sin högsta nivå någonsin, nu även justerat för inflation