

Analys
It’s artificial, but is still real and prices will tick higher

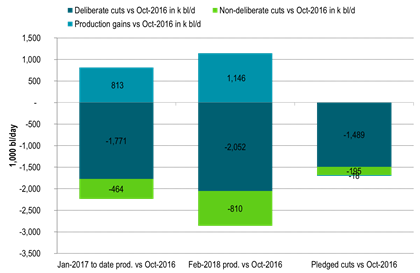
 Donald’s tweet on Friday that the OPEC cartel is keeping oil prices artificially high sent Brent crude down to an intraday low of $72.88/bl. The market later in the day totally disregarded the tweet sending Brent to its highest close of the week at $74.06/bl, up $0.4/bl on the day, +2% w/w and the highest close since November 2014. Of course Donald is totally right. The market is artificially tight because the OPEC+ cartel has deliberately cut production. In total its production is down 1.7 m bl/d versus Oct 2016. In our view there were deliberate cuts of 2,052 k bl/d in February if we cut out involuntary cuts of 810 k bl/d and production gains of 1,146 k bl/d. Of course Donald is right that it is the OPEC+ cartel which is driving the market. Tell us something new! That has been the case since their decision in October 2016. Of course the cartel has been lucky since their strategy has been supported by synchronised global growth and very strong oil demand growth as well as production in Venezuela falling like a rock. If it had not been for the very strong global oil demand growth their strategy would probably have been very close to failure since US crude oil production is reviving so strongly. In our estimate they will not be able to exit their cuts in 2019 without driving global inventories back up again. That is why an extension of their agreement to 2019 is on the agenda for the meeting in Vienna on June 20/21/22. So the market is artificially tight but it is the oil market reality of today. They are cutting, oil demand is strong, inventories are going down and prices are moving higher. The OPEC+ cartel will in our view be in control of the market in 2019 unless we have a global recession. They can put some of their cuts back into the market, but not all. Any involuntary production cuts by Venezuela, Libya, Mexico or possibly Iran will of course be welcomed by the deliberate cutters in the group.

Bjarne Schieldrop, Chief analyst commodities
If it had not been for cuts by the OPEC+ cartel since January 2017 we would probably have had an oil price still somewhere around $50-55/b
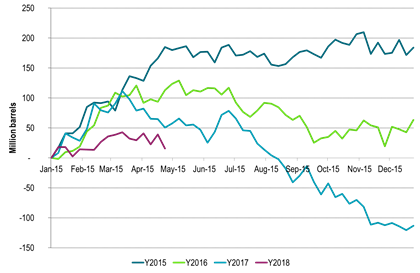
Since a 2017 high of 3059.7 in May 2017 the commercial OECD oil inventories have declined 218 million barrels which equals a 0.8 m bl/d daily draw down on average through the period. On average through that period the production of OPEC+ has been 1.4 m bl/d below its October 2016 production level in a mix of deliberate cuts, gains and involuntary cuts. Since the world is bigger than the OECD inventories there has probably been some inventory draws in non-OECD stocks as well. So while the OECD drawdown implied global deficit since May 2017 is 0.8 m bl/d the actual deficit may have been higher, but probably not higher than the net effective cuts of OPEC+ of 1.4 m bl/d over the same period. So yes, our view sides with Donald Trump that if it had not been for cuts by the OPEC+ cartel since January 2017 we would probably have had an oil price still somewhere around $50-55/b or even maybe sub-$50/bl.
There have however hardly been any negative responses to the OPEC+ cartel’s actions up until now on Friday with the tweet by Donald Trump. Not even Donald has acted before now even though production cuts have been going on since the start of 2017. Mostly the action by the cartel has been viewed positively across the board. I cannot remember to have seen any negative takes on it before now. Mostly the take has been that OPEC+ has been doing the world a favour.
OPEC+ has driven the global oil sector out of its investment hysteresis and out of its deep, dark abyss of despair and back into action
Through its cuts, inventory draws and higher prices OPEC+ has driven the global oil sector out of its investment hysteresis and out of its deep, dark abyss of despair and back into action. That is probably a good thing since it will help to reduce the risk for a significant undershoot in supply down the road due to the deep investment cuts in new conventional supply since 2014. And the jury is still out whether we will be able to dodge that bullet when the pipeline of legacy green field conventional oil investments from before 2014 starts to run dry in 2020. Our view is that there is clearly upside price risk due to this on this time horizon.
For the time being we remain bullish for Brent crude oil prices as OPEC+ cuts are intact, their agreement will and must be extended to 2019 at their June 20/21/22 in order to avoid raising inventories in 2019. For the rest of 2018 we expect inventories do draw lower with added supply risk due to Venezuela, Libya and possibly Iran.
If Donald wants to do something he can sign the sanction waivers on May 12 in order to safeguard Iranian crude oil supply. Else his dear voters and consumers are likely to face higher gasoline prices this summer.
Ch1: OPEC+ deliberate cuts, involuntary cuts and gains
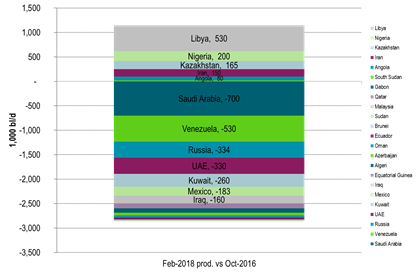
Ch2: OPEC+showing who are doing what versus October 2018
C3: Crude and product weekly inventory data versus start of year. Heading lower. Down 23 m bl last week
Rebounding along with most markets. But concerns over solidity of Gaza peace may also contribute. Brent crude fell 0.8% yesterday to $61.91/b and its lowest close since May this year. This morning it is bouncing up 0.9% to $62.5/b along with a softer USD amid positive sentiment with both equities and industrial metals moving higher. Concerns that the peace in Gaza may be less solid than what one might hope for also yields some support to Brent. Bets on tech stocks are rebounding, defying fears of trade war. Money moving back into markets. Gold continues upwards its strong trend and a softer dollar helps it higher today as well.

US crude & products probably rose 5.6 mb last week (API) versus a normal seasonal decline of 2.4 mb. The US API last night partial and thus indicative data for US oil inventories. Their data indicates that US crude stocks rose 7.4 mb last week, gasoline stocks rose 3.0 mb while Distillate stocks fell 4.8 mb. Altogether an increase in commercial crude and product stocks of 5.6 mb. Commercial US crude and product stocks normally decline by 2.4 mb this time of year. So seasonally adjusted the US inventories rose 8 mb last week according to the indicative numbers by the API. That is a lot. Also, the counter seasonal trend of rising stocks versus normally declining stocks this time of year looks on a solid pace of continuation. If the API is correct then total US crude and product stocks would stand 41 mb higher than one year ago and 6 mb higher than the 2015-19 average. And if we combine this with our knowledge of a sharp increase in production and exports by OPEC(+) and a large increase in oil at sea, then the current trend in US oil inventories looks set to continue. So higher stocks and lower crude oil prices until OPEC(+) switch to cuts. Actual US oil inventory data today at 18:00 CET.
US commercial crude and product stocks rising to 1293 mb in week 41 if last nights indicative numbers from API are correct.

Crude oil soon coming to a port near you. OPEC has lifted production sharply higher this autumn. At the same time demand for oil in the Middle-East has fallen as we have moved out of summer heat and crude oil burn for power for air-conditioning. The Middle-East oil producers have thus been able to lift exports higher on both accounts. Crude oil and condensates on water has shot up by 177 mb since mid-August. This oil is now on its way to ports around the world. And when they arrive, it will likely help to lift stocks onshore higher. That is probably when we will lose the last bit of front-end backwardation the the crude oil curves. That will help to drive the front-month Brent crude oil price down to the $60/b line and revisit the high $50ies/b. Then the eyes will be all back on OPEC+ when they meet in early November and then again in early December.
Crude oil and condensates at sea have moved straight up by 177 mb since mid-August as OPEC(+) has produced more, consumed less and exported more.

When it starts to move lower it moves rather quickly. Gaza, China, IEA. Brent crude is down 2.1% today to $62/b after having traded as high as $66.58/b last Thursday and above $70/b in late September. The sell-off follows the truce/peace in Gaze, a flareup in US-China trade and yet another bearish oil outlook from the IEA.
A lasting peace in Gaze could drive crude oil at sea to onshore stocks. A lasting peace in Gaza would probably calm down the Houthis and thus allow more normal shipments of crude oil to sail through the Suez Canal, the Red Sea and out through the Bab-el-Mandeb Strait. Crude oil at sea has risen from 48 mb in April to now 91 mb versus a pre-Covid normal of about 50-60 mb. The rise to 91 mb is probably the result of crude sailing around Africa to be shot to pieces by the Houthis. If sailings were to normalize through the Suez Canal, then it could free up some 40 mb in transit at sea moving onshore into stocks.
The US-China trade conflict is of course bearish for demand if it continues.
Bearish IEA yet again. Getting closer to 2026. Credibility rises. We expect OPEC to cut end of 2025. The bearish monthly report from the IEA is what it is, but the closer we get to 2026, the more likely the IEA is of being ball-park right in its outlook. In its monthly report today the IEA estimates that the need for crude oil from OPEC in 2026 will be 25.4 mb/d versus production by the group in September of 29.1 mb/d. The group thus needs to do some serious cutting at the end of 2025 if it wants to keep the market balanced and avoid inventories from skyrocketing. Given that IEA is correct that is. We do however expect OPEC to implement cuts to avoid a large increase in inventories in Q1-26. The group will probably revert to cuts either at its early December meeting when they discuss production for January or in early January when they discuss production for February. The oil price will likely head yet lower until the group reverts to cuts.
Dubai: The Mid-East anchor dragging crude oil lower. Surplus emerging in Mid-East pricing. Crude oil prices held surprisingly strong all through the summer. A sign and a key source of that strength came from the strength in the front-end backwardation of the Dubai crude oil curve. It held out strong from mid-June and all until late September with an average 1-3mth time-spread premium of $1.8/b from mid-June to end of September. The 1-3mth time-spreads for Brent and WTI however were in steady deterioration from late June while their flat prices probably were held up by the strength coming from the Persian Gulf. Then in late September the strength in the Dubai curve suddenly collapsed. Since the start of October it has been weaker than both the Brent and the WTI curves. The Dubai 1-3mth time-spread now only stands at $0.25/b. The Middle East is now exporting more as it is producing more and also consuming less following elevated summer crude burn for power (Aircon) etc.
The only bear-element missing is a sudden and solid rise in OECD stocks. The only thing that is missing for the bear-case everyone have been waiting for is a solid, visible rise in OECD stocks in general and US oil stocks specifically. So watch out for US API indications tomorrow and official US oil inventories on Thursday.
No sign of any kind of fire-sale of oil from Saudi Arabia yet. To what we can see, Saudi Arabia is not at all struggling to sell its oil. It only lowered its Official Selling Prices (OSPs) to Asia marginally for November. A surplus market + Saudi determination to sell its oil to the market would normally lead to a sharp lowering of Saudi OSPs to Asia. Not yet at least and not for November.
The 5yr contract close to fixed at $68/b. Of importance with respect to how far down oil can/will go. When the oil market moves into a surplus then the spot price starts to trade in a large discount to the 5yr contract. Typically $10-15/b below the 5yr contract on average in bear-years (2009, 2015, 2016, 2020). But the 5yr contract is usually pulled lower as well thus making this approach a moving target. But the 5yr contract price has now been rock solidly been pegged to $68/b since 2022. And in the 2022 bull-year (Brent spot average $99/b), the 5yr contract only went to $72/b on average. If we assume that the same goes for the downside and that 2026 is a bear-year then the 5yr goes to $64/b while the spot is trading at a $10-15/b discount to that. That would imply an average spot price next year of $49-54/b. But that is if OPEC doesn’t revert to cuts and instead keeps production flowing. We think OPEC(+) will trim/cut production as needed into 2026 to prevent a huge build-up in global oil stocks and a crash in prices. But for now we are still heading lower. Into the $50ies/b.
Some rebound but not much. Brent crude rebounded 1.5% yesterday to $65.47/b. This morning it is inching 0.2% up to $65.6/b. The lowest close last week was on Thursday at $64.11/b.
The curve structure is almost as week as it was before the weekend. The rebound we now have gotten post the message from OPEC+ over the weekend is to a large degree a rebound along the curve rather than much strengthening at the front-end of the curve. That part of the curve structure is almost as weak as it was last Thursday.
We are still on a weakening path. The message from OPEC+ over the weekend was we are still on a weakening path with rising supply from the group. It is just not as rapidly weakening as was feared ahead of the weekend when a quota hike of 500 kb/d/mth for November was discussed.
The Brent curve is on its way to full contango with Brent dipping into the $50ies/b. Thus the ongoing weakening we have had in the crude curve since the start of the year, and especially since early June, will continue until the Brent crude oil forward curve is in full contango along with visibly rising US and OECD oil inventories. The front-month Brent contract will then flip down towards the $60/b-line and below into the $50ies/b.
At what point will OPEC+ turn to cuts? The big question then becomes: When will OPEC+ turn around to make some cuts? At what (price) point will they choose to stabilize the market? Because for sure they will. Higher oil inventories, some more shedding of drilling rigs in US shale and Brent into the 50ies somewhere is probably where the group will step in.
There is nothing we have seen from the group so far which indicates that they will close their eyes, let the world drown in oil and the oil price crash to $40/b or below.
The message from OPEC+ is also about balance and stability. The world won’t drown in oil in 2026. The message from the group as far as we manage to interpret it is twofold: 1) Taking back market share which requires a lower price for non-OPEC+ to back off a bit, and 2) Oil market stability and balance. It is not just about 1. Thus fretting about how we are all going to drown in oil in 2026 is totally off the mark by just focusing on point 1.
When to buy cal 2026? Before Christmas when Brent hits $55/b and before OPEC+ holds its last meeting of the year which is likely to be in early December.
Brent crude oil prices have rebounded a bit along the forward curve. Not much strengthening in the structure of the curve. The front-end backwardation is not much stronger today than on its weakest level so far this year which was on Thursday last week.

The front-end backwardation fell to its weakest level so far this year on Thursday last week. A slight pickup yesterday and today, but still very close to the weakest year to date. More oil from OPEC+ in the coming months and softer demand and rising inventories. We are heading for yet softer levels.


Vad guldets uppgång egentligen betyder för världen

Spotpriset på guld över 4300 USD och silver över 54 USD
Crude oil soon coming to a port near you

Guld och silver stiger hela tiden mot nya höjder
The Mid-East anchor dragging crude oil lower

OPEC+ missar produktionsmål, stöder oljepriserna

Ett samtal om guld, olja, fjärrvärme och förnybar energi
Guld nära 4000 USD och silver 50 USD, därför kan de fortsätta stiga

Goldman Sachs höjer prognosen för guld, tror priset når 4900 USD
Are Ukraine’s attacks on Russian energy infrastructure working?
-
 Nyheter3 veckor sedan
OPEC+ missar produktionsmål, stöder oljepriserna
-
 Nyheter3 veckor sedan
Ett samtal om guld, olja, fjärrvärme och förnybar energi
-
 Nyheter2 veckor sedan
Guld nära 4000 USD och silver 50 USD, därför kan de fortsätta stiga
-
 Nyheter1 vecka sedan
Goldman Sachs höjer prognosen för guld, tror priset når 4900 USD
-
Analys3 veckor sedan
Are Ukraine’s attacks on Russian energy infrastructure working?
-

 Nyheter2 veckor sedan
Blykalla och amerikanska Oklo inleder ett samarbete
-

 Nyheter4 veckor sedan
Guldpriset uppe på nya höjder, nu 3750 USD
-
Nyheter2 veckor sedan
Ett samtal om guld, olja, koppar och stål