

Analys
Iranian nuclear negotiations at center stage


Brent crude is trading like it is April with snow one day and sunshine the next. We currently have spring refinery maintenance with reduced processing of crude by refineries and rising crude stocks. The strength of the crude curve is weakening, floating crude stocks are rising, speculative positions in crude are taking some exit and Brent crude prices have been ticking lower. Gasoline refinery margins are however extremely strong and oil product demand is set to revive yet more in the months to come. Over the market however hangs a dark shadow of Iran nuclear negotiations in Vienna which if successful would add more crude to the market.

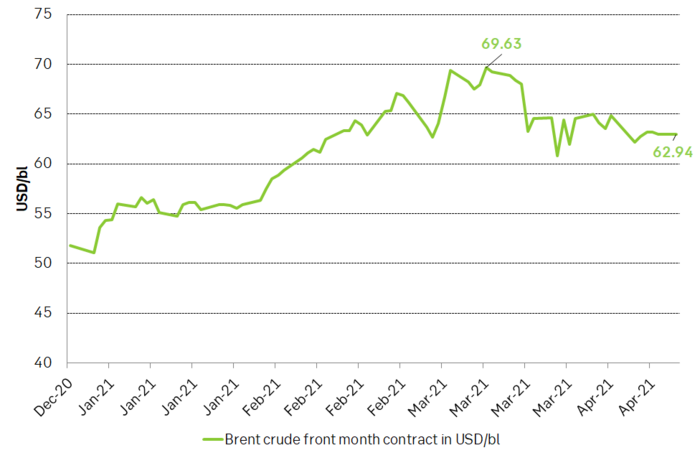
Brent crude traded down 2.9% last week with a close of USD 62.95/bl and is trading down another 0.5% this morning to USD 62.6/bl. Since 19 March Brent crude has averaged USD 63.4/bl. While currently not far from this average but in general it is clear that prices have been ticking lower since late March and still are.
Center stage in the oil market these days is the ongoing negotiations in Vienna where world powers are trying to revive the Iranian Nuclear deal (JCPOA) which Biden helped to create when he was Vice President under Obama. There is a lot of noise around the ongoing negotiations with a lot of crossing interests. Israel and Saudi Arabia probably both want Iran to be in constant lock-down rather than to revive. And the Iranian Revolutionary Gard might also want to see a continued status quo rather than a normalization and a reopening of the country as this might threaten its current grip on power. But fundamentally all parties in the negotiations in Vienna wants to see the JCPOA deal revived and reinstated. Thus, fundamentally the outcome should be successful in the end. When is of course a large open question with most observers predict a lengthy and difficult process with revival of Iranian production in late 2021 or into 2022. President Rouhani of Iran is however set to end his presidency in June this year with expectations that Iran’ hard-liners will take over which would make it more difficult to succeed. Thus, the window of opportunity might be quite narrow. And President Biden seems to want to undo all of Donald Trump’s deeds as quickly as possible. So sooner rather than later could be the outcome of the Vienna negotiations. But sitting far from Vienna this is hard to tell. But what is clear is that the ongoing Iranian nuclear negotiations in Vienna is posing a bearish risk for oil.
On the physical part of the crude oil market it is obvious that there is currently not a continued strong draw-down in crude stocks as we have seen previously, and which has underpinned the previously increasing Brent crude oil backwardation.
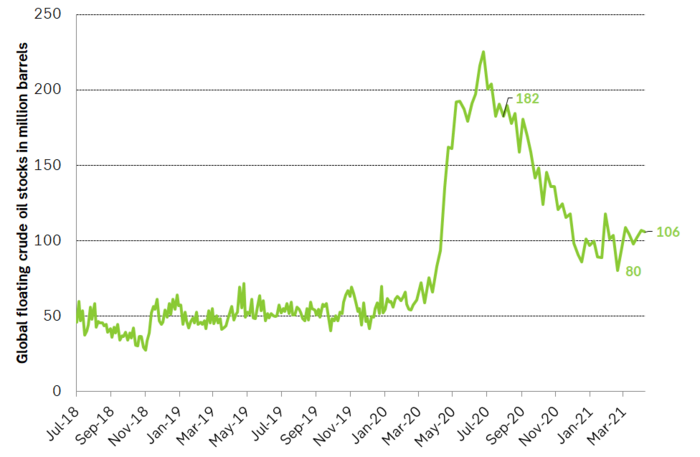
Refineries are currently in spring maintenance; Chinese crude stocks are reportedly very high and April/May refinery maintenance there is unusually strong this year as well. OPEC ME Gulf loadings rose 1.6 m bl/d month on month in March and OPEC+ production is set to rise further in May, June and July. Floating crude oil stocks have as a result of all this been ticking higher from a low of 80 m bl in February to now 106 m bl versus a normal of 50-60 m bl.
Parts of the weakness right now is clearly the refinery turnaround season in combination with further production increases lined up by OPEC+ in the months ahead (600, 700, 841 k bl/d for May, June, July).
But all is not grim, and the current crude oil weakness is clearly exacerbated by the ongoing refinery maintenance season.
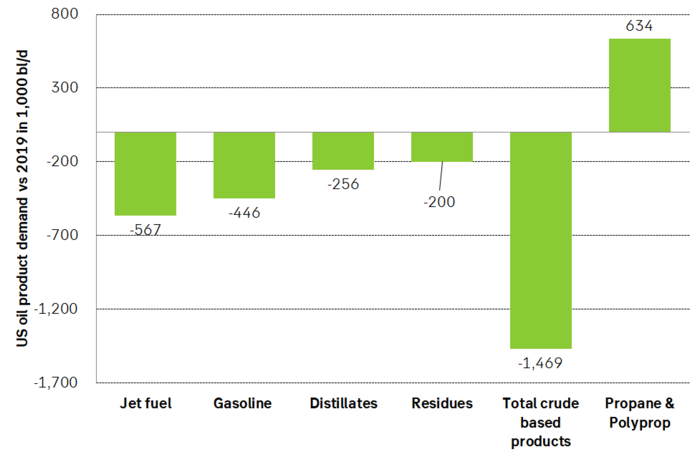
If we instead look at the oil products, we see that US crude based products are only 1.5 m bl/d below the 2019 level. And US oil demand is set to revive more. Gasoline is being shipped from east of Suez to West Africa at the highest rate since 2016 and diesel is being shipped from Europe to the US in an unusual reverse flow.
So amid all the noise of Iran JCPOA negotiations, crude oil weakness, refinery maintenance it is easy to forget the broad, underlying fundamental here that vaccines are increasingly rolled out and product demand is on its way back in the US and a little later in the EU.
Brent crude oil prices have fallen back. Ticking lower since the recent fall from USD 69.63/bl. From recent high-close to to recent low-closes we have still spanned less than USD 10/bl. Normal pull-backs during price recoveries are typically USD 10-12/bl. Thus the pull-back is still not all that big.
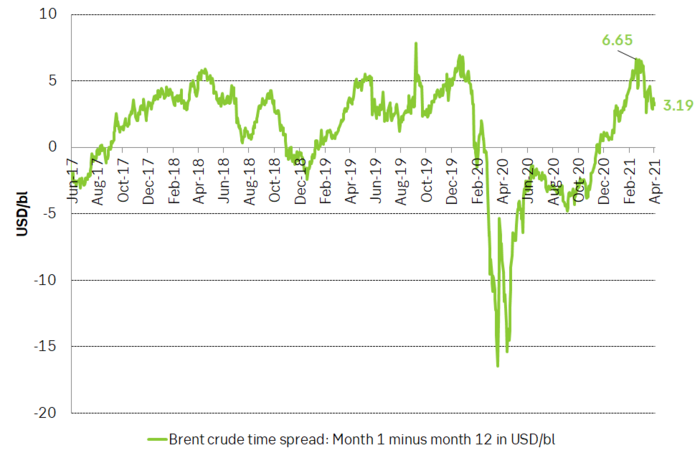
Backwardation of the Brent crude oil curve has consistently softened since late February when the front month contract traded at a premium of USD 6.6/bl vs the 12 months contract. It now trades at only USD 3.1/bl. In comparison this backwardation averaged USD 2.9/bl through 2018 and 2019. Thus, current backwardation is very normal though it is clearly on a weakening trend right now.
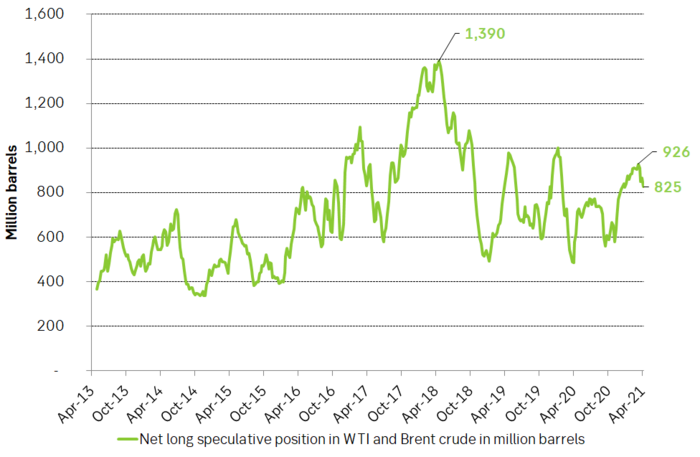
Net long speculative positions in Brent and WTI has declined about 100 m bl from 926 m bl in early March to now 825 m bl. In comparison the average position in 2019 was 733 m bl. Speculative positions are thus still some 100 m bl above this level and could draw down to below 600 m bl if speculators take more exits.
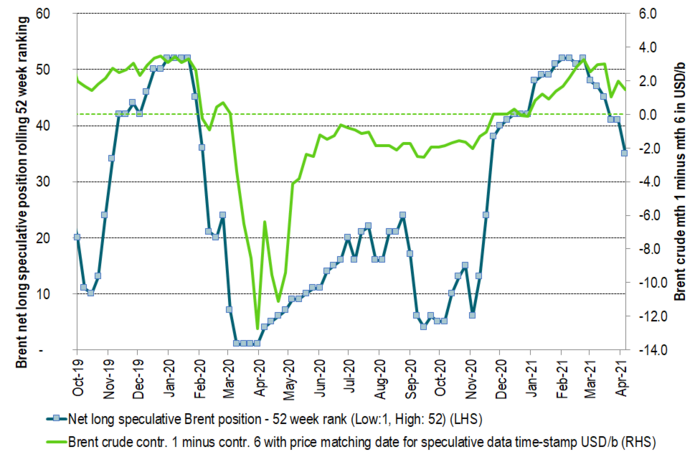
The time-spread of the Brent crude oil curve given as month 1 minus month 6 versus the ranking of net long speculative positions in Brent crude. The backwardation/contango of the Brent crude oil curve is not solely a reflection of the physical market. It is also a reflection of ebbs and flows of speculative positions. As these moves in and out of the front-end of the front-end contracts of the crude curve they typically drag front-end prices higher or lower versus longer dated contracts. Further speculative exits would weaken the Brent crude backwardation yet more (flatten the curve) with the front-end contract then moving closer to longer dated prices.
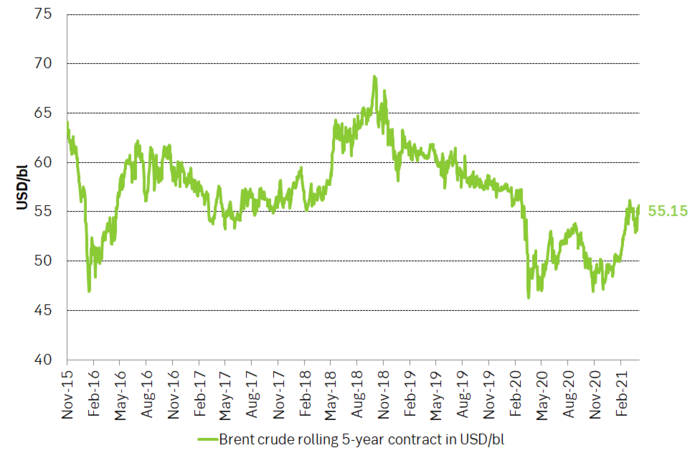
The 5-year Brent contract now trades at USD 55/bl which is just USD 3.5/bl below the average of the 5-year contract from Jan 2016 to Dec 2019 of USD 58.5/bl. Thus, longer dated Brent crude oil contracts are now very close to “normal” so to speak. In a total flattening of the Brent crude oil curve if crude stocks build more and speculative positions takes yet more exit the Brent crude prices would naturally decline to USD 55/bl where the longer dated contracts are located right now. Though this is not our main scenario it paints a picture of where Brent crude would naturally head if further bearishness unfolds. And in terms of price-pullbacks we have still not spanned a full USD 10/bl since the recent high close of USD 69.63/bl on 11 March. Pull-backs of USD 10-12/bl are normal during price recoveries.
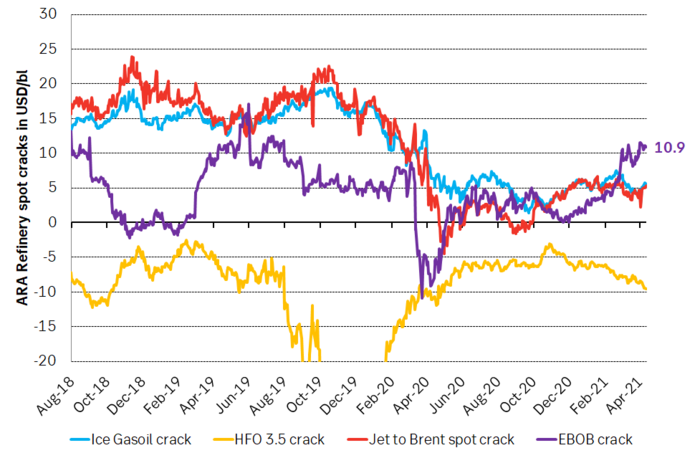
If we however look at oil products we see that gasoline refining margins are now USD 11/bl in Europe versus a more normal USD 5-6/bl. I.e. they are very strong. And with more to come. This reflects strengthening gasoline demand together with strong naphtha (for plastics) demand where both products are at the lighter end of the barrel. Diesel and middle distillate cracks are still weak versus normal as demand for jet fuel is still subdued. Fuel oil 3.5 cracks are weakening and reports are that floating stocks of 3.5% is building off the coast of Iraq as it struggles to process this part of the barrel. Increasing exports of medium sour crude from OPEC+ is also weakening this part of the complex while production of light sweet crude from the US is overall still ticking lower.
US oil product demand is now only 1.5 m bl/d below its 2019 level if we only count crude oil based products. And more demand is set to come back by the day as the US economy opens up over the coming 2 months. If we include propane and polypropylene then US product demand is already very close to normal.
Global, floating crude stocks have ticked higher from a low of 80 m barrels and now at 106 m barrels. Current refinery maintenance is part of this. The trend and the goal of OPEC+ was to move down to 50-60 million barrels (normal). But not yet.
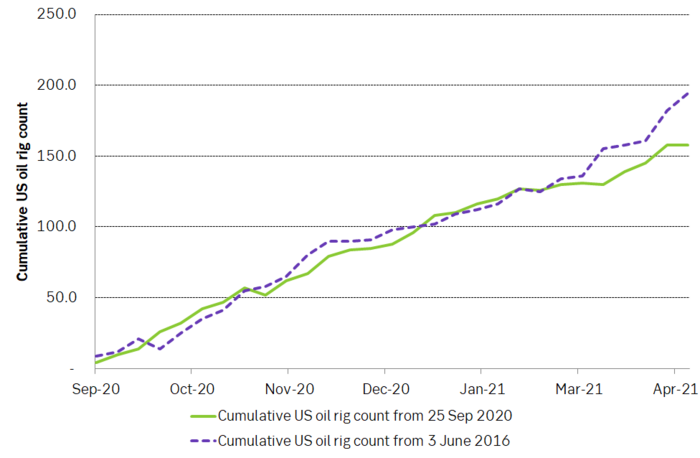
US oil rig count did not rise last week and there is now an emerging difference between the activation of drilling rigs from June 2016 versus the one that started in September 2020. Will shale oil producers actually be true to their words that this time will be different and that they won’t spend all income on drilling and instead be prudent? This emerging picture is lending support to longer dated contracts for 2022/23/24
Source: SEB, Bloomberg
Market is starting to take US/Iran headlines with a pinch of salt. Brent crude rose $2.8/b yesterday to an official close of $112.1/b. But after that it traded as low as $108.05/b before ending late night at around $109.7/b. Through the day it traded in a range of $106.87 – 112.72/b amid a flurry of news or rumors from Iran and the US. ”US temporary sanctions during negotiations” (falls alarm). ”We will bomb Iran” (not anyhow),… etc. While the market is still fluctuating to this kind of news flow, it is starting to take such headlines with a pinch of salt.

We’ll see. Maybe, maybe not. The Brent M1 contract is trading at $110.2/b this morning which very close to the average ticks through yesterday of $110.4/b.
Trump with bearish, verbal intervention whenever Brent trades above $110/b it seems. What seems to be a pattern is that Trump states something like ”very good negotiations going on with Iran”, ”New leaders in Iran are great,..”, ”Great progress in negotiations,…”, ”Deal in sight,..” etc whenever the Brent M1 contract trades above $110/b. An effort to cool the market. These hot air verbal interventions from Trump used to have a heavy bearish impact on prices, but they now seems to have less and less effect unless they are backed by reality.
As far as we can see there has been no real progress in the negotiations between the US and Iran with both sides still standing by their previous demands.
Iran is getting stronger while the cease fire lasts making a return to war for Trump yet harder. Iran is naturally in constant preparation for a return to war given Trump’s steady threats of bombing Iran again. Iran is naturally doing what ever is possible to prepare for a return to war. And every day the cease fire lasts it is better prepared. This naturally makes it more and more difficult and dangerous for the US to return to warring activity versus Iran as the consequences for energy infrastructure in the Persian Gulf will be more and more severe the longer the cease fire lasts. Israel seems to see it this way as well. That the war is not won and that current frozen state of a cease fire gives Iran opportunity to rebuild military and politically.
Global inventories are drawing down day by day. How much? In the meantime the Strait of Hormuz stays closed. There is varying measures and estimates of how much global inventories are drawing down. Our rough estimate, back of the envelope, is that global inventories are drawing down by at least some 10 mb/d or about 300 mb/d in a balance between loss of supply versus demand destruction. Other estimates we see are a monthly draw of 250-270 mb/d. The IEA only ’measured’ a draw in global observable stocks of 117 mb in April with oil on water rising 53 mb while on shore stocks fell 170 mb. But global stocks are hard to measure with large invisible, unmeasured stocks. As such a back of the envelope approach may be better.
Oil products is what the world is consuming. Oil product prices likely to rise while product stocks fall. Strategic Petroleum Reserves (SPR) are predominantly crude oil. Discharging oil from OECD SPR stocks, a sharp reduction in Chinese crude imports and a reduction in global refinery throughput of 6-7 mb/d has helped to keep crude oil markets satisfactorily supplied. But global inventories are drawing down none the less. And oil products is really what the world is consuming. So if global refinery throughput stays subdued, then demand will eventually have to match the supply of oil products. The likely path forward this summer is a steady draw down in jet fuel, diesel and gasoline. Higher prices for these. Then, if possible, higher refinery throughput and higher usage of crude in response to very profitable refinery margins. And lastly sharper draw in crude stocks and higher prices for these. But some 6 mb/d of oil products used to be exported through the Strait of Hormuz. And it may not be so easy to ramp up refinery activity across the world to compensate. Especially as Ukraine continues to damage Russian refineries as well as Russian crude production and export facilities.
Watch oil product stocks and prices as well as Brent calendar 2027. What to watch for this summer is thus oil product inventories falling and oil product premiums to crude rising. Another measure to watch is the Brent crude 2027 contract as it rises steadily day by day as the Strait of Hormuz stays closed and global oil inventories decline. The latter is close to the highest level since the start of the war and keeps rising.
The Brent M1 contract and the Brent 2027 prices and current price of jet fuel in Europe (ARA). All in USD/b

Our back of the envelope calculation of the global shortage created by the closure of the Strait of Hormuz. Note that 3.5 mb/d of discharge from SPR is also a draw. Note also that ’Forced demand loss’ of 2.5 mb/d is probably temporary and will fall back towards zero as logistics are sorted out leaving ’Price demand loss’ to do the job of balancing the market. Thus a shortfall of at least 9 mb/d created by the closure. More if SPR discharge is included and more if Forced demand loss recedes.

Brent is climbing higher. Front-month is at USD 106.3/bl this morning, close to a weekly high and a USD 9/bl jump from Mondays open. This is the move we flagged as a risk earlier in the week: the market shifting from ”a deal is around the corner” to ”this is going to take longer than we thought”.

Analyst Commodities, SEB
During April, rest-of-year Brent remained remarkably stable around USD 90/bl. A stability which rested on one single assumption: the SoH reopens around 1 May. That assumption is now slowly falling apart.
As we highlighted yesterday: every week of delay beyond 1 May adds (theoretically) ish USD 5/bl to the rest-of-year average, as global inventories draw 100 million barrels per week. i.e., a mid-May reopening implies rest-of-year Brent closer to USD 100/bl, and anything pushing into June or July takes us meaningfully higher.
What’s changed in the last 48 hours:
#1: The US military has formally warned that clearing suspected sea mines from SoH could take up to six months. That is a completely different timescale from what the financial market is pricing. Even a political deal tomorrow does not immediately reopen the strait.
#2: Trump has shifted his tone from urgency to ”strategic patience”. In yesterday’s press conference: ”Don’t rush me… I want a great deal.” The market is reading this as a president no longer feeling pressured by timelines, with the naval blockade running in the background.
#3: So far, the military activity is escalating, not de-escalating. Axios reports Iran is laying more mines in SoH. The US 3rd carrier strike group (USS George H.W. Bush) is arriving with two countermine vessels. Trump yesterday ordered the US Navy to destroy any Iranian boats caught laying mines. While CNN reports that the Pentagon is actively drawing up plans to strike Iranian SoH capabilities and individual Iranian military leaders if the ceasefire collapses. i.e., NOT a attitude consistent with an imminent deal!
Spot crude and product prices eased off the early-April highs on a combination of system rerouting and deal optimism. Both now weakening. Goldman estimates April Gulf output is reduced by 14.5 mbl/d, or 57% of pre-war supply, a number that keeps getting worse the longer this drags on.
Demand-side adaptation is ongoing: S. Korea has cut its Middle East crude dependence from 69% to 56% by pulling more from the Americas and Africa, and Japan is kicking off a second round of SPR releases from 1 May. But SPRs are finite.
Ref. to the negotiations, we should not bet on speed. The current Iranian leadership is dominated by genuine hardliners willing to absorb economic pain and run the clock to extract concessions. That is not a setup for a rapid resolution. US/Israeli media briefings keep framing the delay as ”internal Iranian divisions”, the reality is more complicated and points toward weeks and months, not days.
Our point is that the complexity is large, and higher prices have only just started (given a scenario where the negotiations drag out in time). The market spent April leaning on the USD 90/bl rest-of-year assumption; that case is diminishing by the hour. If ”early May reopening” is replaced by ”June, July or later” over the next week or two, both crude and products have meaningful room to reprice higher from here. There is a high risk being short energy and betting on any immediate political resolution(!).
Down on Friday. Up on Monday. The Brent June crude oil contract traded down 5.1% last week to a close of $90.38/b. It reached a high of $103.87/b last Monday and a low of $86.09/b on Friday as Iran announced that the Strait of Hormuz was fully open for transit. That quickly changed over the weekend as the US upheld its blockade of Iranian oil exports while Iran naturally responded by closing the SoH again. The US blew a hole in the engine room of the Iranian ship TOUSKA and took custody of the ship on Sunday. Brent crude is up 5.6% this morning to $95.4/b.
The cease-fire is expiring tomorrow. The US has said it will send a delegation for a second round of negotiations in Islamabad in Pakistan. But Iran has for now rejected a second round of talks as it views US demands as unrealistic and excessive while the US is also blocking the Strait of Hormuz.
While Brent is up 5% this morning, the financial market is still very optimistic that progress will be made. That talks will continue and that the SoH will fully open by the start of May which is consistent with a rest-of-year average Brent crude oil price of around $90/b with the market now trading that balance at around $88/b.
Financial optimism vs. physical deterioration. We have a divergence where the financial market is trading negotiations, improvements and resolution while at the same time the physical market is deteriorating day by day. Physical oil flows remain constrained by disrupted flows, longer voyage times and elevated freight and insurance costs.
Financial markets are betting that a US/Iranian resolution will save us in time from violent shortages down the road. But every day that the SoH remains closed is bringing us closer to a potentially very painful point of shortages and much higher prices.
The US blockade is also a weapon of leverage against its European and Asian allies. When Iran closed the SoH it held the world economy as a hostage against the US. The US blockade of the SoH is of course blocking Iranian oil exports. But it is also an action of disruption directed towards Europe and Asia. The US has called for the rest of the world to engaged in the war with Iran: ”If you want oil from the Persian Gulf, then go and get it”. A risk is that the US plays brinkmanship with the global oil market directed towards its European and Asian allies and maybe even towards China to force them to engage and take part. Maybe unthinkable. But unthinkable has become the norm with Trump in the White House.


Sommarväder skapar prisrally på elbörsen
Oil product price pain is set to rise as the Strait of Hormuz stays closed into summer

Solkraften pressar elpriserna dagtid

Michel Gubel ger sin syn på oljemarknaden