

Analys
EU sanctions on Russian alu will likely drive EU premiums higher

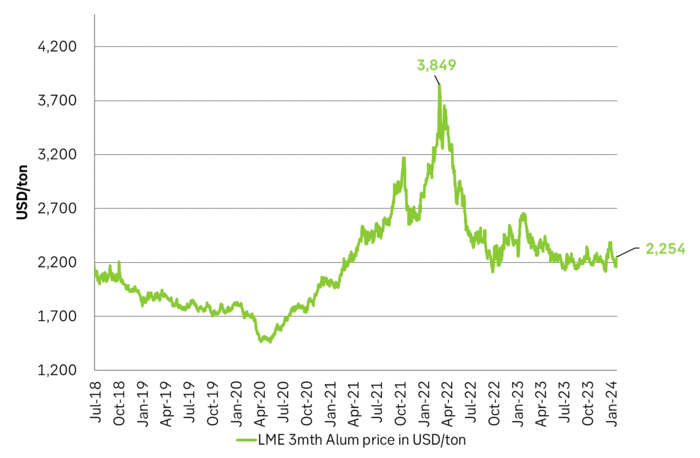
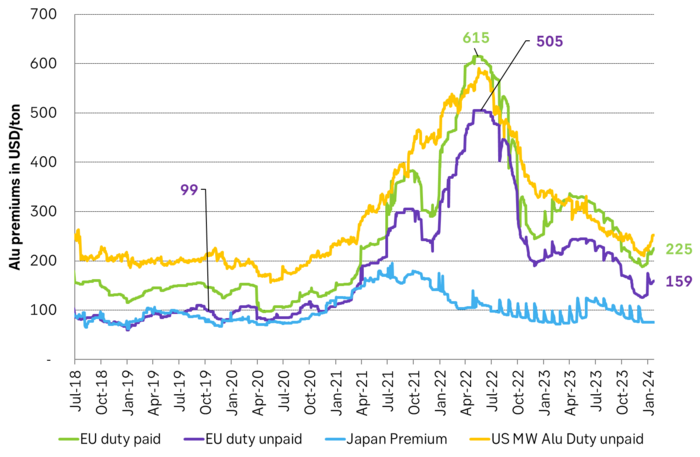
The LME 3mth alu price has bounced 4.5% past two days but its a far cry from 2022 impacts. The 3mth aluminum price has bounced 4.5% (+96 USD/ton) to USD 2256.5/ton on news that the EU is considering an embargo on Russian aluminum. It’s a notable gain amid an otherwise lukewarm and bearish energy complex where natural gas and coal prices have been trending steadily lower since October last year. But it is nothing compared to what happened in 2022 when Russia attacked Ukraine. The 3mth aluminum price then rallied to USD 3849/ton and the EU aluminum premium rallied to USD 505/ton versus a more normal USD 100/ton. Thus so far the the price action in aluminum is nothing like what we experienced in 2022.

It looks likely to us that the EU will indeed impose sanctions on Russian aluminium. We don’t know yet if the EU actually will implement sanctions on Russian aluminum. Personally I think its likely that they will do it as it is kind of a moral stand and the last large piece of the Russian energy complex which is possible to place under sanctions. But the actual effects both on the EU and Russia will likely be limited. Russia will not stop producing and exporting aluminium. Rather it will export it and send it elsewhere in the world. That is what happened to Russian crude and product exports. They weren’t lost in terms of global supply, but rerouted elsewhere.
New sanctions will have limited effect on Russia and dissipate over time. It’s a moral stand. Previously it was possible to enforce effective sanctions on one specific country. Those were the days when the US ruled the world and China chose to side with the US. For example with sanctions on Iran. These sanctions have not at all been lifted yet. But Iranian oil exports have rebounded from 1.9 m b/d at the low in 2019 to now 3.2 m b/d as China now is accepting to import Iranian crude oil and is placing less emphasis on the US.
The effect of sanctions have a tendency to deteriorate over time. Even when the US ruled the world and China played along. But sanctions today will leak massively if China isn’t playing along with what the EU and the US wants. And China isn’t playing along.
The goal is to hurt Russia’s income from aluminum exports. But the effect will be limited. The aim with the sanctions towards Russian oil, and now possibly also aluminum, isn’t to bar the supply from the global market. Rather the opposite. Neither the US nor the EU wants to put a stop to Russian raw materials exports as it could drive up the price of these globally which would hurt consumers and generate inflation. The aim is to keep exports flowing but to try to hurt Russian earnings from the exports. The same will likely be the case for the potentially upcoming EU sanctions on aluminum.
But even the ”hurt the income” strategy with a cap on the price of Russian crude and products has deteriorated over time. Russian Urals crude had a discount to Brent crude in 2022 of as much as USD 36/b and today it is only USD 12/b below Brent.
Russia has probably made contingency plans a long time ago. Russia has also probably made contingency plans for its aluminum exports as the risk has been there all along since 2022. Thus new EU sanctions towards Russian aluminium exports will likely be less of a shock today versus when all hell broke lose in 2022.
Europe has also already reduced its Russian imports of primary aluminium, to about 10% of its primary needs. A large proportion of imports are now increasingly coming from middle eastern producers.
EU alu premiums already rising along with Mid-East issues (Red Sea). Will rise further with sanctions. Issues in the region has pushed up freight costs, insurance costs and added transit delays and length of journey to Europe. A combination of these issues have already lifted the European premium. New sanctions on Russia will likely lift the regional premiums further.
The dirty details. How deeply is EU’s industrial supply chains embedded in Russian alu semies? The actual effects of new EU sanctions on Russian aluminum will be down to the dirty details. An important question is how deeply Russian semies, and prefabricated aluminum parts (which also looks to be sanctioned) are embedded and integrated in the European industrial system (supply chains). If the EU is deeply dependent of pre-fabricated aluminum parts from Russia, then it could be painful for EU to disentangle from these imports.
Sanctions = additional costs and frictions as global aluminum flows are rerouted. New sanctions will naturally lead to frictions and some added price due to that. Aluminum can of course be transported across the world. It is cheaper to transport it from Russia to Europe and that is why it historically has landed in the EU. But, if need be, due to possible EU sanctions towards Russia on aluminum, then Russia can and will send its aluminum to other global regions, maybe and possibly predominantly, to China. Then the EU can and must import more aluminum from other places instead. Probably the middle east and maybe from China
The Global LME 3mth price will likely rise only marginally as no supply is actually lost. Just rerouted. The price of aluminum across the world may increase a little bit due to such sanction-frictions but probably not all that much since there will not be any loss of supply and only added transportation frictions and costs.
EU aluminum premiums will naturally rise in order to attract non-Russian supply from further away. EU Alu-premiums should naturally increase in order to attract aluminum from further away. China will probably be able to import Russian aluminum on the cheap. So Russia will lose some income on its aluminum exports as it potentially has to cover transportation costs all the way to China and possibly an additional discount in order for China to take it. China may only import a lot of Russian aluminium if it can get it on the cheap. China can then export more as its country balance will improve and possibly export all the way back to Europe.
A weak macro-backdrop in Europe makes sanctions easier. The backdrop to all of this is very weak aluminum demand in Europe amid a bleak macro-picture. Disruption of Russian supply to the EU should thus be less painful than it otherwise would have been.
What to do with Russian alu stocks already in EU LME storage? Consume it or export it? A tricky question is what to do about all the Russian aluminum which currently is sitting at EU LME storage sites where it is constituting some 90% of aluminum stocks. If it has to leave EU LME storage sites due to sanctions then it may have to be sold at a discount in order to get it to flow elsewhere. Maybe it will create deep front-end contango is one speculation. A natural solution however would be that sanctions allows consumption of Russian aluminum currently in stock in the EU but bans new and further stocking of Russian aluminum. Then these Russian stocks would gradually be consumed and dissipate and instead gradually be replaced by non-Russian aluminum.
”Futures market can tighten quickly and spreads could rally.” The following is a comment from one of SEB’s metals traders: ”The futures market could get very tight very quickly following EU sanctions on Russian aluminum. Spreads could tighten aggressively until market reaches a new balance.”
The LME 3mth aluminum price rallied to USD 3,849/ton when Russia attacked Ukraine. Price has now gained a little (+4.5%) to USD 2,254/ton on possible EU sanctions.
Aluminum premiums across the world. EU premiums rallied to USD 505/ton and USD 615/ton (duty unpaid and paid resp.) in 2022 vs normal USD 100-150/ton. Now gained a little on Mid-East troubles and rerouting. Could rise much more on EU sanctions.
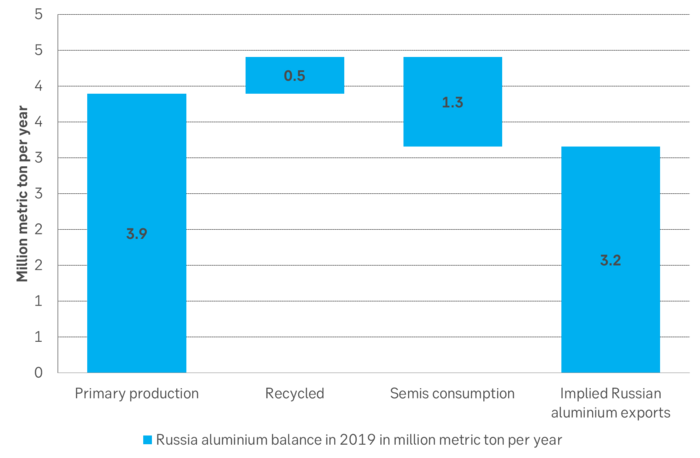
Russia probably has a normal, net export of alu semies and primary alu of around 3 m mtpa. This would normally be destined to Europe.
Some rebound but not much. Brent crude rebounded 1.5% yesterday to $65.47/b. This morning it is inching 0.2% up to $65.6/b. The lowest close last week was on Thursday at $64.11/b.

The curve structure is almost as week as it was before the weekend. The rebound we now have gotten post the message from OPEC+ over the weekend is to a large degree a rebound along the curve rather than much strengthening at the front-end of the curve. That part of the curve structure is almost as weak as it was last Thursday.
We are still on a weakening path. The message from OPEC+ over the weekend was we are still on a weakening path with rising supply from the group. It is just not as rapidly weakening as was feared ahead of the weekend when a quota hike of 500 kb/d/mth for November was discussed.
The Brent curve is on its way to full contango with Brent dipping into the $50ies/b. Thus the ongoing weakening we have had in the crude curve since the start of the year, and especially since early June, will continue until the Brent crude oil forward curve is in full contango along with visibly rising US and OECD oil inventories. The front-month Brent contract will then flip down towards the $60/b-line and below into the $50ies/b.
At what point will OPEC+ turn to cuts? The big question then becomes: When will OPEC+ turn around to make some cuts? At what (price) point will they choose to stabilize the market? Because for sure they will. Higher oil inventories, some more shedding of drilling rigs in US shale and Brent into the 50ies somewhere is probably where the group will step in.
There is nothing we have seen from the group so far which indicates that they will close their eyes, let the world drown in oil and the oil price crash to $40/b or below.
The message from OPEC+ is also about balance and stability. The world won’t drown in oil in 2026. The message from the group as far as we manage to interpret it is twofold: 1) Taking back market share which requires a lower price for non-OPEC+ to back off a bit, and 2) Oil market stability and balance. It is not just about 1. Thus fretting about how we are all going to drown in oil in 2026 is totally off the mark by just focusing on point 1.
When to buy cal 2026? Before Christmas when Brent hits $55/b and before OPEC+ holds its last meeting of the year which is likely to be in early December.
Brent crude oil prices have rebounded a bit along the forward curve. Not much strengthening in the structure of the curve. The front-end backwardation is not much stronger today than on its weakest level so far this year which was on Thursday last week.

The front-end backwardation fell to its weakest level so far this year on Thursday last week. A slight pickup yesterday and today, but still very close to the weakest year to date. More oil from OPEC+ in the coming months and softer demand and rising inventories. We are heading for yet softer levels.

Down to the lowest since early May. Brent crude has fallen sharply the latest four days. It closed at USD 64.11/b yesterday which is the lowest since early May. It is staging a 1.3% rebound this morning along with gains in both equities and industrial metals with an added touch of support from a softer USD on top.
What stands out the most to us this week is the collapse in the Dubai one to three months time-spread.
Dubai is medium sour crude. OPEC+ is in general medium sour crude production. Asian refineries are predominantly designed to process medium sour crude. So Dubai is the real measure of the balance between OPEC+ holding back or not versus Asian oil demand for consumption and stock building.
A sharp weakening of the front-end of the Dubai curve. The front-end of the Dubai crude curve has been holding out very solidly throughout this summer while the front-end of the Brent and WTI curves have been steadily softening. But the strength in the Dubai curve in our view was carrying the crude oil market in general. A source of strength in the crude oil market. The core of the strength.
The now finally sharp decline of the front-end of the Dubai crude curve is thus a strong shift. Weakness in the Dubai crude marker is weakness in the core of the oil market. The core which has helped to hold the oil market elevated.
Facts supports the weakening. Add in facts of Iraq lifting production from Kurdistan through Turkey. Saudi Arabia lifting production to 10 mb/d in September (normal production level) and lifting exports as well as domestic demand for oil for power for air con is fading along with summer heat. Add also in counter seasonal rise in US crude and product stocks last week. US oil stocks usually decline by 1.3 mb/week this time of year. Last week they instead rose 6.4 mb/week (+7.2 mb if including SPR). Total US commercial oil stocks are now only 2.1 mb below the 2015-19 seasonal average. US oil stocks normally decline from now to Christmas. If they instead continue to rise, then it will be strongly counter seasonal rise and will create a very strong bearish pressure on oil prices.
Will OPEC+ lift its voluntary quotas by zero, 137 kb/d, 500 kb/d or 1.5 mb/d? On Sunday of course OPEC+ will decide on how much to unwind of the remaining 1.5 mb/d of voluntary quotas for November. Will it be 137 kb/d yet again as for October? Will it be 500 kb/d as was talked about earlier this week? Or will it be a full unwind in one go of 1.5 mb/d? We think most likely now it will be at least 500 kb/d and possibly a full unwind. We discussed this in a not earlier this week: ”500 kb/d of voluntary quotas in October. But a full unwind of 1.5 mb/d”
The strength in the front-end of the Dubai curve held out through summer while Brent and WTI curve structures weakened steadily. That core strength helped to keep flat crude oil prices elevated close to the 70-line. Now also the Dubai curve has given in.

Brent crude oil forward curves

Total US commercial stocks now close to normal. Counter seasonal rise last week. Rest of year?

Total US crude and product stocks on a steady trend higher.

Analys
OPEC+ will likely unwind 500 kb/d of voluntary quotas in October. But a full unwind of 1.5 mb/d in one go could be in the cards
Down to mid-60ies as Iraq lifts production while Saudi may be tired of voluntary cut frugality. The Brent December contract dropped 1.6% yesterday to USD 66.03/b. This morning it is down another 0.3% to USD 65.8/b. The drop in the price came on the back of the combined news that Iraq has resumed 190 kb/d of production in Kurdistan with exports through Turkey while OPEC+ delegates send signals that the group will unwind the remaining 1.65 mb/d (less the 137 kb/d in October) of voluntary cuts at a pace of 500 kb/d per month pace.
Signals of accelerated unwind and Iraqi increase may be connected. Russia, Kazakhstan and Iraq were main offenders versus the voluntary quotas they had agreed to follow. Russia had a production ’debt’ (cumulative overproduction versus quota) of close to 90 mb in March this year while Kazakhstan had a ’debt’ of about 60 mb and the same for Iraq. This apparently made Saudi Arabia angry this spring. Why should Saudi Arabia hold back if the other voluntary cutters were just freeriding? Thus the sudden rapid unwinding of voluntary cuts. That is at least one angle of explanations for the accelerated unwinding.
If the offenders with production debts then refrained from lifting production as the voluntary cuts were rapidly unwinded, then they could ’pay back’ their ’debts’ as they would under-produce versus the new and steadily higher quotas.
Forget about Kazakhstan. Its production was just too far above the quotas with no hope that the country would hold back production due to cross-ownership of oil assets by international oil companies. But Russia and Iraq should be able to do it.
Iraqi cumulative overproduction versus quotas could reach 85-90 mb in October. Iraq has however steadily continued to overproduce by 3-5 mb per month. In July its new and gradually higher quota came close to equal with a cumulative overproduction of only 0.6 mb that month. In August again however its production had an overshoot of 100 kb/d or 3.1 mb for the month. Its cumulative production debt had then risen to close to 80 mb. We don’t know for September yet. But looking at October we now know that its production will likely average close to 4.5 mb/d due to the revival of 190 kb/d of production in Kurdistan. Its quota however will only be 4.24 mb/d. Its overproduction in October will thus likely be around 250 kb/d above its quota with its production debt rising another 7-8 mb to a total of close to 90 mb.
Again, why should Saudi Arabia be frugal while Iraq is freeriding. Better to get rid of the voluntary quotas as quickly as possible and then start all over with clean sheets.
Unwinding the remaining 1.513 mb/d in one go in October? If OPEC+ unwinds the remaining 1.513 mb/d of voluntary cuts in one big go in October, then Iraq’s quota will be around 4.4 mb/d for October versus its likely production of close to 4.5 mb/d for the coming month..
OPEC+ should thus unwind the remaining 1.513 mb/d (1.65 – 0.137 mb/d) in one go for October in order for the quota of Iraq to be able to keep track with Iraq’s actual production increase.
October 5 will show how it plays out. But a quota unwind of at least 500 kb/d for Oct seems likely. An overall increase of at least 500 kb/d in the voluntary quota for October looks likely. But it could be the whole 1.513 mb/d in one go. If the increase in the quota is ’only’ 500 kb/d then Iraqi cumulative production will still rise by 5.7 mb to a total of 85 mb in October.
Iraqi production debt versus quotas will likely rise by 5.7 mb in October if OPEC+ only lifts the overall quota by 500 kb/d in October. Here assuming historical production debt did not rise in September. That Iraq lifts its production by 190 kb/d in October to 4.47 mb/d (August level + 190 kb/d) and that OPEC+ unwinds 500 kb/d of the remining quotas in October when they decide on this on 5 October.


Blykalla, Evroc och Studsvik vill bygga kärnkraftsdrivna datacenter i Sverige

Toppmöte om framtidens kärnkraft runt Östersjön hölls idag

Nytt prisrekord, guld stiger över 4000 USD

Goldman Sachs höjer prognosen för guld, tror priset når 4900 USD
More weakness and lower price levels ahead, but the world won’t drown in oil in 2026

Mahvie Minerals i en guldtrend
Volatile but going nowhere. Brent crude circles USD 66 as market weighs surplus vs risk

Aktier i guldbolag laggar priset på guld

Kinas elproduktion slog nytt rekord i augusti, vilket även kolkraft gjorde

Tyskland har så höga elpriser att företag inte har råd att använda elektricitet
-
 Nyheter4 veckor sedan
Mahvie Minerals i en guldtrend
-
Analys4 veckor sedan
Volatile but going nowhere. Brent crude circles USD 66 as market weighs surplus vs risk
-
 Nyheter4 veckor sedan
Aktier i guldbolag laggar priset på guld
-
 Nyheter3 veckor sedan
Kinas elproduktion slog nytt rekord i augusti, vilket även kolkraft gjorde
-
Nyheter3 veckor sedan
Tyskland har så höga elpriser att företag inte har råd att använda elektricitet
-

 Nyheter4 veckor sedan
Guld når sin högsta nivå någonsin, nu även justerat för inflation
-

 Nyheter4 veckor sedan
Det stigande guldpriset en utmaning för smyckesköpare
-
Analys4 veckor sedan
Waiting for the surplus while we worry about Israel and Qatar