

Analys
Dollar Weakness Helps Gold To All-Time Highs
Gold Passes Two Important Sign-Posts
The gold bull market passed two important sign-posts in July. The strength of the market is impressive as it blew through $1,800 and the all-time high of $1,921. These prices had been major technical resistance points set a decade ago.
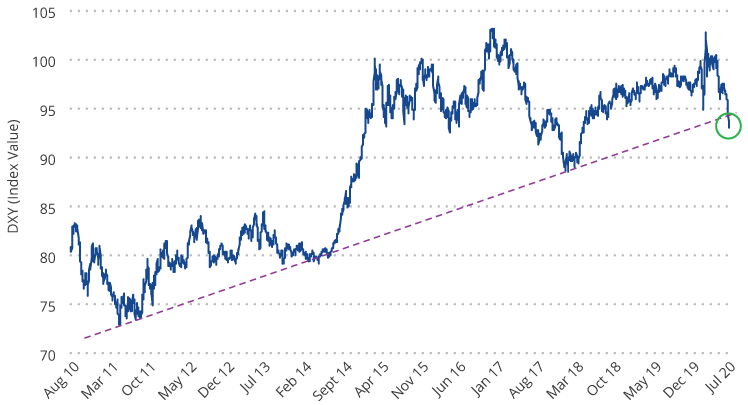
The second significant signpost in July was the new U.S. dollar weakness. U.S. dollar weakness is a hallmark of most gold bull markets, but in this cycle gold had so far been rising in a flat dollar environment. The chart below shows the U.S. dollar index (DXY)1 has been in a bull market since 2011. However, the dollar declined through July, then fell precipitously at the end of the month, appearing to have broken its long-term trend. We may be seeing the beginnings of a bear market for the dollar. This enabled gold to test the $2,000 per ounce milestone as it reached an intraday high of $1,983 on July 31. Gold closed out July at $1,975.86 per ounce for a $194.90 (10.9%) monthly gain.
U.S. Dollar Index Breaking Its Near 10-Year Support Trend (2011 to 2020)?
Gold Miners Remain Well Positioned (Especially Junior Developers)
Gold stocks moved higher as the vast majority of companies reporting second quarter results met or exceeded expectations. COVID-related costs were also reported, showing the industry has done an excellent job of dealing with operational issues in our view. For example, 1.7 million ounce producer Agnico-Eagle (approximately net assets of 4.7% as of end-July) was among those hardest hit by pandemic lock downs. Its costs for temporary mine suspensions totaled $22 million, whereas the cash provided from operations totaled $162 million. Going forward, per the company’s second quarter 2020 financial results, Agnico-Eagle expects COVID protocols to cost $6 per ounce, which raises their cash costs by less than 1%. For the month, the NYSE Gold Miners Index (GDMNTR)2 gained 14.4%, while the MVIS Global Junior Gold Miners Index (MVGDXJTR)3 advanced 19.8%.
Junior developers are a class of company that you won’t find much of in passive index funds. These are companies with properties that are in various stages of development, but not yet producing gold. Our active gold equity strategy invests across the spectrum of companies and currently carries 22 junior developers that total approximately 26% of the strategy’s net assets as of end-July. These companies had been underperforming since the gold price broke out in June 2019. This is a sharp contrast from past bull markets, when the juniors began outperforming the larger companies much earlier. Through the second quarter and into July, the junior developers have finally kicked into gear. Seven of our juniors have now gained over 100% year to date. We don’t expect to give back these gains because the stocks had been extremely undervalued and many of our companies have announced encouraging drill results and new discoveries that create lasting value. In addition, investors have returned to the junior sector, enabling companies to raise $1.5 billion this year, and the second quarter was their strongest for equity raises since 2012, according to RBC Capital Markets.
$2,000 Gold Is About More Than Just The Pandemic
Gold has tested the $2,000 per ounce level sooner than we had anticipated and we believe there is more than the pandemic to overcome at this point.
- Slower Recovery – During July, two Federal Reserve (Fed) presidents, a Fed governor, and its Chairman all warned of a long, slow road to economic recovery. Initial jobless claims have stagnated for eight weeks at around 1.4 to 1.5 million. Contrast this with the Global Financial Crisis (GFC), where initial jobless claims declined steadily to 587,000 in the same time frame, seventeen weeks after the recession peak. JPMorgan said it was preparing for an unemployment rate that remains in double digits well into next year and a slower recovery in gross domestic product (GDP) than the bank’s economists assumed three months ago.
- Deficits, Debt & Defaults – The U.S. budget deficit totaled $863 billion in June, as much as the entire gap in 2019. With the new stimulus bill now being considered in Congress, the annual deficit could exceed $4.7 trillion. This is on top of record peace-time deficits before the pandemic.
Corporate debt is also at record levels and many households are feeling financial stress. Ultra low interest rates over the past two decades have encouraged the accumulation of unproductive government and private debt. It fuels the rise of giant firms, while “zombie” companies (companies with earnings less than their debt service costs) have proliferated. This is at the expense of start-ups, innovation and creative destruction. The result is low levels of productivity, causing recoveries to become weaker and weaker. The Wall Street Journal reports the largest U.S. banks have set aside $28 billion to cover losses as consumers and businesses start to default on their loans.
What Could Drive Gold Prices Even Higher?
The pandemic created a deflationary shock to the economy and the massive accumulation of debt since the GFC creates a drag on productivity that could guarantee a low growth economy for decades to come. Negative real rates, persistent risks to economic well-being, and the weak dollar are drivers that we believe could enable gold to trend to $3,400 per ounce in the coming years. This might be a conservative forecast considering the 180% rise gold experienced from the depths of the GFC. Several scenarios could see gold prices moving higher from there:
- Systemic collapse as debt issuance overwhelms the financial markets.
- An inflationary cycle brought on by either: a) trillions of U.S. dollars, euros, yen and yuan being pumped into the global financial system, b) governments enabling inflation to ease the debt burden, c) implementation of modern monetary theory or other forms of money printing to fund government spending without issuing debt.
- U.S. Dollar Crisis – America is dealing with deficits, divisive politics, social unrest and deteriorating international relations on a scale rarely seen in history. While other countries may have similar problems, they do not oversee the world’s reserve currency. The U.S. is held to a higher standard and a crisis of confidence could weigh heavily on the dollar.
Some might balk at such bold forecasts, however, we believe the various drivers of gold are rarely aligned as they are today. We also consider gold’s relative size in the financial markets. There have been 200,000 tonnes of gold mined in the history of the world and virtually all of it is potentially available to the market. A gold price of $2,000 per ounce yields a market value of $12.9 trillion. Compare this with global stock, bond and currency markets, each of which totals roughly $100 trillion or more. A relatively small shift in funds from these markets may fuel the gold price for a long time.
In addition, the market value of the global gold industry as of end-July is approximately $530 billion. The market value of Alphabet Inc. as of the same time, alone, is $1.0 trillion. Gold mining is a relatively tiny sector that, in addition to carrying earnings leverage to the gold price, carries a scarcity factor when market demand is high.
1U.S. Dollar Index (DXY) indicates the general international value of the U.S. dollar by averaging the exchange rates between the U.S. dollar and six major world currencies.
2NYSE Arca Gold Miners Index (GDMNTR) is a modified market capitalization-weighted index comprised of publicly traded companies involved primarily in the mining for gold.
3MVIS Global Junior Gold Miners Index (MVGDXJTR) is a rules-based, modified market capitalization-weighted, float-adjusted index comprised of a global universe of publicly traded small- and medium-capitalization companies that generate at least 50% of their revenues from gold and/or silver mining, hold real property that has the potential to produce at least 50% of the company’s revenue from gold or silver mining when developed, or primarily invest in gold or silver.
Joe Foster, Portfolio Manager/Strategist, VanEck
This commentary originates from VanEck Investments Ltd, a UCITS Management Company under Irish law regulated by the Central Bank of Ireland and VanEck Asset Management B.V., a UCITS Management Company under Dutch law regulated by the Netherlands Authority for the Financial Markets. It is intended only to provide general and preliminary information to investors and shall not be construed as investment, legal or tax advice. VanEck Investments Ltd, VanEck Asset Management B.V. and its associated and affiliated companies (together “VanEck”) assume no liability with regards to any investment, divestment or retention decision taken by the investor on the basis of this commentary. The views and opinions expressed are those of the author(s) but not necessarily those of VanEck. Opinions are current as of the commentary’s publication date and are subject to change with market conditions. Certain statements contained herein may constitute projections, forecasts and other forward looking statements, which do not reflect actual results. Information provided by third party sources are believed to be reliable and have not been independently verified for accuracy or completeness and cannot be guaranteed. All indices mentioned are measures of common market sectors and performance. It is not possible to invest directly in an index.
All performance information is historical and is no guarantee of future results. Investing is subject to risk, including the possible loss of principal. You must read the Prospectus and KIID before investing in a fund.
No part of this material may be reproduced in any form, or referred to in any other publication, without express written permission of VanEck.


Oil prices are likely to fall for a fourth straight year as OPEC+ unwinds cuts and retakes market share. We expect Brent crude to average USD 55/b in Q4/25 before OPEC+ steps in to stabilise the market into 2026. Surplus, stock building, oil prices are under pressure with OPEC+ calling the shots as to how rough it wants to play it. We see natural gas prices following parity with oil (except for seasonality) until LNG surplus arrives in late 2026/early 2027.

Oil market: Q4/25 and 2026 will be all about how OPEC+ chooses to play it
OPEC+ is in a process of unwinding voluntary cuts by a sub-group of the members and taking back market share. But the process looks set to be different from 2014-16, as the group doesn’t look likely to blindly lift production to take back market share. The group has stated very explicitly that it can just as well cut production as increase it ahead. While the oil price is unlikely to drop as violently and lasting as in 2014-16, it will likely fall further before the group steps in with fresh cuts to stabilise the price. We expect Brent to fall to USD 55/b in Q4/25 before the group steps in with fresh cuts at the end of the year.

Natural gas market: Winter risk ahead, yet LNG balance to loosen from 2026
The global gas market entered 2025 in a fragile state of balance. European reliance on LNG remains high, with Russian pipeline flows limited to Turkey and Russian LNG constrained by sanctions. Planned NCS maintenance in late summer could trim exports by up to 1.3 TWh/day, pressuring EU storage ahead of winter. Meanwhile, NE Asia accounts for more than 50% of global LNG demand, with China alone nearing a 20% share (~80 mt in 2024). US shale gas production has likely peaked after reaching 104.8 bcf/d, even as LNG export capacity expands rapidly, tightening the US balance. Global supply additions are limited until late 2026, when major US, Qatari and Canadian projects are due to start up. Until then, we expect TTF to average EUR 38/MWh through 2025, before easing as the new supply wave likely arrives in late 2026 and then in 2027.
Price action contained withing USD 2/b last week. Likely muted today as well with US closed. The Brent November contract is the new front-month contract as of today. It traded in a range of USD 66.37-68.49/b and closed the week up a mere 0.4% at USD 67.48/b. US oil inventory data didn’t make much of an impact on the Brent price last week as it is totally normal for US crude stocks to decline 2.4 mb/d this time of year as data showed. This morning Brent is up a meager 0.5% to USD 67.8/b. It is US Labor day today with US markets closed. Today’s price action is likely going to be muted due to that.
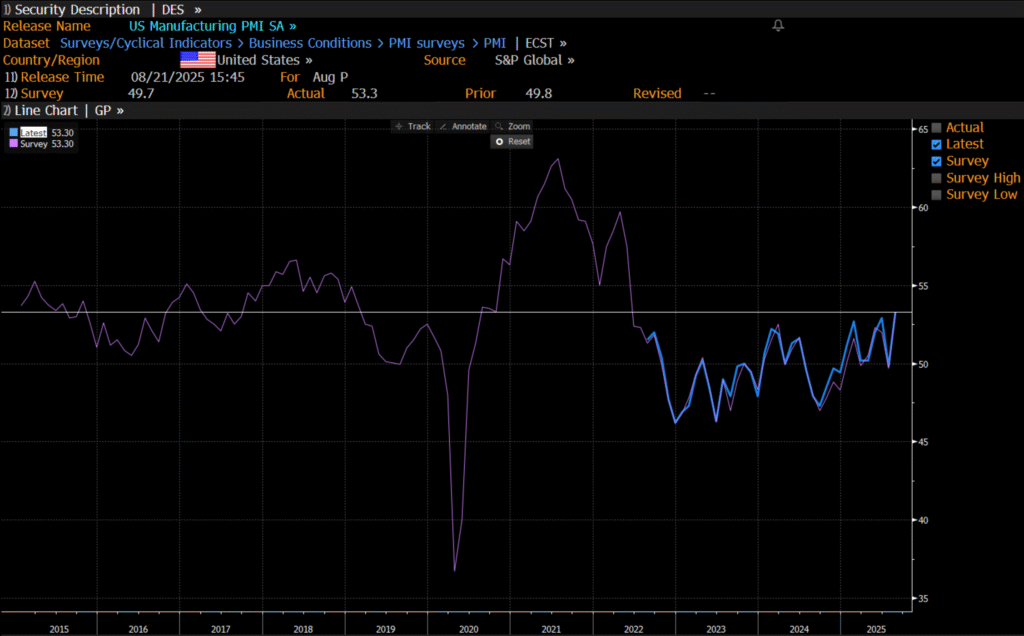
Improving manufacturing readings. China’s manufacturing PMI for August came in at 49.4 versus 49.3 for July. A marginal improvement. The total PMI index ticked up to 50.5 from 50.2 with non-manufacturing also helping it higher. The HCOB Eurozone manufacturing PMI was a disastrous 45.1 last December, but has since then been on a one-way street upwards to its current 50.5 for August. The S&P US manufacturing index jumped to 53.3 in August which was the highest since 2022 (US ISM manufacturing tomorrow). India manufacturing PMI rose further and to 59.3 for August which is the highest since at least 2022.
Are we in for global manufacturing expansion? Would help to explain copper at 10k and resilient oil. JPMorgan global manufacturing index for August is due tomorrow. It was 49.7 in July and has been below the 50-line since February. Looking at the above it looks like a good chance for moving into positive territory for global manufacturing. A copper price of USD 9935/ton, sniffing at the 10k line could be a reflection of that. An oil price holding up fairly well at close to USD 68/b despite the fact that oil balances for Q4-25 and 2026 looks bloated could be another reflection that global manufacturing may be accelerating.
US manufacturing PMI by S&P rose to 53.3 in August. It was published on 21 August, so not at all newly released. But the US ISM manufacturing PMI is due tomorrow and has the potential to follow suite with a strong manufacturing reading.
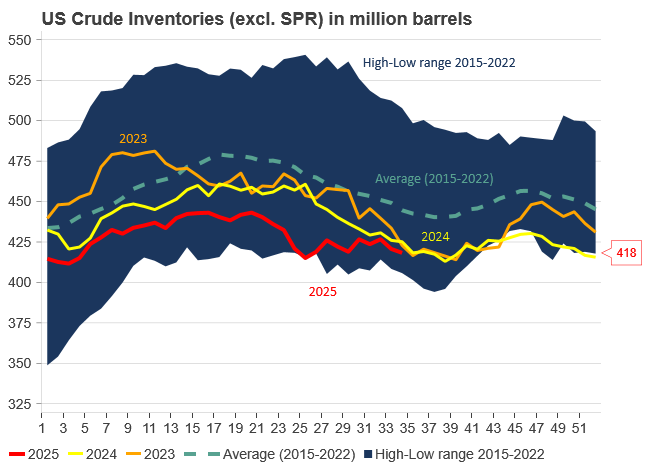
U.S. commercial crude inventories posted another draw last week, falling by 2.4 million barrels to 418.3 million barrels, according to the latest DOE report. Inventories are now 6% below the five-year seasonal average, underlining a persistently tight supply picture as we move into the post-peak demand season.
While the draw was smaller than last week’s 6 million barrel decline, the trend remains consistent with seasonal patterns. Current inventories are still well below the 2015–2022 average of around 449 million barrels.
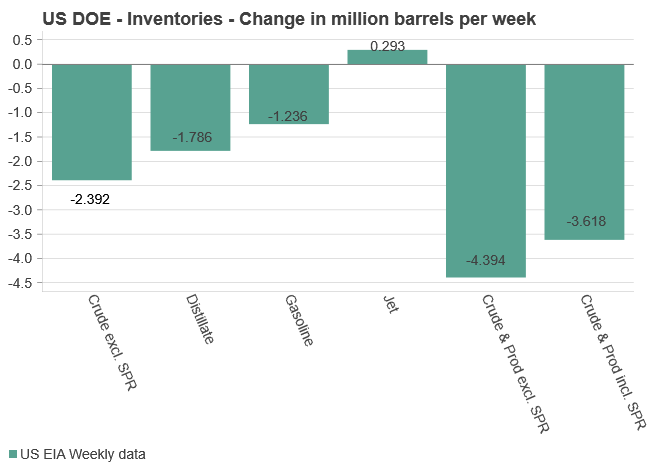
Gasoline inventories dropped by 1.2 million barrels and are now close to the five-year average. The breakdown showed a modest increase in finished gasoline offset by a decline in blending components – hinting at steady end-user demand.
Diesel inventories saw yet another sharp move, falling by 1.8 million barrels. Stocks are now 15% below the five-year average, pointing to sustained tightness in middle distillates. In fact, diesel remains the most undersupplied segment, with current inventory levels at the very low end of the historical range (see page 3 attached).
Total commercial petroleum inventories – including crude and products but excluding the SPR – fell by 4.4 million barrels on the week, bringing total inventories to approximately 1,259 million barrels. Despite rising refinery utilization at 94.6%, the broader inventory complex remains structurally tight.
On the demand side, the DOE’s ‘products supplied’ metric – a proxy for implied consumption – stayed strong. Total product demand averaged 21.2 million barrels per day over the last four weeks, up 2.5% YoY. Diesel and jet fuel were the standouts, up 7.7% and 1.7%, respectively, while gasoline demand softened slightly, down 1.1% YoY. The figures reflect a still-solid late-summer demand environment, particularly in industrial and freight-related sectors.


OPEC signalerar att de inte bryr sig om oljepriset faller kommande månader

Guldpriset kan närma sig 5000 USD om centralbankens oberoende skadas

Råvaror har nästan aldrig varit så här billiga

Världens största sandbatteri invigt i Finland

Gurkodling får 3 MW el-effekt i södra Sverige

Omgående mångmiljardfiasko för Equinors satsning på Ørsted och vindkraft

Meta bygger ett AI-datacenter på 5 GW och 2,25 GW gaskraftverk
What OPEC+ is doing, what it is saying and what we are hearing
Aker BP gör ett av Norges största oljefynd på ett decennium, stärker resurserna i Yggdrasilområdet
Brent sideways on sanctions and peace talks
-
 Nyheter4 veckor sedan
Omgående mångmiljardfiasko för Equinors satsning på Ørsted och vindkraft
-
 Nyheter2 veckor sedan
Meta bygger ett AI-datacenter på 5 GW och 2,25 GW gaskraftverk
-
Analys4 veckor sedan
What OPEC+ is doing, what it is saying and what we are hearing
-
 Nyheter3 veckor sedan
Aker BP gör ett av Norges största oljefynd på ett decennium, stärker resurserna i Yggdrasilområdet
-
Analys3 veckor sedan
Brent sideways on sanctions and peace talks
-

 Nyheter3 veckor sedan
Ett samtal om koppar, kaffe och spannmål
-
 Nyheter3 veckor sedan
Sommarens torka kan ge högre elpriser i höst
-
Analys2 veckor sedan
Brent edges higher as India–Russia oil trade draws U.S. ire and Powell takes the stage at Jackson Hole