Analys
Dollar Weakness Helps Gold To All-Time Highs

Gold Passes Two Important Sign-Posts

The gold bull market passed two important sign-posts in July. The strength of the market is impressive as it blew through $1,800 and the all-time high of $1,921. These prices had been major technical resistance points set a decade ago.
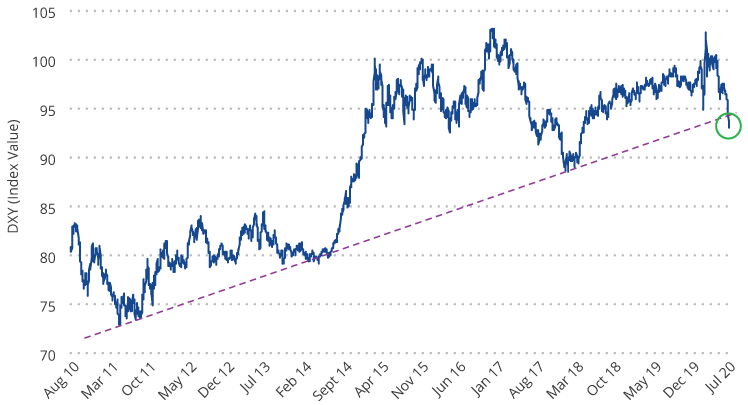
The second significant signpost in July was the new U.S. dollar weakness. U.S. dollar weakness is a hallmark of most gold bull markets, but in this cycle gold had so far been rising in a flat dollar environment. The chart below shows the U.S. dollar index (DXY)1 has been in a bull market since 2011. However, the dollar declined through July, then fell precipitously at the end of the month, appearing to have broken its long-term trend. We may be seeing the beginnings of a bear market for the dollar. This enabled gold to test the $2,000 per ounce milestone as it reached an intraday high of $1,983 on July 31. Gold closed out July at $1,975.86 per ounce for a $194.90 (10.9%) monthly gain.
U.S. Dollar Index Breaking Its Near 10-Year Support Trend (2011 to 2020)?

Gold Miners Remain Well Positioned (Especially Junior Developers)
Gold stocks moved higher as the vast majority of companies reporting second quarter results met or exceeded expectations. COVID-related costs were also reported, showing the industry has done an excellent job of dealing with operational issues in our view. For example, 1.7 million ounce producer Agnico-Eagle (approximately net assets of 4.7% as of end-July) was among those hardest hit by pandemic lock downs. Its costs for temporary mine suspensions totaled $22 million, whereas the cash provided from operations totaled $162 million. Going forward, per the company’s second quarter 2020 financial results, Agnico-Eagle expects COVID protocols to cost $6 per ounce, which raises their cash costs by less than 1%. For the month, the NYSE Gold Miners Index (GDMNTR)2 gained 14.4%, while the MVIS Global Junior Gold Miners Index (MVGDXJTR)3 advanced 19.8%.
Junior developers are a class of company that you won’t find much of in passive index funds. These are companies with properties that are in various stages of development, but not yet producing gold. Our active gold equity strategy invests across the spectrum of companies and currently carries 22 junior developers that total approximately 26% of the strategy’s net assets as of end-July. These companies had been underperforming since the gold price broke out in June 2019. This is a sharp contrast from past bull markets, when the juniors began outperforming the larger companies much earlier. Through the second quarter and into July, the junior developers have finally kicked into gear. Seven of our juniors have now gained over 100% year to date. We don’t expect to give back these gains because the stocks had been extremely undervalued and many of our companies have announced encouraging drill results and new discoveries that create lasting value. In addition, investors have returned to the junior sector, enabling companies to raise $1.5 billion this year, and the second quarter was their strongest for equity raises since 2012, according to RBC Capital Markets.
$2,000 Gold Is About More Than Just The Pandemic
Gold has tested the $2,000 per ounce level sooner than we had anticipated and we believe there is more than the pandemic to overcome at this point.
- Slower Recovery – During July, two Federal Reserve (Fed) presidents, a Fed governor, and its Chairman all warned of a long, slow road to economic recovery. Initial jobless claims have stagnated for eight weeks at around 1.4 to 1.5 million. Contrast this with the Global Financial Crisis (GFC), where initial jobless claims declined steadily to 587,000 in the same time frame, seventeen weeks after the recession peak. JPMorgan said it was preparing for an unemployment rate that remains in double digits well into next year and a slower recovery in gross domestic product (GDP) than the bank’s economists assumed three months ago.
- Deficits, Debt & Defaults – The U.S. budget deficit totaled $863 billion in June, as much as the entire gap in 2019. With the new stimulus bill now being considered in Congress, the annual deficit could exceed $4.7 trillion. This is on top of record peace-time deficits before the pandemic.
Corporate debt is also at record levels and many households are feeling financial stress. Ultra low interest rates over the past two decades have encouraged the accumulation of unproductive government and private debt. It fuels the rise of giant firms, while “zombie” companies (companies with earnings less than their debt service costs) have proliferated. This is at the expense of start-ups, innovation and creative destruction. The result is low levels of productivity, causing recoveries to become weaker and weaker. The Wall Street Journal reports the largest U.S. banks have set aside $28 billion to cover losses as consumers and businesses start to default on their loans.
What Could Drive Gold Prices Even Higher?
The pandemic created a deflationary shock to the economy and the massive accumulation of debt since the GFC creates a drag on productivity that could guarantee a low growth economy for decades to come. Negative real rates, persistent risks to economic well-being, and the weak dollar are drivers that we believe could enable gold to trend to $3,400 per ounce in the coming years. This might be a conservative forecast considering the 180% rise gold experienced from the depths of the GFC. Several scenarios could see gold prices moving higher from there:
- Systemic collapse as debt issuance overwhelms the financial markets.
- An inflationary cycle brought on by either: a) trillions of U.S. dollars, euros, yen and yuan being pumped into the global financial system, b) governments enabling inflation to ease the debt burden, c) implementation of modern monetary theory or other forms of money printing to fund government spending without issuing debt.
- U.S. Dollar Crisis – America is dealing with deficits, divisive politics, social unrest and deteriorating international relations on a scale rarely seen in history. While other countries may have similar problems, they do not oversee the world’s reserve currency. The U.S. is held to a higher standard and a crisis of confidence could weigh heavily on the dollar.
Some might balk at such bold forecasts, however, we believe the various drivers of gold are rarely aligned as they are today. We also consider gold’s relative size in the financial markets. There have been 200,000 tonnes of gold mined in the history of the world and virtually all of it is potentially available to the market. A gold price of $2,000 per ounce yields a market value of $12.9 trillion. Compare this with global stock, bond and currency markets, each of which totals roughly $100 trillion or more. A relatively small shift in funds from these markets may fuel the gold price for a long time.
In addition, the market value of the global gold industry as of end-July is approximately $530 billion. The market value of Alphabet Inc. as of the same time, alone, is $1.0 trillion. Gold mining is a relatively tiny sector that, in addition to carrying earnings leverage to the gold price, carries a scarcity factor when market demand is high.
1U.S. Dollar Index (DXY) indicates the general international value of the U.S. dollar by averaging the exchange rates between the U.S. dollar and six major world currencies.
2NYSE Arca Gold Miners Index (GDMNTR) is a modified market capitalization-weighted index comprised of publicly traded companies involved primarily in the mining for gold.
3MVIS Global Junior Gold Miners Index (MVGDXJTR) is a rules-based, modified market capitalization-weighted, float-adjusted index comprised of a global universe of publicly traded small- and medium-capitalization companies that generate at least 50% of their revenues from gold and/or silver mining, hold real property that has the potential to produce at least 50% of the company’s revenue from gold or silver mining when developed, or primarily invest in gold or silver.
Joe Foster, Portfolio Manager/Strategist, VanEck
This commentary originates from VanEck Investments Ltd, a UCITS Management Company under Irish law regulated by the Central Bank of Ireland and VanEck Asset Management B.V., a UCITS Management Company under Dutch law regulated by the Netherlands Authority for the Financial Markets. It is intended only to provide general and preliminary information to investors and shall not be construed as investment, legal or tax advice. VanEck Investments Ltd, VanEck Asset Management B.V. and its associated and affiliated companies (together “VanEck”) assume no liability with regards to any investment, divestment or retention decision taken by the investor on the basis of this commentary. The views and opinions expressed are those of the author(s) but not necessarily those of VanEck. Opinions are current as of the commentary’s publication date and are subject to change with market conditions. Certain statements contained herein may constitute projections, forecasts and other forward looking statements, which do not reflect actual results. Information provided by third party sources are believed to be reliable and have not been independently verified for accuracy or completeness and cannot be guaranteed. All indices mentioned are measures of common market sectors and performance. It is not possible to invest directly in an index.
All performance information is historical and is no guarantee of future results. Investing is subject to risk, including the possible loss of principal. You must read the Prospectus and KIID before investing in a fund.
No part of this material may be reproduced in any form, or referred to in any other publication, without express written permission of VanEck.