

Analys
The cutters should utilize seasonal strong demand in H2-18 to wind down cuts

 Headlines this morning gives the impression that all are now on-board for extending the cuts to the end of 2018. Reading in more detail however shows that it is not at all yet a done deal. And in addition it does not say whether the cuts will be maintained at current level all to the end of 2018. Specifically it seems like there is going to be an option to review and revise strategy at the next meeting in June. I.e. “maintain cuts if needed, but only if needed”. Russian producers are deeply concerned about the end-game. How to wind down the cuts without risking to crash the oil price. As such a sensible outcome in our eyes would be to wind down the cuts gradually through seasonal demand strength in H2-18. The cutters probably do not want to surprise the market positively risking firing up the oil price yet more at the same time as Rystad Energy is calling US crude oil production to hit 9.9 mb/d end of 2017 while also the US oil rig count has started to rise.
We have seen great reluctance from the Russian side in the run-up to this meeting and decision. Key has been the ”independent” oil companies in Russia who are getting ready dispatch new green field projects in 2018 in addition to what they have been holding back this year. These companies are getting very eager to get these new projects into production as well as the side lined once.
These companies fear that unconditional promises of cuts to the end of 2018 will fire up the oil market yet more with yet more stimulus of US shale oil production thus making it difficult for them to get back into the market at the start of 2019 without risking crashing the oil price then.
Thus exit of cuts has come into focus and has been a key point for Russian oil companies and thus the Russian delegation in Vienna.
I do not expect to see an unconditional extension of cuts to end of 2018 coming out of today’s meeting. A sensible outcome would be to keep current production cap through H1-18 and then ramp down the cuts through H2-18 during seasonally high demand in H2-18. And finally to have a touchdown in November 2018 assessing whether there is a need to trim production during seasonal weakness in H1-19.
This kind of outcome is probably less than what the market is hoping for and pricing in. Such an outcome would thus likely lead to some sell-off in the crude oil market.
Nonetheless in terms of appearance of price action ahead of the meeting the market seems extremely relaxed in terms of interpreting oil price action in the run-up to the meeting. I think the market is correctly assessing that OPEC/Non-OPEC is highly unlikely to throw away all what they have achieved over the past year (inventory draw down and a major shift from contango to backwardation, from spot price discount to spot price premium versus longer dated prices). However, it is probably wrong in assuming a full Christmas present with unconditional cuts to end of 2018.
Speculative net long crude oil positions in the market are currently at the second highest level in history. The fairly muted price action ahead of this meeting may thus be completely misguided in terms of possible price reaction to the outcome of this meeting in case the market is significantly disappointed by the outcome.
My expectation in terms of outcome of the meeting is thus that cuts are maintained during H1-18 and then gradually ramped down in H2-18 with a possible trimming during seasonal weakness in H1-19 if needed.
The message will be clear that they are NOT shifting from current strategy of “Price over volume” and back again to “Volume over price”. However, they are neither willing to drive the Brent crude oil price to the sky risking further strong acceleration of US shale oil production at the same time as OPEC/Non-OPEC cutters are holding back production. Yesterday’s news that US crude oil production is likely going to reach 9.9 mb/d by end of 2017 according to Rystad Energy’s estimates is a very clear message that OPEC/Non-OPEC cutters needs to tread carefully both when it comes to actual further cut extensions as well as how it communicates its plans and ambitions in terms of prices and goals.
As such the group should not really want to surprise the market positively today.
Rather it should want to give reassurance and confidence.
The perfect outcome for the group today would be if the oil price does not move at all.
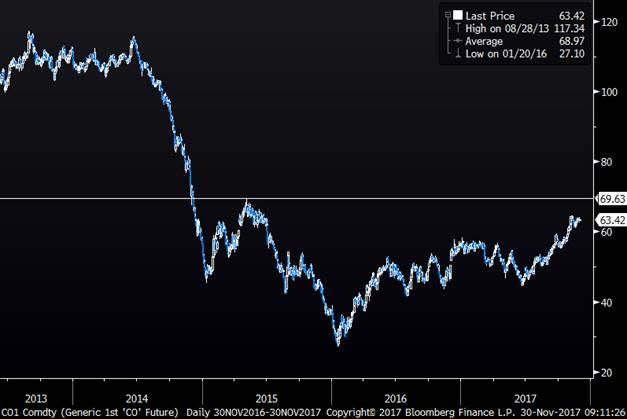
Ch1: “I want $69.63/b!”
Brent crude oil 1mth contract in USD/bl
But the market has gone in a one way street upwards since June.
Will we get there this time around or will we need a round of speculative re-set before heading for the $69.63/bl at a later stage?
Ch3: And speculators have positioned themselves accordingly. A sell-off ahead in the making?
Riding the upwards trend since June has been a good thing adding more and more length on the way upwards
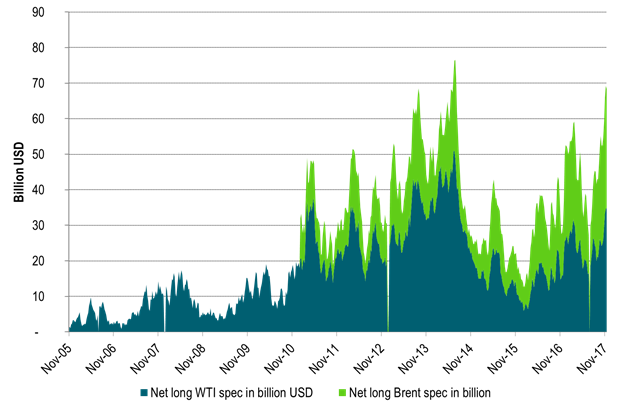
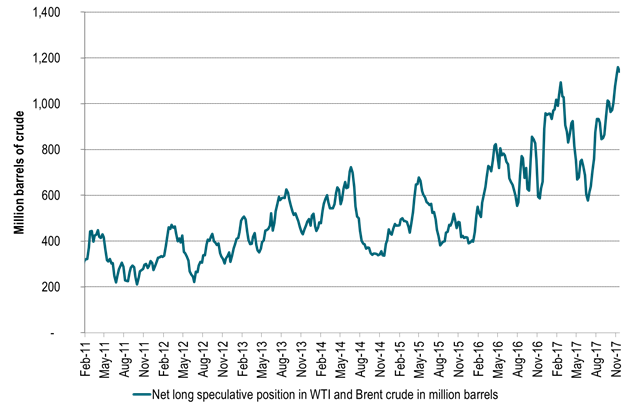
Ch4: Record high net long spec position (Brent + WTI) when counting contracts and barrels
Almost doubling since June!
There will be a reset at one point. Maybe today or maybe later
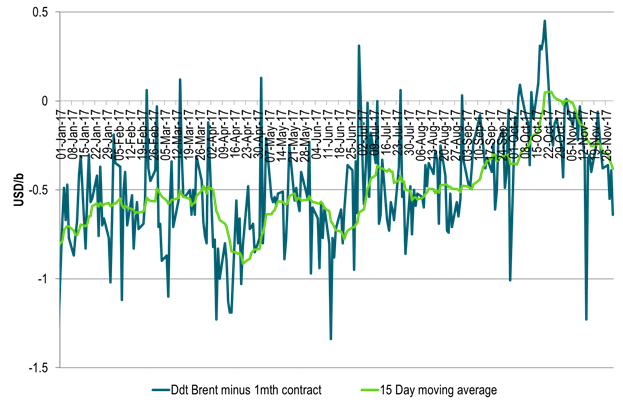
Ch5: Brent Dated crude oil price has started to weaken versus the Brent 1mth price signalling weakness in the physical Brent crude oil market
Should be trading on par if market is tight
Kind regards
Bjarne Schieldrop
Chief analyst, Commodities
SEB Markets
Merchant Banking
Brent crude has climbed roughly USD 1.5-2 per barrel since Friday, yet falling USD 0.3 per barrel this mornig and currently trading near USD 67.25/bbl after yesterday’s climb. While the rally reflects short-term geopolitical tension, price action has been choppy, and crude remains locked in a broader range – caught between supply-side pressure and spot resilience.

Prices have been supported by renewed Ukrainian drone strikes targeting Russian infrastructure. Over the weekend, falling debris triggered a fire at the 20mtpa Kirishi refinery, following last week’s attack on the key Primorsk terminal.
Argus estimates that these attacks have halted ish 300 kbl/d of Russian refining capacity in August and September. While the market impact is limited for now, the action signals Kyiv’s growing willingness to disrupt oil flows – supporting a soft geopolitical floor under prices.
The political environment is shifting: the EU is reportedly considering sanctions on Indian and Chinese firms facilitating Russian crude flows, while the U.S. has so far held back – despite Bessent warning that any action from Washington depends on broader European participation. Senator Graham has also publicly criticized NATO members like Slovakia and Hungary for continuing Russian oil imports.
It’s worth noting that China and India remain the two largest buyers of Russian barrels since the invasion of Ukraine. While New Delhi has been hit with 50% secondary tariffs, Beijing has been spared so far.
Still, the broader supply/demand balance leans bearish. Futures markets reflect this: Brent’s prompt spread (gauge of near-term tightness) has narrowed to the current USD 0.42/bl, down from USD 0.96/bl two months ago, pointing to weakening backwardation.
This aligns with expectations for a record surplus in 2026, largely driven by the faster-than-anticipated return of OPEC+ barrels to market. OPEC+ is gathering in Vienna this week to begin revising member production capacity estimates – setting the stage for new output baselines from 2027. The group aims to agree on how to define “maximum sustainable capacity,” with a proposal expected by year-end.
While the IEA pegs OPEC+ capacity at 47.9 million barrels per day, actual output in August was only 42.4 million barrels per day. Disagreements over data and quota fairness (especially from Iraq and Nigeria) have already delayed this process. Angola even quit the group last year after being assigned a lower target than expected. It also remains unclear whether Russia and Iraq can regain earlier output levels due to infrastructure constraints.
Also, macro remains another key driver this week. A 25bp Fed rate cut is widely expected tomorrow (Wednesday), and commodities in general could benefit a potential cut.
Summing up: Brent crude continues to drift sideways, finding near-term support from geopolitics and refining strength. But with surplus building and market structure softening, the upside may remain capped.
Brent crude is essentially flat on the week, but after a volatile ride. Prices started Monday near USD 65.5/bl, climbed steadily to a mid-week high of USD 67.8/bl on Wednesday evening, before falling sharply – losing about USD 2/bl during Thursday’s session.
Brent is currently trading around USD 65.8/bl, right back where it began. The volatility reflects the market’s ongoing struggle to balance growing surplus risks against persistent geopolitical uncertainty and resilient refined product margins. Thursday’s slide snapped a three-day rally and came largely in response to a string of bearish signals, most notably from the IEA’s updated short-term outlook.
The IEA now projects record global oversupply in 2026, reinforcing concerns flagged earlier by the U.S. EIA, which already sees inventories building this quarter. The forecast comes just days after OPEC+ confirmed it will continue returning idle barrels to the market in October – albeit at a slower pace of +137,000 bl/d. While modest, the move underscores a steady push to reclaim market share and adds to supply-side pressure into year-end.
Thursday’s price drop also followed geopolitical incidences: Israeli airstrikes reportedly targeted Hamas leadership in Doha, while Russian drones crossed into Polish airspace – events that initially sent crude higher as traders covered short positions.
Yet, sentiment remains broadly cautious. Strong refining margins and low inventories at key pricing hubs like Europe continue to support the downside. Chinese stockpiling of discounted Russian barrels and tightness in refined product markets – especially diesel – are also lending support.
On the demand side, the IEA revised up its 2025 global demand growth forecast by 60,000 bl/d to 740,000 bl/d YoY, while leaving 2026 unchanged at 698,000 bl/d. Interestingly, the agency also signaled that its next long-term report could show global oil demand rising through 2050.
Meanwhile, OPEC offered a contrasting view in its latest Monthly Oil Market Report, maintaining expectations for a supply deficit both this year and next, even as its members raise output. The group kept its demand growth estimates for 2025 and 2026 unchanged at 1.29 million bl/d and 1.38 million bl/d, respectively.
We continue to watch whether the bearish supply outlook will outweigh geopolitical risk, and if Brent can continue to find support above USD 65/bl – a level increasingly seen as a soft floor for OPEC+ policy.
Brent crude makes some gains as Israel’s attack on Hamas in Qatar rattles markets. Brent crude spiked to a high of USD 67.38/b yesterday as Israel made a strike on Hamas in Qatar. But it wasn’t able to hold on to that level and only closed up 0.6% in the end at USD 66.39/b. This morning it is starting on the up with a gain of 0.9% at USD 67/b. Still rattled by Israel’s attack on Hamas in Qatar yesterday. Brent is getting some help on the margin this morning with Asian equities higher and copper gaining half a percent. But the dark cloud of surplus ahead is nonetheless hanging over the market with Brent trading two dollar lower than last Tuesday.

Geopolitical risk premiums in oil rarely lasts long unless actual supply disruption kicks in. While Israel’s attack on Hamas in Qatar is shocking, the geopolitical risk lifting crude oil yesterday and this morning is unlikely to last very long as such geopolitical risk premiums usually do not last long unless real disruption kicks in.
US API data yesterday indicated a US crude and product stock build last week of 3.1 mb. The US API last evening released partial US oil inventory data indicating that US crude stocks rose 1.3 mb and middle distillates rose 1.5 mb while gasoline rose 0.3 mb. In total a bit more than 3 mb increase. US crude and product stocks usually rise around 1 mb per week this time of year. So US commercial crude and product stock rose 2 mb over the past week adjusted for the seasonal norm. Official and complete data are due today at 16:30.
A 2 mb/week seasonally adj. US stock build implies a 1 – 1.4 mb/d global surplus if it is persistent. Assume that if the global oil market is running a surplus then some 20% to 30% of that surplus ends up in US commercial inventories. A 2 mb seasonally adjusted inventory build equals 286 kb/d. Divide by 0.2 to 0.3 and we get an implied global surplus of 950 kb/d to 1430 kb/d. A 2 mb/week seasonally adjusted build in US oil inventories is close to noise unless it is a persistent pattern every week.
US IEA STEO oil report: Robust surplus ahead and Brent averaging USD 51/b in 2026. The US EIA yesterday released its monthly STEO oil report. It projected a large and persistent surplus ahead. It estimates a global surplus of 2.2 m/d from September to December this year. A 2.4 mb/d surplus in Q1-26 and an average surplus for 2026 of 1.6 mb/d resulting in an average Brent crude oil price of USD 51/b next year. And that includes an assumption where OPEC crude oil production only averages 27.8 mb/d in 2026 versus 27.0 mb/d in 2024 and 28.6 mb/d in August.
Brent will feel the bear-pressure once US/OECD stocks starts visible build. In the meanwhile the oil market sits waiting for this projected surplus to materialize in US and OECD inventories. Once they visibly starts to build on a consistent basis, then Brent crude will likely quickly lose altitude. And unless some unforeseen supply disruption kicks in, it is bound to happen.
US IEA STEO September report. In total not much different than it was in January

US IEA STEO September report. US crude oil production contracting in 2026, but NGLs still growing. Close to zero net liquids growth in total.


Tyskland har så höga elpriser att företag inte har råd att använda elektricitet
Brent crude ticks higher on tension, but market structure stays soft

Kinas elproduktion slog nytt rekord i augusti, vilket även kolkraft gjorde

Det stigande guldpriset en utmaning för smyckesköpare

Aktier i guldbolag laggar priset på guld

Meta bygger ett AI-datacenter på 5 GW och 2,25 GW gaskraftverk
Aker BP gör ett av Norges största oljefynd på ett decennium, stärker resurserna i Yggdrasilområdet

Ett samtal om koppar, kaffe och spannmål
Brent sideways on sanctions and peace talks
Sommarens torka kan ge högre elpriser i höst
-
 Nyheter4 veckor sedan
Meta bygger ett AI-datacenter på 5 GW och 2,25 GW gaskraftverk
-
 Nyheter4 veckor sedan
Aker BP gör ett av Norges största oljefynd på ett decennium, stärker resurserna i Yggdrasilområdet
-
 Nyheter4 veckor sedan
Ett samtal om koppar, kaffe och spannmål
-
Analys4 veckor sedan
Brent sideways on sanctions and peace talks
-
 Nyheter4 veckor sedan
Sommarens torka kan ge högre elpriser i höst
-
Analys4 veckor sedan
Brent edges higher as India–Russia oil trade draws U.S. ire and Powell takes the stage at Jackson Hole
-

 Nyheter3 veckor sedan
Mahvie Minerals är verksamt i guldrikt område i Finland
-
Analys3 veckor sedan
Increasing risk that OPEC+ will unwind the last 1.65 mb/d of cuts when they meet on 7 September