

Analys
Buying EUAs on the cheap will likely be one of the great opportunities of 2024

There are certainly bearish forces at work in the EUA market currently. Spot-wise, yes, but current forward price curve dynamics also creates a bearish pressure. Not the least from the utility side which normally is the big forward buyer of EUAs. They can now buy back previous forward hedges which where they locked in positive forward power margins. The can now instead reverse these which means that they instead of buying EUAs forward will sell EUAs forward.


That said, the MSR mechanism in the EUA market basically ensures that any surplus EUA above 833 million ton in the TNAC (Total Number of Allowances in Circulation) is wiped out within 2-3 years. The medium term EUA market fundamentals in 2026/27 and beyond is thus mostly untouched of what is going on right now. Forward 2026/27 and onward fundamentals are thus still as strong as they were previously which calls for a minimum price of EUR 100/ton or more by that time-horizon.
The question is what will be the catalyst which will turn this around to bullish price action instead of current bearish price action. A return to positive, forward clean dark and clean spark spreads is one. Economic revival in Europe as nat gas prices now have come down almost to the real average gas price level from 2010 to 2019 is another. Strong buying from shipping as they have no free allocations on their hands and will need every single EUA they buy in the years to come. But also industry will need increasingly more EUAs in the years to come and could utilize the current slump in EUA prices. Investors could also dive in at price levels seen ”too low” versus medium-term fundamental prices. Though hedge funds rarely have time to wait 2-3 years for a revival. But at some point the difference between the EUA spot price and what is considered a fair EUA price level (given politics and forward EUA fundamentals) become too big and too tempting to resist for both speculators and users of EUAs
Every year has unique opportunities in different types of assets, equities, currencies etc. We think that one of the great opportunities in 2024 when looked upon in hindsight, will be cheap EUAs. Thus those in need for EUAs in the years ahead should bid their time and pay attention to the opportunity currently playing out in the EU carbon market.
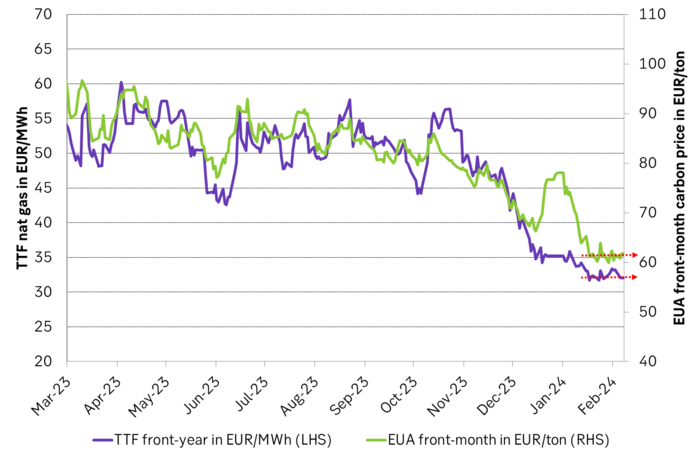
Since 17 January the front-month EUA price has ranged between an intraday low of EUR 59.12/ton and an intraday high of EUR 64.05/ton and with an average of closes of EUR 61.4/ton. The stabilization in the EUA price seems strongly related to the price development in the front-year TTF nat gas price which has stabilized at around EUR 32/MWh during the exact same period following a sharp price decline since early October last year.
The front-year TTF nat gas contract has stabilized at around EUR 32/MWh and the average year 2025 EUA price has stabilized for now around EUR 61/ton.
But the EUA price may have halted around the EUR 60/ton mark for other reasons as well. One is that when politicians tightened up the EUA market with backloading (2014) and MSR (2019) the EUA price rallied on its own merits and ahead of the Coal-to-Gas differentials all the way up to EUR 60/ton in 2021. In September 2021 however the C-t-G differentials (implied price of EUAs by marginal power market dynamics in an EUA market which is not too tight and not too loose) rallied ahead and above the EUA price due to the rally in nat gas prices. This then helped to drive the EUA price yet higher. The EUA price is now however back down at the crossover price of EUR 60/ton from September 2021 at which the EUA price previously was able to reach on its own merits (political tightening).
The average EUA front-year price in EUR/ton vs. the implied front-year C-t-G differential with 41% efficient coal and 54% efficient nat gas. The difference between the efficiency of 41% to 54% is not much different than the often used 36% vs 49%.
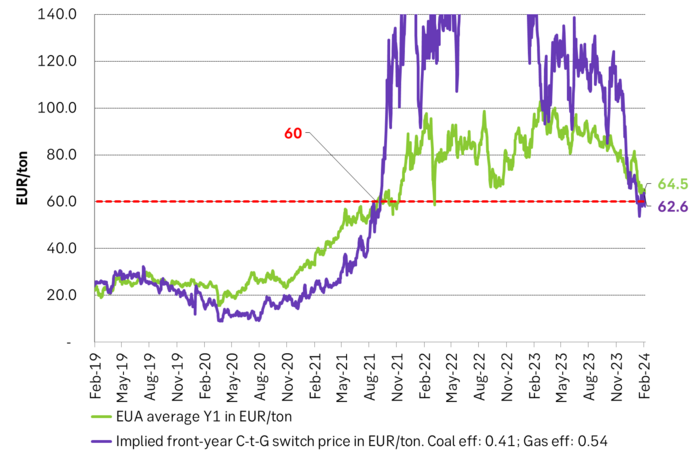
The EUA price also seems to follow the front-year C-t-G differentials quite closely while the discrepancies widen out further out on the curve. Thus a further sharp decline in the front-year TTF nat gas price is probably needed dynamically to drive the EUA price yet lower.
The EUA price seems to be anchored to the front-year TTF nat gas price as well as the front-year Coal-to-Gas differentials. But further out on the curve the latter widens out. Either because of increasing market tightness or simply due to curve structures. There are no support from C-t-G differentials in the current forward curves for 2026 and 2027.
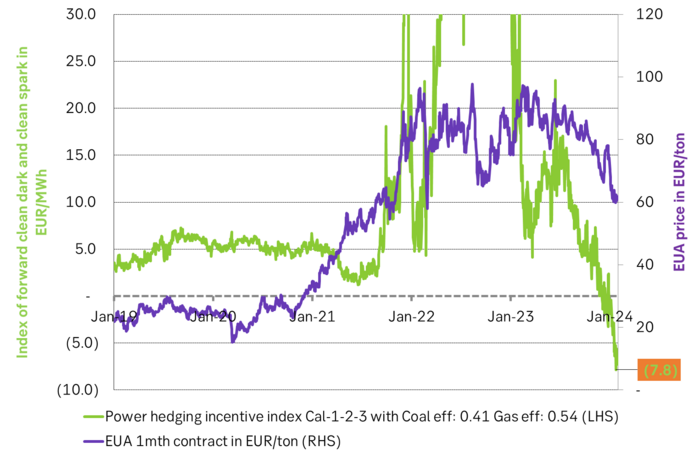
A serious element of weakness in the EUA market currently is that current forward clean power margins are negative. I.e. there is likely very limited amount of forward hedging by utilities as it doesn’t make sense for utilities to lock-in negative forward margins. Utilities are normally a large source of forward buying of EUAs and now there is probably close to nothing. And maybe even the opposite: Utilities may reverse previously entered hedges where they locked in forward positive margins and now instead can buy them back at favorable negative levels.
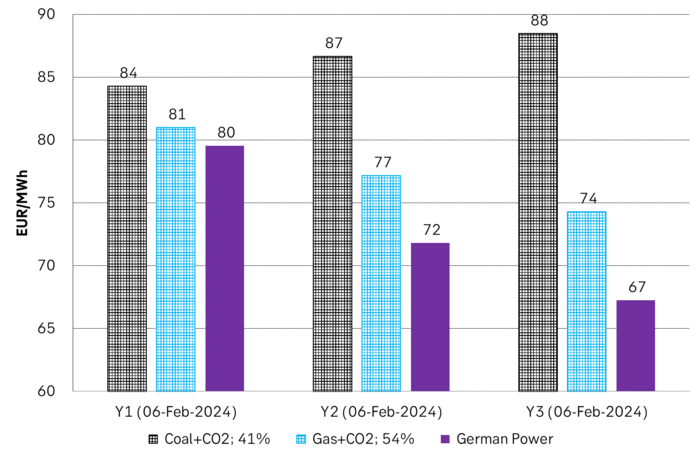
On a forward basis it costs more to produce power with Coal+CO2 or Gas+CO2 than it is possible to sell the power at on a forward basis.
The following graph shows a ”utility hedging incentive index” which when positive indicates positive, clean forward coal and gas power margins with a weighting of 75%, 50% and 25% on the nearest Yr1, Yr2 and Yr3. Very strong and positive forward power margins since Jan 2019. The index crossed below the EUR 5/MWh margin October last year and now sits at a massive negative EUR 7.8/MWh at which Utilities are incentivised to revers their previous hedges and buy back previously sold power and then sell coal, gas and EUAs.
The EUA price vs. SEB’s Utility forward hedging incentive index. Now very negative. Potentially feeds EUA sales into the market from the Utility side.
There are thus certainly bearish forces at work in the EUA market currently. Both spot-wise but also current forward price curve dynamics creates a bearish pressure. Not the least from the utility side which normally is the big forward buyer of EUAs.
That said, the MSR mechanism in the EUA market basically ensures that any surplus EUA above 833 million ton in the TNAC (Total Number of Allowances in Circulation) is wiped out within 2-3 years. The medium term EUA market fundamentals in 2026/27 are thus mostly untouched of what is going on right now. Forward 2026/27 and onward fundamentals are thus still as strong as they were previously which calls for a minimum price of EUR 100/ton or more by that time-horizon.
The question is what will be the catalyst which will turn this around to bullish price action. Positive, forward clean dark and clean spark spreads is one. Economic revival in Europe as nat gas prices now have come down almost to the real average gas price level from 2010 to 2019. Strong buying from shipping as they have no free allocations on their hands and will need every single EUA the buy in the years to come. But also industry will need increasingly more EUAs in the years to come. Investors could also dive in at price levels seen ”too low” versus medium-term fundamental prices. Though hedge funds rarely have time to wait 2-3 years for a revival. But at some point the difference between the EUA spot price and what is considered a fair EUA price level (given politics and forward EUA fundamentals) become too big and too tempting to resist for both speculators and users of EUAs
Rebounding along with most markets. But concerns over solidity of Gaza peace may also contribute. Brent crude fell 0.8% yesterday to $61.91/b and its lowest close since May this year. This morning it is bouncing up 0.9% to $62.5/b along with a softer USD amid positive sentiment with both equities and industrial metals moving higher. Concerns that the peace in Gaza may be less solid than what one might hope for also yields some support to Brent. Bets on tech stocks are rebounding, defying fears of trade war. Money moving back into markets. Gold continues upwards its strong trend and a softer dollar helps it higher today as well.
US crude & products probably rose 5.6 mb last week (API) versus a normal seasonal decline of 2.4 mb. The US API last night partial and thus indicative data for US oil inventories. Their data indicates that US crude stocks rose 7.4 mb last week, gasoline stocks rose 3.0 mb while Distillate stocks fell 4.8 mb. Altogether an increase in commercial crude and product stocks of 5.6 mb. Commercial US crude and product stocks normally decline by 2.4 mb this time of year. So seasonally adjusted the US inventories rose 8 mb last week according to the indicative numbers by the API. That is a lot. Also, the counter seasonal trend of rising stocks versus normally declining stocks this time of year looks on a solid pace of continuation. If the API is correct then total US crude and product stocks would stand 41 mb higher than one year ago and 6 mb higher than the 2015-19 average. And if we combine this with our knowledge of a sharp increase in production and exports by OPEC(+) and a large increase in oil at sea, then the current trend in US oil inventories looks set to continue. So higher stocks and lower crude oil prices until OPEC(+) switch to cuts. Actual US oil inventory data today at 18:00 CET.
US commercial crude and product stocks rising to 1293 mb in week 41 if last nights indicative numbers from API are correct.

Crude oil soon coming to a port near you. OPEC has lifted production sharply higher this autumn. At the same time demand for oil in the Middle-East has fallen as we have moved out of summer heat and crude oil burn for power for air-conditioning. The Middle-East oil producers have thus been able to lift exports higher on both accounts. Crude oil and condensates on water has shot up by 177 mb since mid-August. This oil is now on its way to ports around the world. And when they arrive, it will likely help to lift stocks onshore higher. That is probably when we will lose the last bit of front-end backwardation the the crude oil curves. That will help to drive the front-month Brent crude oil price down to the $60/b line and revisit the high $50ies/b. Then the eyes will be all back on OPEC+ when they meet in early November and then again in early December.
Crude oil and condensates at sea have moved straight up by 177 mb since mid-August as OPEC(+) has produced more, consumed less and exported more.

When it starts to move lower it moves rather quickly. Gaza, China, IEA. Brent crude is down 2.1% today to $62/b after having traded as high as $66.58/b last Thursday and above $70/b in late September. The sell-off follows the truce/peace in Gaze, a flareup in US-China trade and yet another bearish oil outlook from the IEA.
A lasting peace in Gaze could drive crude oil at sea to onshore stocks. A lasting peace in Gaza would probably calm down the Houthis and thus allow more normal shipments of crude oil to sail through the Suez Canal, the Red Sea and out through the Bab-el-Mandeb Strait. Crude oil at sea has risen from 48 mb in April to now 91 mb versus a pre-Covid normal of about 50-60 mb. The rise to 91 mb is probably the result of crude sailing around Africa to be shot to pieces by the Houthis. If sailings were to normalize through the Suez Canal, then it could free up some 40 mb in transit at sea moving onshore into stocks.
The US-China trade conflict is of course bearish for demand if it continues.
Bearish IEA yet again. Getting closer to 2026. Credibility rises. We expect OPEC to cut end of 2025. The bearish monthly report from the IEA is what it is, but the closer we get to 2026, the more likely the IEA is of being ball-park right in its outlook. In its monthly report today the IEA estimates that the need for crude oil from OPEC in 2026 will be 25.4 mb/d versus production by the group in September of 29.1 mb/d. The group thus needs to do some serious cutting at the end of 2025 if it wants to keep the market balanced and avoid inventories from skyrocketing. Given that IEA is correct that is. We do however expect OPEC to implement cuts to avoid a large increase in inventories in Q1-26. The group will probably revert to cuts either at its early December meeting when they discuss production for January or in early January when they discuss production for February. The oil price will likely head yet lower until the group reverts to cuts.
Dubai: The Mid-East anchor dragging crude oil lower. Surplus emerging in Mid-East pricing. Crude oil prices held surprisingly strong all through the summer. A sign and a key source of that strength came from the strength in the front-end backwardation of the Dubai crude oil curve. It held out strong from mid-June and all until late September with an average 1-3mth time-spread premium of $1.8/b from mid-June to end of September. The 1-3mth time-spreads for Brent and WTI however were in steady deterioration from late June while their flat prices probably were held up by the strength coming from the Persian Gulf. Then in late September the strength in the Dubai curve suddenly collapsed. Since the start of October it has been weaker than both the Brent and the WTI curves. The Dubai 1-3mth time-spread now only stands at $0.25/b. The Middle East is now exporting more as it is producing more and also consuming less following elevated summer crude burn for power (Aircon) etc.
The only bear-element missing is a sudden and solid rise in OECD stocks. The only thing that is missing for the bear-case everyone have been waiting for is a solid, visible rise in OECD stocks in general and US oil stocks specifically. So watch out for US API indications tomorrow and official US oil inventories on Thursday.
No sign of any kind of fire-sale of oil from Saudi Arabia yet. To what we can see, Saudi Arabia is not at all struggling to sell its oil. It only lowered its Official Selling Prices (OSPs) to Asia marginally for November. A surplus market + Saudi determination to sell its oil to the market would normally lead to a sharp lowering of Saudi OSPs to Asia. Not yet at least and not for November.
The 5yr contract close to fixed at $68/b. Of importance with respect to how far down oil can/will go. When the oil market moves into a surplus then the spot price starts to trade in a large discount to the 5yr contract. Typically $10-15/b below the 5yr contract on average in bear-years (2009, 2015, 2016, 2020). But the 5yr contract is usually pulled lower as well thus making this approach a moving target. But the 5yr contract price has now been rock solidly been pegged to $68/b since 2022. And in the 2022 bull-year (Brent spot average $99/b), the 5yr contract only went to $72/b on average. If we assume that the same goes for the downside and that 2026 is a bear-year then the 5yr goes to $64/b while the spot is trading at a $10-15/b discount to that. That would imply an average spot price next year of $49-54/b. But that is if OPEC doesn’t revert to cuts and instead keeps production flowing. We think OPEC(+) will trim/cut production as needed into 2026 to prevent a huge build-up in global oil stocks and a crash in prices. But for now we are still heading lower. Into the $50ies/b.
Some rebound but not much. Brent crude rebounded 1.5% yesterday to $65.47/b. This morning it is inching 0.2% up to $65.6/b. The lowest close last week was on Thursday at $64.11/b.
The curve structure is almost as week as it was before the weekend. The rebound we now have gotten post the message from OPEC+ over the weekend is to a large degree a rebound along the curve rather than much strengthening at the front-end of the curve. That part of the curve structure is almost as weak as it was last Thursday.
We are still on a weakening path. The message from OPEC+ over the weekend was we are still on a weakening path with rising supply from the group. It is just not as rapidly weakening as was feared ahead of the weekend when a quota hike of 500 kb/d/mth for November was discussed.
The Brent curve is on its way to full contango with Brent dipping into the $50ies/b. Thus the ongoing weakening we have had in the crude curve since the start of the year, and especially since early June, will continue until the Brent crude oil forward curve is in full contango along with visibly rising US and OECD oil inventories. The front-month Brent contract will then flip down towards the $60/b-line and below into the $50ies/b.
At what point will OPEC+ turn to cuts? The big question then becomes: When will OPEC+ turn around to make some cuts? At what (price) point will they choose to stabilize the market? Because for sure they will. Higher oil inventories, some more shedding of drilling rigs in US shale and Brent into the 50ies somewhere is probably where the group will step in.
There is nothing we have seen from the group so far which indicates that they will close their eyes, let the world drown in oil and the oil price crash to $40/b or below.
The message from OPEC+ is also about balance and stability. The world won’t drown in oil in 2026. The message from the group as far as we manage to interpret it is twofold: 1) Taking back market share which requires a lower price for non-OPEC+ to back off a bit, and 2) Oil market stability and balance. It is not just about 1. Thus fretting about how we are all going to drown in oil in 2026 is totally off the mark by just focusing on point 1.
When to buy cal 2026? Before Christmas when Brent hits $55/b and before OPEC+ holds its last meeting of the year which is likely to be in early December.
Brent crude oil prices have rebounded a bit along the forward curve. Not much strengthening in the structure of the curve. The front-end backwardation is not much stronger today than on its weakest level so far this year which was on Thursday last week.

The front-end backwardation fell to its weakest level so far this year on Thursday last week. A slight pickup yesterday and today, but still very close to the weakest year to date. More oil from OPEC+ in the coming months and softer demand and rising inventories. We are heading for yet softer levels.


Vad guldets uppgång egentligen betyder för världen

Spotpriset på guld över 4300 USD och silver över 54 USD
Crude oil soon coming to a port near you

Guld och silver stiger hela tiden mot nya höjder
The Mid-East anchor dragging crude oil lower

OPEC+ missar produktionsmål, stöder oljepriserna

Ett samtal om guld, olja, fjärrvärme och förnybar energi

Goldman Sachs höjer prognosen för guld, tror priset når 4900 USD

Blykalla och amerikanska Oklo inleder ett samarbete
Guld nära 4000 USD och silver 50 USD, därför kan de fortsätta stiga
-
 Nyheter3 veckor sedan
OPEC+ missar produktionsmål, stöder oljepriserna
-
 Nyheter4 veckor sedan
Ett samtal om guld, olja, fjärrvärme och förnybar energi
-
 Nyheter2 veckor sedan
Goldman Sachs höjer prognosen för guld, tror priset når 4900 USD
-
 Nyheter3 veckor sedan
Blykalla och amerikanska Oklo inleder ett samarbete
-
 Nyheter2 veckor sedan
Guld nära 4000 USD och silver 50 USD, därför kan de fortsätta stiga
-
Analys4 veckor sedan
Are Ukraine’s attacks on Russian energy infrastructure working?
-

 Nyheter4 veckor sedan
Guldpriset uppe på nya höjder, nu 3750 USD
-
Nyheter3 veckor sedan
Ett samtal om guld, olja, koppar och stål