

Analys
The EUA price could drop to EUR 40/ton and then be picked up by Airliners, Shipping and Utilities

The EUA price is dropping hard along with a sharp decline in the front-year TTF nat gas contract. The typical last-round sell-off in EUA prices have typically been a final sell-off of 10-20-30%. From EUR 60/ton level it implies a price decline down to EUR 54; 48; 42/ton. The front-year nat gas price and the front-year Coal-to-Gas (C-t-G) differential is what has held the EUA price above EUR 60/ton. But if the TTF 2025 price falls down to EUR 27/ton the front-year C-t-G differential will fall all the way towards EUR 40/ton. That TTF 2025 falls to EUR 27/ton or lower seems likely to happen and the risk is high that the EUA price will be sucked down along with it. But nat gas demand is starting to come back with a lag in nat gas price declines in the EU but probably also in Asia. Thus first an over-sell in nat gas prices, then demand revival and then a rebound in both nat gas prices and EUA prices. Airliners, shipping companies and Utilities will probably buy as much EUAs they can get if the EUA price fall down towards EUR 40/ton.

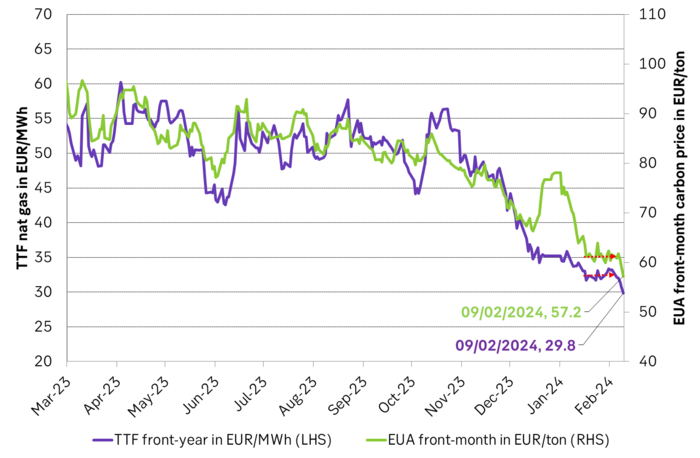
Front-year 2025 TTF nat gas price falls hard and so does the EUA price. The front-month EUA price dropped 2.7% yesterday to EUR 58.97/ton and thus broke out of the sideways trend around EUR 61/ton since 18 January. Today it has sold off another 3.2% to EUR 57.1/ton.
Again it is the nat gas price which is leading the way and more specifically it is about the front-year nat gas which lost 1.9% on Wednesday and another 2.5% again ydy to a close of EUR 30.65/MWh and today it has solf off 2.8% to EUR 29.8/ton.
The EUA price has very clearly been balancing on the front-year Coal-to-Gas (C-t-G) differentials. The C-t-G differentials have been significantly lower than EUR 60/ton both at the front-end of the curve (1-2-3 month) and for calendars 2026 and 2027. But the front-year nat gas price has held up at around EUR 31/MWh quite well since around mid January.
How far down will the EUA price go? The final sell-off could be down towards EUR 40/ton. With these dynamics the big question then becomes: How far down will the front-year nat gas contract sell? It will of course sell off too far as commodities always do. The reason commodities do this is the natural reactive chain of events which normally comes with a lag: First the price goes down before dropping hard in the final round of the sell-off. Then demand comes back with a lag to the price action. This again drives the price back up and off from the lows to a level consistent with the revival in demand. If demand instead had reacted immediately to lower prices then the hard drop at the end of the sell-off might not have happened.
Looking at previous hard, final sell-off-drops in the EUA price we can see that final drops typically have been 10-20-30% as the last final drop. If we take the EUR 60/ton as the starting point of this final drop, then we are talking an EUA price bottom of somewhere in the range of EUR 54; 48; 42/ton.
Global nat gas demand destruction in the face of very high nat gas prices solved the energy crisis. Let’s link this back to price action in nat gas. The reason why Europe has managed the recent energy crisis (Russia/Ukraine, nat gas,…) so surprisingly well is 1) Large reduction in nat gas demand in EU due to exceptionally high prices and 2) Significant demand destruction in Asia freeing up nat gas to flow to the EU. I.e. it was global demand destruction of nat gas in response to extremely high prices globally which solved the energy crisis. It was solved by the global market.
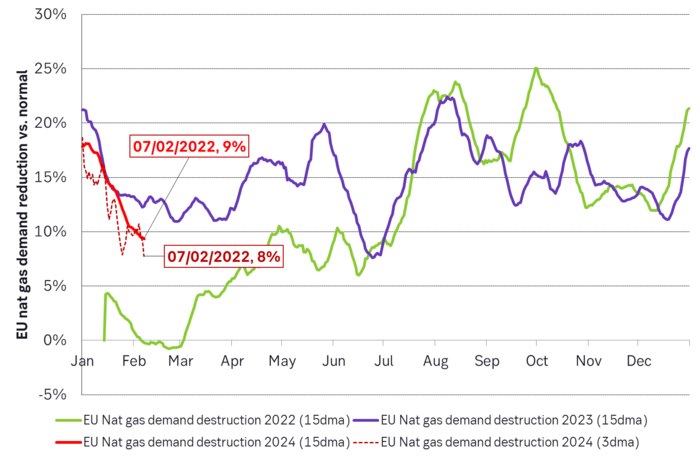
Demand for nat gas is starting to come back as the price falls. The nominal historical average nat gas TTF price was EUR 20/MWh from 2010 to 2019. But the real average was EUR 26/MWh. So seen from the eyes of consumers in both Europe and Asia, a price of EUR 26/MWh is an historically absolutely normal price. Demand for nat gas should thus naturally accelerate back towards normal levels at current nat gas prices. Not just in Europe, but also globally in all regions exposed to nat gas prices set by global LNG prices. This is already happening in the EU. Temp. adj. demand destruction vs. normal has typically been running at around 16% from mid-2022 to December 2023. Average ytd is 14% while the last 15 days is 9%. Demand destruction is fading as the price of nat gas is falling. But do remember that this is also happening in Asia but it is harder to track.
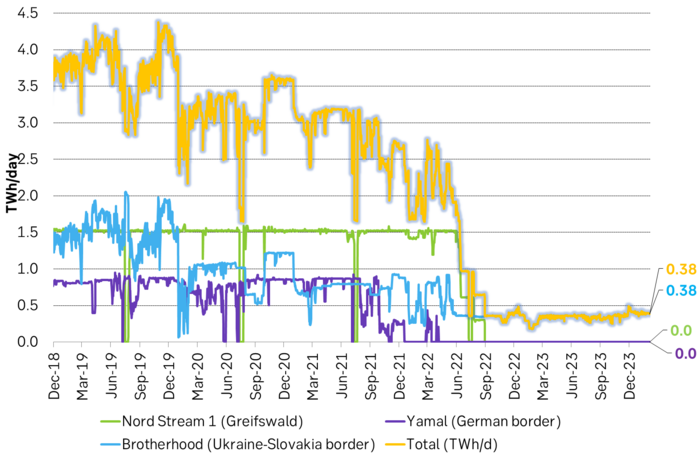
Normal nat gas demand AND normal gas prices is not consistent as Russian nat gas exports still down 1100 TWh/yr. There is however an inconsistency here in expecting normal prices and normal demand for natural gas now onward. The inconsistency is that the EU and thus the world is still robbed of the normal flow of nat gas on pipelines to Europe. This amounts to a loss of 3 TWh/day and thus close to 1100 TWh/year. When this gas is no longer flowing to the EU it isn’t flowing anywhere. It is lost to both the EU and the world. Until that is, Russia has built loads of new pipes to Asia and new LNG terminals. And that takes years.
A return to normal prices and normal demand while the world still is missing 1100 TWh/year of Russian nat gas isn’t really a consistent outcome in our view.
Demand for nat gas will continue to revive as the price of nat gas keeps falling. But both the EU and the world still need of a nat gas price at above normal levels to induce a certain amount of demand destruction until the point in time when new LNG export facilities globally has managed to replace the 1100 TWh/year we have lost from Russia.
Front-end TTF nat gas down to EUR 27/MWh could drive the EUA price to EUR 40/ton. The dynamic sell-off nat gas, prices will likely move lower than to the level which over time is consistent with continued need for some demand destruction globally. This because demand revival will come with a lag to the decline in prices. It is thus fully plausible that the TTF 2025 contract moves all the way down to EUR 27/MWh (or maybe even lower). If so it would imply a 2025 C-t-G differential of only EUR 40/ton for the EUA price to balance on and reference to. That could be the final hard drop in the EUA price. That’s a 30% drop from EUR 60/ton. But it won’t last because that nat gas price is likely too low vs. what is needed globally to maintain some level of demand destruction for a while longer.
An EUA price of EUR 40/ton would also be too cheap to resist for a range of market participants and they’d likely jump in and purchase with both hands. Airliners and shipping companies which will have difficulties of shifting away from fossil fuels and will need EUAs for years to come. Also utilities could step in and purchase large amounts of EUAs even if forward margins are negative. Some EU based utilities with large fossil-based assets bought truckloads of EUAs from 2011 to 2017 when the EUA price ranged from EUR 3/ton to EUR 9/ton. For them the EUA certificate is not only a marginal cost. It is also a licence to operate. The EUA price will of course not return to that level again. But if we move to EUR 40-50/ton, then it will probably trigger strategic buying by shipping companies, airliners as well as utilities.
Front-year TTF nat gas TTF price is dropping and leading the EUA price lower after a period of sideways action since mid-Jan
But the EU and the world is still missing some 3 TWh/d or 1100 TWh/yr of piped nat gas from Russia. When Russian nat gas is no longer flowing on pipes to Europe, it is flowing nowhere.
Nat gas demand destruction in the EU has been running at 15% to 17% since mid-2022 in the face of high nat gas prices. But demand destruction is now fading down to 8%. Demand has started to come back as nat gas prices fall. Demand is probably also coming back in Asia, but not so easily to see.
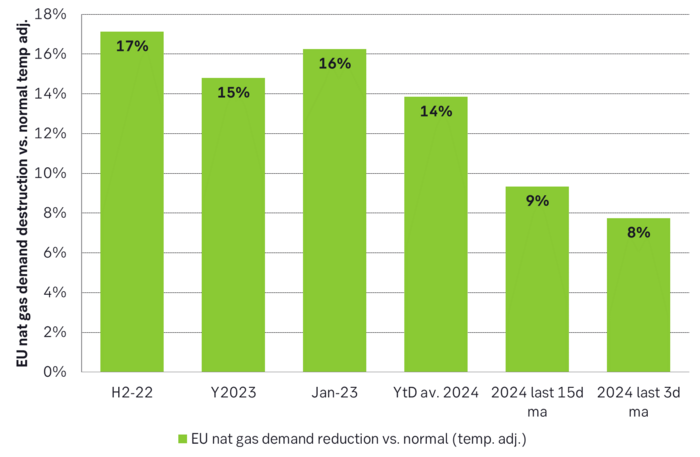
EU nat gas demand destruction has started to fade.
Forward Coal to Gas (C-t-G) differentials vs EUA market prices. The EUA price has balanced on the front-year differential. But that has now fallen like a rock along with the fall in front-year TTF nat gas price. Lead the EUA into a free-fall
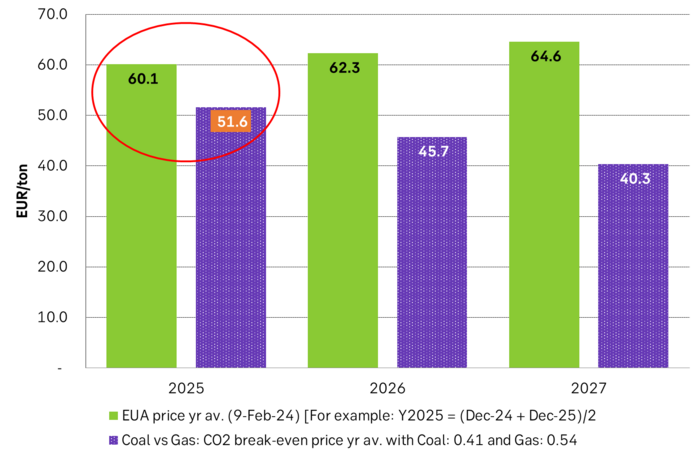
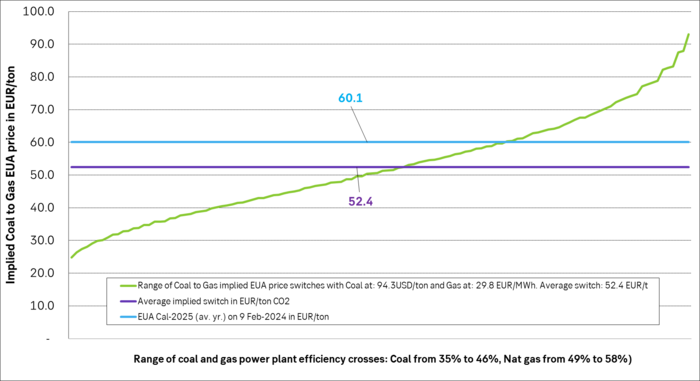
The front-year Coal-to-Gas differential is a distribution of crosses between many different levels of efficiencies for coal and nat gas power plants. Averages of these are EUR 52.4/ton with Coal at USD 94.3/ton and Nat gas at EUR 29.8/MWh (both front-year 2025 prices). So EUA price is still hanging high.
Market is starting to take US/Iran headlines with a pinch of salt. Brent crude rose $2.8/b yesterday to an official close of $112.1/b. But after that it traded as low as $108.05/b before ending late night at around $109.7/b. Through the day it traded in a range of $106.87 – 112.72/b amid a flurry of news or rumors from Iran and the US. ”US temporary sanctions during negotiations” (falls alarm). ”We will bomb Iran” (not anyhow),… etc. While the market is still fluctuating to this kind of news flow, it is starting to take such headlines with a pinch of salt.

We’ll see. Maybe, maybe not. The Brent M1 contract is trading at $110.2/b this morning which very close to the average ticks through yesterday of $110.4/b.
Trump with bearish, verbal intervention whenever Brent trades above $110/b it seems. What seems to be a pattern is that Trump states something like ”very good negotiations going on with Iran”, ”New leaders in Iran are great,..”, ”Great progress in negotiations,…”, ”Deal in sight,..” etc whenever the Brent M1 contract trades above $110/b. An effort to cool the market. These hot air verbal interventions from Trump used to have a heavy bearish impact on prices, but they now seems to have less and less effect unless they are backed by reality.
As far as we can see there has been no real progress in the negotiations between the US and Iran with both sides still standing by their previous demands.
Iran is getting stronger while the cease fire lasts making a return to war for Trump yet harder. Iran is naturally in constant preparation for a return to war given Trump’s steady threats of bombing Iran again. Iran is naturally doing what ever is possible to prepare for a return to war. And every day the cease fire lasts it is better prepared. This naturally makes it more and more difficult and dangerous for the US to return to warring activity versus Iran as the consequences for energy infrastructure in the Persian Gulf will be more and more severe the longer the cease fire lasts. Israel seems to see it this way as well. That the war is not won and that current frozen state of a cease fire gives Iran opportunity to rebuild military and politically.
Global inventories are drawing down day by day. How much? In the meantime the Strait of Hormuz stays closed. There is varying measures and estimates of how much global inventories are drawing down. Our rough estimate, back of the envelope, is that global inventories are drawing down by at least some 10 mb/d or about 300 mb/d in a balance between loss of supply versus demand destruction. Other estimates we see are a monthly draw of 250-270 mb/d. The IEA only ’measured’ a draw in global observable stocks of 117 mb in April with oil on water rising 53 mb while on shore stocks fell 170 mb. But global stocks are hard to measure with large invisible, unmeasured stocks. As such a back of the envelope approach may be better.
Oil products is what the world is consuming. Oil product prices likely to rise while product stocks fall. Strategic Petroleum Reserves (SPR) are predominantly crude oil. Discharging oil from OECD SPR stocks, a sharp reduction in Chinese crude imports and a reduction in global refinery throughput of 6-7 mb/d has helped to keep crude oil markets satisfactorily supplied. But global inventories are drawing down none the less. And oil products is really what the world is consuming. So if global refinery throughput stays subdued, then demand will eventually have to match the supply of oil products. The likely path forward this summer is a steady draw down in jet fuel, diesel and gasoline. Higher prices for these. Then, if possible, higher refinery throughput and higher usage of crude in response to very profitable refinery margins. And lastly sharper draw in crude stocks and higher prices for these. But some 6 mb/d of oil products used to be exported through the Strait of Hormuz. And it may not be so easy to ramp up refinery activity across the world to compensate. Especially as Ukraine continues to damage Russian refineries as well as Russian crude production and export facilities.
Watch oil product stocks and prices as well as Brent calendar 2027. What to watch for this summer is thus oil product inventories falling and oil product premiums to crude rising. Another measure to watch is the Brent crude 2027 contract as it rises steadily day by day as the Strait of Hormuz stays closed and global oil inventories decline. The latter is close to the highest level since the start of the war and keeps rising.
The Brent M1 contract and the Brent 2027 prices and current price of jet fuel in Europe (ARA). All in USD/b

Our back of the envelope calculation of the global shortage created by the closure of the Strait of Hormuz. Note that 3.5 mb/d of discharge from SPR is also a draw. Note also that ’Forced demand loss’ of 2.5 mb/d is probably temporary and will fall back towards zero as logistics are sorted out leaving ’Price demand loss’ to do the job of balancing the market. Thus a shortfall of at least 9 mb/d created by the closure. More if SPR discharge is included and more if Forced demand loss recedes.

Brent is climbing higher. Front-month is at USD 106.3/bl this morning, close to a weekly high and a USD 9/bl jump from Mondays open. This is the move we flagged as a risk earlier in the week: the market shifting from ”a deal is around the corner” to ”this is going to take longer than we thought”.

Analyst Commodities, SEB
During April, rest-of-year Brent remained remarkably stable around USD 90/bl. A stability which rested on one single assumption: the SoH reopens around 1 May. That assumption is now slowly falling apart.
As we highlighted yesterday: every week of delay beyond 1 May adds (theoretically) ish USD 5/bl to the rest-of-year average, as global inventories draw 100 million barrels per week. i.e., a mid-May reopening implies rest-of-year Brent closer to USD 100/bl, and anything pushing into June or July takes us meaningfully higher.
What’s changed in the last 48 hours:
#1: The US military has formally warned that clearing suspected sea mines from SoH could take up to six months. That is a completely different timescale from what the financial market is pricing. Even a political deal tomorrow does not immediately reopen the strait.
#2: Trump has shifted his tone from urgency to ”strategic patience”. In yesterday’s press conference: ”Don’t rush me… I want a great deal.” The market is reading this as a president no longer feeling pressured by timelines, with the naval blockade running in the background.
#3: So far, the military activity is escalating, not de-escalating. Axios reports Iran is laying more mines in SoH. The US 3rd carrier strike group (USS George H.W. Bush) is arriving with two countermine vessels. Trump yesterday ordered the US Navy to destroy any Iranian boats caught laying mines. While CNN reports that the Pentagon is actively drawing up plans to strike Iranian SoH capabilities and individual Iranian military leaders if the ceasefire collapses. i.e., NOT a attitude consistent with an imminent deal!
Spot crude and product prices eased off the early-April highs on a combination of system rerouting and deal optimism. Both now weakening. Goldman estimates April Gulf output is reduced by 14.5 mbl/d, or 57% of pre-war supply, a number that keeps getting worse the longer this drags on.
Demand-side adaptation is ongoing: S. Korea has cut its Middle East crude dependence from 69% to 56% by pulling more from the Americas and Africa, and Japan is kicking off a second round of SPR releases from 1 May. But SPRs are finite.
Ref. to the negotiations, we should not bet on speed. The current Iranian leadership is dominated by genuine hardliners willing to absorb economic pain and run the clock to extract concessions. That is not a setup for a rapid resolution. US/Israeli media briefings keep framing the delay as ”internal Iranian divisions”, the reality is more complicated and points toward weeks and months, not days.
Our point is that the complexity is large, and higher prices have only just started (given a scenario where the negotiations drag out in time). The market spent April leaning on the USD 90/bl rest-of-year assumption; that case is diminishing by the hour. If ”early May reopening” is replaced by ”June, July or later” over the next week or two, both crude and products have meaningful room to reprice higher from here. There is a high risk being short energy and betting on any immediate political resolution(!).
Down on Friday. Up on Monday. The Brent June crude oil contract traded down 5.1% last week to a close of $90.38/b. It reached a high of $103.87/b last Monday and a low of $86.09/b on Friday as Iran announced that the Strait of Hormuz was fully open for transit. That quickly changed over the weekend as the US upheld its blockade of Iranian oil exports while Iran naturally responded by closing the SoH again. The US blew a hole in the engine room of the Iranian ship TOUSKA and took custody of the ship on Sunday. Brent crude is up 5.6% this morning to $95.4/b.
The cease-fire is expiring tomorrow. The US has said it will send a delegation for a second round of negotiations in Islamabad in Pakistan. But Iran has for now rejected a second round of talks as it views US demands as unrealistic and excessive while the US is also blocking the Strait of Hormuz.
While Brent is up 5% this morning, the financial market is still very optimistic that progress will be made. That talks will continue and that the SoH will fully open by the start of May which is consistent with a rest-of-year average Brent crude oil price of around $90/b with the market now trading that balance at around $88/b.
Financial optimism vs. physical deterioration. We have a divergence where the financial market is trading negotiations, improvements and resolution while at the same time the physical market is deteriorating day by day. Physical oil flows remain constrained by disrupted flows, longer voyage times and elevated freight and insurance costs.
Financial markets are betting that a US/Iranian resolution will save us in time from violent shortages down the road. But every day that the SoH remains closed is bringing us closer to a potentially very painful point of shortages and much higher prices.
The US blockade is also a weapon of leverage against its European and Asian allies. When Iran closed the SoH it held the world economy as a hostage against the US. The US blockade of the SoH is of course blocking Iranian oil exports. But it is also an action of disruption directed towards Europe and Asia. The US has called for the rest of the world to engaged in the war with Iran: ”If you want oil from the Persian Gulf, then go and get it”. A risk is that the US plays brinkmanship with the global oil market directed towards its European and Asian allies and maybe even towards China to force them to engage and take part. Maybe unthinkable. But unthinkable has become the norm with Trump in the White House.


Sommarväder skapar prisrally på elbörsen
Oil product price pain is set to rise as the Strait of Hormuz stays closed into summer

Solkraften pressar elpriserna dagtid

Michel Gubel ger sin syn på oljemarknaden