

Analys
Brent crude is crawling higher but its feet are slipping

Price action – Marginal gains in the front but losses in the back end curve
 From Friday to Friday last week Brent 1mth crude gained 0.3% to $55.99/b. Longer dated contracts however continued to erode with the Brent December 2020 contract losing 1.1% to $54.84/b. In perspective it closed at the lowest level since April 2016 last week when it closed at $54.47/b last Wednesday. With muted price action the volatility naturally continued lower last week with 30 day rolling annualized volatility for the 1mth contract ending last week at 20.3% down from 25.1% Friday the week before. We have not seen such a low level of volatility since October 2014 and it is likely to continue yet lower. Probably heading to 15%. Shale oil flexibility clearly helps to mute the price action. In addition the market is now close to balance and lower volatility is natural in such a situation. However, the longer term normal volatility in the crude oil market is about 30%. Thus we are probably heading towards half of the historical normal level.
OPEC is tightening up the front end market but reviving US crude oil production is softening the medium term balance
 OPEC is delivering on cuts thus driving the market increasingly into backwardation. This is pushing front month contract higher versus longer dated contracts. However, longer dated contracts are slipping thus leaving the Brent 1mth contract with little gain despite a gradual shift to backwardation. There is still some contango in the very front of the forward curve but overall the Brent 1mth contract is now trading above the Brent Dec-2020 contract. At close on Friday we had Brent 1mth at 55.99/b and Dec-2020 at 54.84/b. Thus for Brent 1mth, it is trying to crawl higher but its feet are slipping. Longer dated contracts are slipping.
OPEC is tightening up the front, but recovering US shale production is loosening up the longer dated part of the balance. That is why the longer dated contracts are slipping. US crude production last week rose above 9 mb/d for the first time since April 2016. For lower 48 production (where shale is the lion’s share), production rose by 17 kb/d w/w. Multiply by 52 and you get an annualized US production growth rate of 0.9 mb/d YoY. I.e. US shale oil production growth is back! If the +17 kb/d w/w was only noise it would mean nothing, but it is a trend. Our projection is for US shale oil production to grow at 18 kb/d w/w in February, 23 kb/d w/w in March and then gradually rising to 36 kb/d w/w in September equaling an annualized production growth rate of 1.9 mb/d before the growth rate is moderating after that again.
Since October 2016 US crude production has on averaged increased by 27.6 kb/d w/w. Most of this is probably not due to recovering shale oil production but rather due to commissioning of prior investments in the Gulf of Mexico. However, now onwards US crude production is going to increase on a weekly basis due to recovering US shale oil production.
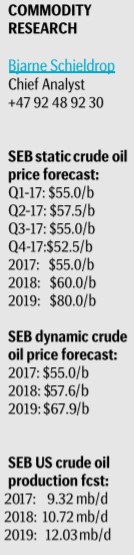
OPEC is successful in its effort to dry up the market and shifting the crude oil forward curve into backwardation. It had probably hoped for a situation where the longer dated contracts stands at $55-60/b with Brent 1mth contract trading at a backwardation premium of some $5/b above that. It will probably get its $5/b backwardation premium but longer dated contracts are likely to slip lower thus leaving OPEC with limited gain at the front end of the curve. We still think that Brent crude will average $57.5/b in Q2-17 as also the front end of the curve is flipping into backwardation. The erosion in the longer dated contracts is likely to continue.
US oil rig count last week increased 5 rigs but implied shale oil rig count went up by 12 as directional and vertical count fell back. Over the last two weeks the US implied shale oil rig count is up by 15 or 7.5/week which is marginally higher than our projected 7 rigs per week for H1-17. This shifts our dynamic price forecast for 2019 marginally lower from $68.3/b to $67.9/b.
Over the last two weeks weekly inventory data for the US, EU, Singapore and floating storage has moved down by 3.1 mb and 9.7 mb respectively last two weeks. OPEC’s medicine is working shifting the market increasingly into backwardation as a result. Declining inventories – that’s the proof of the pudding. That makes investors bullish. Not surprisingly speculative positions in WTI increased yet higher to a new record last week.
Some rebound but not much. Brent crude rebounded 1.5% yesterday to $65.47/b. This morning it is inching 0.2% up to $65.6/b. The lowest close last week was on Thursday at $64.11/b.

The curve structure is almost as week as it was before the weekend. The rebound we now have gotten post the message from OPEC+ over the weekend is to a large degree a rebound along the curve rather than much strengthening at the front-end of the curve. That part of the curve structure is almost as weak as it was last Thursday.
We are still on a weakening path. The message from OPEC+ over the weekend was we are still on a weakening path with rising supply from the group. It is just not as rapidly weakening as was feared ahead of the weekend when a quota hike of 500 kb/d/mth for November was discussed.
The Brent curve is on its way to full contango with Brent dipping into the $50ies/b. Thus the ongoing weakening we have had in the crude curve since the start of the year, and especially since early June, will continue until the Brent crude oil forward curve is in full contango along with visibly rising US and OECD oil inventories. The front-month Brent contract will then flip down towards the $60/b-line and below into the $50ies/b.
At what point will OPEC+ turn to cuts? The big question then becomes: When will OPEC+ turn around to make some cuts? At what (price) point will they choose to stabilize the market? Because for sure they will. Higher oil inventories, some more shedding of drilling rigs in US shale and Brent into the 50ies somewhere is probably where the group will step in.
There is nothing we have seen from the group so far which indicates that they will close their eyes, let the world drown in oil and the oil price crash to $40/b or below.
The message from OPEC+ is also about balance and stability. The world won’t drown in oil in 2026. The message from the group as far as we manage to interpret it is twofold: 1) Taking back market share which requires a lower price for non-OPEC+ to back off a bit, and 2) Oil market stability and balance. It is not just about 1. Thus fretting about how we are all going to drown in oil in 2026 is totally off the mark by just focusing on point 1.
When to buy cal 2026? Before Christmas when Brent hits $55/b and before OPEC+ holds its last meeting of the year which is likely to be in early December.
Brent crude oil prices have rebounded a bit along the forward curve. Not much strengthening in the structure of the curve. The front-end backwardation is not much stronger today than on its weakest level so far this year which was on Thursday last week.

The front-end backwardation fell to its weakest level so far this year on Thursday last week. A slight pickup yesterday and today, but still very close to the weakest year to date. More oil from OPEC+ in the coming months and softer demand and rising inventories. We are heading for yet softer levels.

Down to the lowest since early May. Brent crude has fallen sharply the latest four days. It closed at USD 64.11/b yesterday which is the lowest since early May. It is staging a 1.3% rebound this morning along with gains in both equities and industrial metals with an added touch of support from a softer USD on top.
What stands out the most to us this week is the collapse in the Dubai one to three months time-spread.
Dubai is medium sour crude. OPEC+ is in general medium sour crude production. Asian refineries are predominantly designed to process medium sour crude. So Dubai is the real measure of the balance between OPEC+ holding back or not versus Asian oil demand for consumption and stock building.
A sharp weakening of the front-end of the Dubai curve. The front-end of the Dubai crude curve has been holding out very solidly throughout this summer while the front-end of the Brent and WTI curves have been steadily softening. But the strength in the Dubai curve in our view was carrying the crude oil market in general. A source of strength in the crude oil market. The core of the strength.
The now finally sharp decline of the front-end of the Dubai crude curve is thus a strong shift. Weakness in the Dubai crude marker is weakness in the core of the oil market. The core which has helped to hold the oil market elevated.
Facts supports the weakening. Add in facts of Iraq lifting production from Kurdistan through Turkey. Saudi Arabia lifting production to 10 mb/d in September (normal production level) and lifting exports as well as domestic demand for oil for power for air con is fading along with summer heat. Add also in counter seasonal rise in US crude and product stocks last week. US oil stocks usually decline by 1.3 mb/week this time of year. Last week they instead rose 6.4 mb/week (+7.2 mb if including SPR). Total US commercial oil stocks are now only 2.1 mb below the 2015-19 seasonal average. US oil stocks normally decline from now to Christmas. If they instead continue to rise, then it will be strongly counter seasonal rise and will create a very strong bearish pressure on oil prices.
Will OPEC+ lift its voluntary quotas by zero, 137 kb/d, 500 kb/d or 1.5 mb/d? On Sunday of course OPEC+ will decide on how much to unwind of the remaining 1.5 mb/d of voluntary quotas for November. Will it be 137 kb/d yet again as for October? Will it be 500 kb/d as was talked about earlier this week? Or will it be a full unwind in one go of 1.5 mb/d? We think most likely now it will be at least 500 kb/d and possibly a full unwind. We discussed this in a not earlier this week: ”500 kb/d of voluntary quotas in October. But a full unwind of 1.5 mb/d”
The strength in the front-end of the Dubai curve held out through summer while Brent and WTI curve structures weakened steadily. That core strength helped to keep flat crude oil prices elevated close to the 70-line. Now also the Dubai curve has given in.

Brent crude oil forward curves

Total US commercial stocks now close to normal. Counter seasonal rise last week. Rest of year?

Total US crude and product stocks on a steady trend higher.

Analys
OPEC+ will likely unwind 500 kb/d of voluntary quotas in October. But a full unwind of 1.5 mb/d in one go could be in the cards
Down to mid-60ies as Iraq lifts production while Saudi may be tired of voluntary cut frugality. The Brent December contract dropped 1.6% yesterday to USD 66.03/b. This morning it is down another 0.3% to USD 65.8/b. The drop in the price came on the back of the combined news that Iraq has resumed 190 kb/d of production in Kurdistan with exports through Turkey while OPEC+ delegates send signals that the group will unwind the remaining 1.65 mb/d (less the 137 kb/d in October) of voluntary cuts at a pace of 500 kb/d per month pace.
Signals of accelerated unwind and Iraqi increase may be connected. Russia, Kazakhstan and Iraq were main offenders versus the voluntary quotas they had agreed to follow. Russia had a production ’debt’ (cumulative overproduction versus quota) of close to 90 mb in March this year while Kazakhstan had a ’debt’ of about 60 mb and the same for Iraq. This apparently made Saudi Arabia angry this spring. Why should Saudi Arabia hold back if the other voluntary cutters were just freeriding? Thus the sudden rapid unwinding of voluntary cuts. That is at least one angle of explanations for the accelerated unwinding.
If the offenders with production debts then refrained from lifting production as the voluntary cuts were rapidly unwinded, then they could ’pay back’ their ’debts’ as they would under-produce versus the new and steadily higher quotas.
Forget about Kazakhstan. Its production was just too far above the quotas with no hope that the country would hold back production due to cross-ownership of oil assets by international oil companies. But Russia and Iraq should be able to do it.
Iraqi cumulative overproduction versus quotas could reach 85-90 mb in October. Iraq has however steadily continued to overproduce by 3-5 mb per month. In July its new and gradually higher quota came close to equal with a cumulative overproduction of only 0.6 mb that month. In August again however its production had an overshoot of 100 kb/d or 3.1 mb for the month. Its cumulative production debt had then risen to close to 80 mb. We don’t know for September yet. But looking at October we now know that its production will likely average close to 4.5 mb/d due to the revival of 190 kb/d of production in Kurdistan. Its quota however will only be 4.24 mb/d. Its overproduction in October will thus likely be around 250 kb/d above its quota with its production debt rising another 7-8 mb to a total of close to 90 mb.
Again, why should Saudi Arabia be frugal while Iraq is freeriding. Better to get rid of the voluntary quotas as quickly as possible and then start all over with clean sheets.
Unwinding the remaining 1.513 mb/d in one go in October? If OPEC+ unwinds the remaining 1.513 mb/d of voluntary cuts in one big go in October, then Iraq’s quota will be around 4.4 mb/d for October versus its likely production of close to 4.5 mb/d for the coming month..
OPEC+ should thus unwind the remaining 1.513 mb/d (1.65 – 0.137 mb/d) in one go for October in order for the quota of Iraq to be able to keep track with Iraq’s actual production increase.
October 5 will show how it plays out. But a quota unwind of at least 500 kb/d for Oct seems likely. An overall increase of at least 500 kb/d in the voluntary quota for October looks likely. But it could be the whole 1.513 mb/d in one go. If the increase in the quota is ’only’ 500 kb/d then Iraqi cumulative production will still rise by 5.7 mb to a total of 85 mb in October.
Iraqi production debt versus quotas will likely rise by 5.7 mb in October if OPEC+ only lifts the overall quota by 500 kb/d in October. Here assuming historical production debt did not rise in September. That Iraq lifts its production by 190 kb/d in October to 4.47 mb/d (August level + 190 kb/d) and that OPEC+ unwinds 500 kb/d of the remining quotas in October when they decide on this on 5 October.


Samtal om sällsynta jordartsmetaller, guld och silver

Brookfield köper bränsleceller för 5 miljarder USD av Bloom Energy för att driva AI-datacenter

Teck Resources kan förse Nordamerika och kanske hela G7 med all germanium som behövs

Leading Edge Materials är på rätt plats i rätt tid

Oljepriset faller efter ny handelskonflikt mellan USA och Kina

Kinas elproduktion slog nytt rekord i augusti, vilket även kolkraft gjorde

Tyskland har så höga elpriser att företag inte har råd att använda elektricitet

OPEC+ missar produktionsmål, stöder oljepriserna

Ett samtal om guld, olja, fjärrvärme och förnybar energi
Brent crude ticks higher on tension, but market structure stays soft
-
 Nyheter4 veckor sedan
Kinas elproduktion slog nytt rekord i augusti, vilket även kolkraft gjorde
-
Nyheter4 veckor sedan
Tyskland har så höga elpriser att företag inte har råd att använda elektricitet
-
 Nyheter3 veckor sedan
OPEC+ missar produktionsmål, stöder oljepriserna
-
 Nyheter3 veckor sedan
Ett samtal om guld, olja, fjärrvärme och förnybar energi
-
Analys4 veckor sedan
Brent crude ticks higher on tension, but market structure stays soft
-
Analys3 veckor sedan
Are Ukraine’s attacks on Russian energy infrastructure working?
-

 Nyheter2 veckor sedan
Guld nära 4000 USD och silver 50 USD, därför kan de fortsätta stiga
-

 Nyheter3 veckor sedan
Guldpriset uppe på nya höjder, nu 3750 USD