Analys
Brent crude is crawling higher but its feet are slipping

Price action – Marginal gains in the front but losses in the back end curve

OPEC is tightening up the front end market but reviving US crude oil production is softening the medium term balance
OPEC is tightening up the front, but recovering US shale production is loosening up the longer dated part of the balance. That is why the longer dated contracts are slipping. US crude production last week rose above 9 mb/d for the first time since April 2016. For lower 48 production (where shale is the lion’s share), production rose by 17 kb/d w/w. Multiply by 52 and you get an annualized US production growth rate of 0.9 mb/d YoY. I.e. US shale oil production growth is back! If the +17 kb/d w/w was only noise it would mean nothing, but it is a trend. Our projection is for US shale oil production to grow at 18 kb/d w/w in February, 23 kb/d w/w in March and then gradually rising to 36 kb/d w/w in September equaling an annualized production growth rate of 1.9 mb/d before the growth rate is moderating after that again.
Since October 2016 US crude production has on averaged increased by 27.6 kb/d w/w. Most of this is probably not due to recovering shale oil production but rather due to commissioning of prior investments in the Gulf of Mexico. However, now onwards US crude production is going to increase on a weekly basis due to recovering US shale oil production.
OPEC is successful in its effort to dry up the market and shifting the crude oil forward curve into backwardation. It had probably hoped for a situation where the longer dated contracts stands at $55-60/b with Brent 1mth contract trading at a backwardation premium of some $5/b above that. It will probably get its $5/b backwardation premium but longer dated contracts are likely to slip lower thus leaving OPEC with limited gain at the front end of the curve. We still think that Brent crude will average $57.5/b in Q2-17 as also the front end of the curve is flipping into backwardation. The erosion in the longer dated contracts is likely to continue.
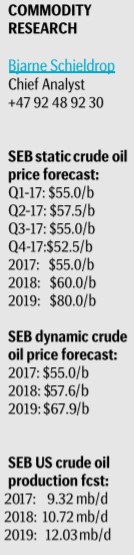
US oil rig count last week increased 5 rigs but implied shale oil rig count went up by 12 as directional and vertical count fell back. Over the last two weeks the US implied shale oil rig count is up by 15 or 7.5/week which is marginally higher than our projected 7 rigs per week for H1-17. This shifts our dynamic price forecast for 2019 marginally lower from $68.3/b to $67.9/b.
Over the last two weeks weekly inventory data for the US, EU, Singapore and floating storage has moved down by 3.1 mb and 9.7 mb respectively last two weeks. OPEC’s medicine is working shifting the market increasingly into backwardation as a result. Declining inventories – that’s the proof of the pudding. That makes investors bullish. Not surprisingly speculative positions in WTI increased yet higher to a new record last week.