

Analys
Brent crude again heading towards the $60/bl danger-zone


Following its intraday low of $59.45/bl last week the Brent August contract staged a mild rebound this week and reached an intraday high of $64.1/bl on Monday before falling back down again. This morning it is selling off 1.9% to $61.1/bl on numbers from API last night indicating that US crude oil inventories probably rose 4.85 m bl last week.

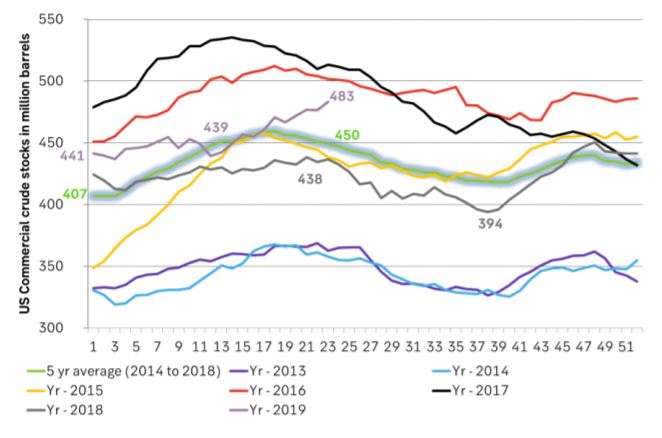
US crude stocks have been rising almost uninterrupted since mid-march. Until late April that was partially along a seasonally normal rise in US crude stocks and thus less pressing. Since early May however the US crude stocks have just continued higher during a period where they usually decline. That is probably why Brent crude managed to reach its ytd high in late April but has been heading lower since then. Depressed by counter seasonally rising US crude stocks now standing 32 m bl above the 5yr average. Thus news by API that they probably continued to rise for yet another week last week is not taken lightly by the market. Negative equity markets this morning is not helping the matter either with “Quitaly” risk (Italy exiting the Euro) being one of the negatives.
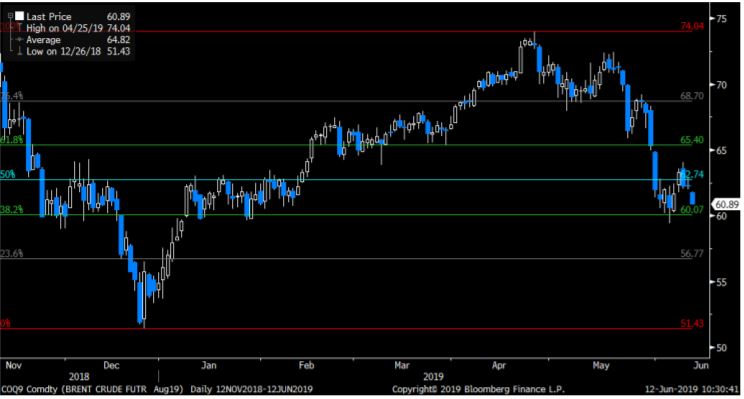
With Brent crude selling off towards $61/bl this morning it has again come dangerously close to the 38.2% Fibo retracement level of $60.07/bl for Brent Aug contract or $59.74/bl for the rolling front month contract below which there is basically no support before $51.43/bl for the Aug contract or $49.93/bl for the rolling front month contract.
The big question is of course why US crude stocks are rising?
If there were no pipeline, refinery or quality issues a rise in US crude and/or product stocks would correctly be interpreted as a residual reflection of a running surplus in the global oil market. A part of this surplus would then naturally pile up in the US as well as everywhere else. Rising US crude and product stocks would then be a telling sing of a global oil market in surplus. This is the natural and instinctive financial market interpretation of the rising US oil inventories: “Wow, the global market must really be running a large surplus if US stocks are rising this much!”
The Brent crude oil curve has however been trading in sharp backwardation until late May pointing instead to a physically very tight global oil market. Since then the Brent backwardation has come off a bit along with speculative sell-off but it is still trading in backwardation. Usually a sell-off in financial oil contracts will lead to a softening in the curve structure as the sell-off mostly takes place at the front end of the curve.
The natural and instinctive interpretation that rising US crude stocks is a reflection of a running surplus in the global oil market does thus not seem to be fully consistent with the backwardated Brent crude curve structure.
The fact is that in the US today we do have pipeline, refinery and quality issues blurring the picture. These issues are leading to a widening Brent to WTI price spread. The wider it gets the more it means that the US has local oil market issues which are not necessarily an equal reflection of the same issues in the global oil market.
- US shale crude oil production continues to rise by the day (+83,000 bl/d MoM in June according to the US EIA). Building of pipeline capacity is under way but is lagging with a lot more capacity coming online late 2019 and 2020. Thus crude oil is for now naturally backing up in the US, depressing WTI and widening the Brent to WTI price spread.
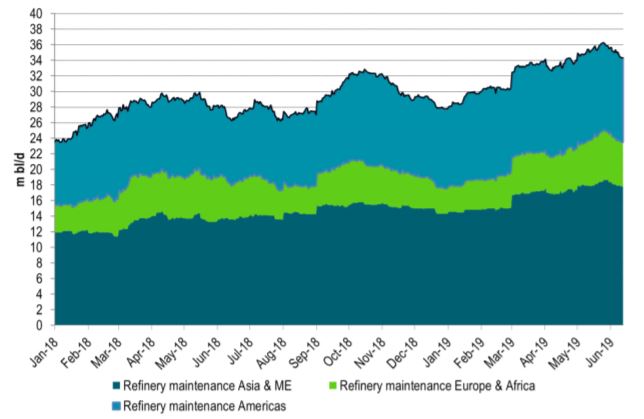
- US refineries have for several reasons been running well below normal and thus processed significantly less crude oil than normal (5yr). In our calculations they have processed 31 m bl/d less than normal since week 6.
- US shale crude oil is very light and contains lots of gasoline. This leads to a natural overproduction of gasoline with such stocks now again above the 5yr average and the gasoline crack has come off again. US refineries may thus prefer to import more medium sour crude and process less shale crude oil thus leading to rising US crude stocks.
In total there has been a significant amount of refinery capacity out for spring maintenance/turnaround. These have now started to ramp up again and will thus process much more crude oil going forward. US refinery utilization is also rising.
There are obviously sensible concerns for the health of the global economy due to the ongoing US/China trade war with fears that global oil demand growth may falter.
Historically though it is quite rare that global oil demand grows by less than 1.0% per year. Intra-year though the global oil demand may look very gloomy. That is however usually a reflection of a refinery inventory cycle where refineries becomes concerned for global oil product demand, they buy less crude and sell more products from their inventories. Just 1-2% tweak in their normal behaviour drives rippling waves into the global oil market. In the end though it most often turns out that oil demand for the year turned out to be not all that bad after all.
We do think that rising US oil inventories may not be an excellent reflection of the health of the global oil market and as such that the market may over-sell Brent crude on the back of what is happening in the US oil market / US oil inventories.
This is especially so now that we again rapidly are narrowing in on the very important Brent crude oil support level around the $60/bl line. If broken it opens up for a significant over-sell down to towards the $50/bl line.
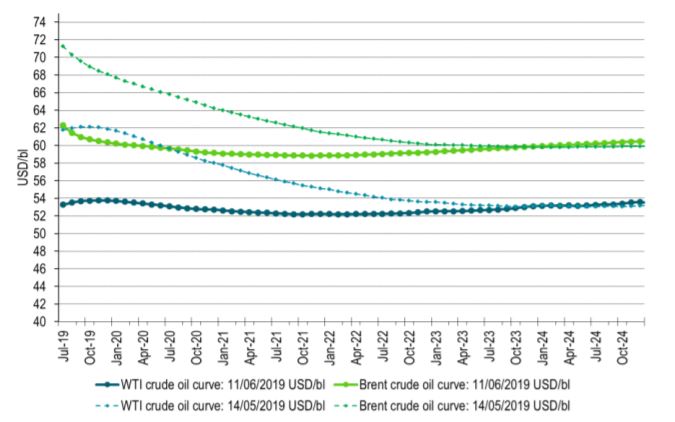
Ch1: Brent and WTI forward crude curves. Brent still in backwardation
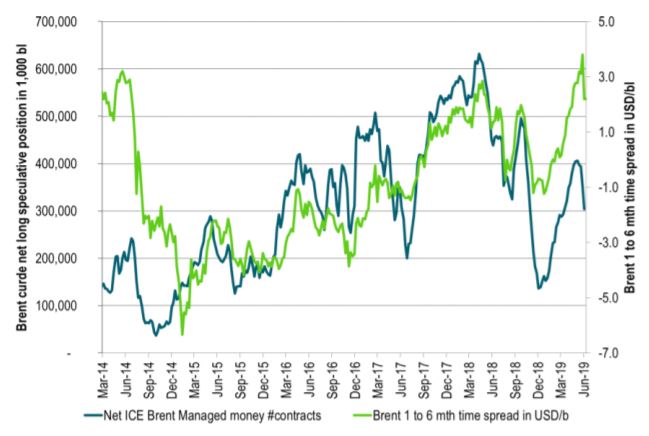
Ch2: Changes in speculative positions do impact the crude curve structure as buying and selling mostly takes place in the front end of the curves. Thus contango and backwardation is not totally a reflection of physical market
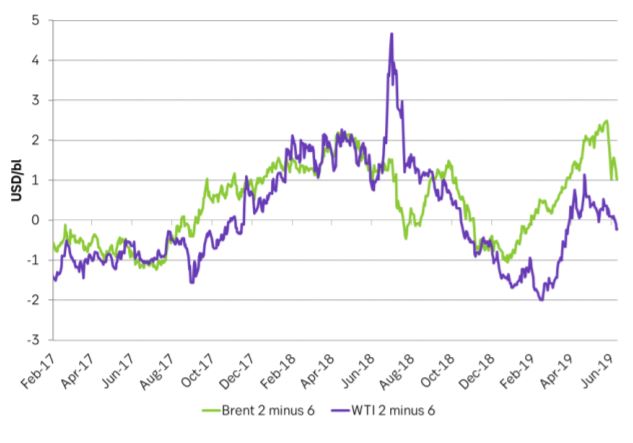
Ch3: Brent crude and WTI curve structures in terms of time spreads of the 2 month contract minus the 6 month contract. Usually they track closely: Same shape = same fundamentals. Significant divergence since late 2018
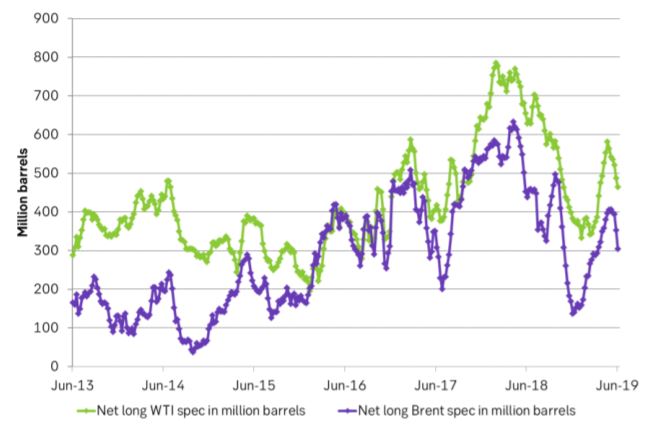
Ch4: Net long specs in Brent and WTI have come off but still room for further sell-off if markets sour more
Ch5: US crude inventories on the rise. Most damaging has been the rise after week 17/18 as US crude stocks usually decline after that. Counter seasonal crude stock rise is bad news
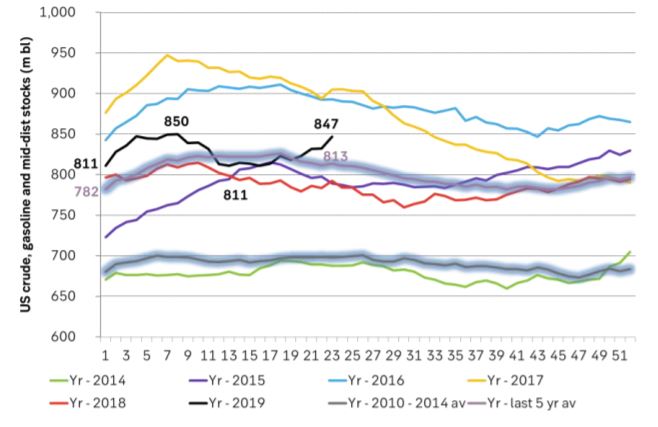
Ch6: Total US crude, gasoline and mid-dist stocks have however risen less dramatically
Ch7: Global refinery outage has been very high this spring. They are now coming back on-line thus consuming and processing more crude oil. But as we seen have seen the Brent crude oil curve is already in backwardation.
Ch8: The Brent Aug contract Fibo retracement levels. No real support before $51.4/bl if $60.07/bl is broken
Some rebound but not much. Brent crude rebounded 1.5% yesterday to $65.47/b. This morning it is inching 0.2% up to $65.6/b. The lowest close last week was on Thursday at $64.11/b.

The curve structure is almost as week as it was before the weekend. The rebound we now have gotten post the message from OPEC+ over the weekend is to a large degree a rebound along the curve rather than much strengthening at the front-end of the curve. That part of the curve structure is almost as weak as it was last Thursday.
We are still on a weakening path. The message from OPEC+ over the weekend was we are still on a weakening path with rising supply from the group. It is just not as rapidly weakening as was feared ahead of the weekend when a quota hike of 500 kb/d/mth for November was discussed.
The Brent curve is on its way to full contango with Brent dipping into the $50ies/b. Thus the ongoing weakening we have had in the crude curve since the start of the year, and especially since early June, will continue until the Brent crude oil forward curve is in full contango along with visibly rising US and OECD oil inventories. The front-month Brent contract will then flip down towards the $60/b-line and below into the $50ies/b.
At what point will OPEC+ turn to cuts? The big question then becomes: When will OPEC+ turn around to make some cuts? At what (price) point will they choose to stabilize the market? Because for sure they will. Higher oil inventories, some more shedding of drilling rigs in US shale and Brent into the 50ies somewhere is probably where the group will step in.
There is nothing we have seen from the group so far which indicates that they will close their eyes, let the world drown in oil and the oil price crash to $40/b or below.
The message from OPEC+ is also about balance and stability. The world won’t drown in oil in 2026. The message from the group as far as we manage to interpret it is twofold: 1) Taking back market share which requires a lower price for non-OPEC+ to back off a bit, and 2) Oil market stability and balance. It is not just about 1. Thus fretting about how we are all going to drown in oil in 2026 is totally off the mark by just focusing on point 1.
When to buy cal 2026? Before Christmas when Brent hits $55/b and before OPEC+ holds its last meeting of the year which is likely to be in early December.
Brent crude oil prices have rebounded a bit along the forward curve. Not much strengthening in the structure of the curve. The front-end backwardation is not much stronger today than on its weakest level so far this year which was on Thursday last week.

The front-end backwardation fell to its weakest level so far this year on Thursday last week. A slight pickup yesterday and today, but still very close to the weakest year to date. More oil from OPEC+ in the coming months and softer demand and rising inventories. We are heading for yet softer levels.

Down to the lowest since early May. Brent crude has fallen sharply the latest four days. It closed at USD 64.11/b yesterday which is the lowest since early May. It is staging a 1.3% rebound this morning along with gains in both equities and industrial metals with an added touch of support from a softer USD on top.
What stands out the most to us this week is the collapse in the Dubai one to three months time-spread.
Dubai is medium sour crude. OPEC+ is in general medium sour crude production. Asian refineries are predominantly designed to process medium sour crude. So Dubai is the real measure of the balance between OPEC+ holding back or not versus Asian oil demand for consumption and stock building.
A sharp weakening of the front-end of the Dubai curve. The front-end of the Dubai crude curve has been holding out very solidly throughout this summer while the front-end of the Brent and WTI curves have been steadily softening. But the strength in the Dubai curve in our view was carrying the crude oil market in general. A source of strength in the crude oil market. The core of the strength.
The now finally sharp decline of the front-end of the Dubai crude curve is thus a strong shift. Weakness in the Dubai crude marker is weakness in the core of the oil market. The core which has helped to hold the oil market elevated.
Facts supports the weakening. Add in facts of Iraq lifting production from Kurdistan through Turkey. Saudi Arabia lifting production to 10 mb/d in September (normal production level) and lifting exports as well as domestic demand for oil for power for air con is fading along with summer heat. Add also in counter seasonal rise in US crude and product stocks last week. US oil stocks usually decline by 1.3 mb/week this time of year. Last week they instead rose 6.4 mb/week (+7.2 mb if including SPR). Total US commercial oil stocks are now only 2.1 mb below the 2015-19 seasonal average. US oil stocks normally decline from now to Christmas. If they instead continue to rise, then it will be strongly counter seasonal rise and will create a very strong bearish pressure on oil prices.
Will OPEC+ lift its voluntary quotas by zero, 137 kb/d, 500 kb/d or 1.5 mb/d? On Sunday of course OPEC+ will decide on how much to unwind of the remaining 1.5 mb/d of voluntary quotas for November. Will it be 137 kb/d yet again as for October? Will it be 500 kb/d as was talked about earlier this week? Or will it be a full unwind in one go of 1.5 mb/d? We think most likely now it will be at least 500 kb/d and possibly a full unwind. We discussed this in a not earlier this week: ”500 kb/d of voluntary quotas in October. But a full unwind of 1.5 mb/d”
The strength in the front-end of the Dubai curve held out through summer while Brent and WTI curve structures weakened steadily. That core strength helped to keep flat crude oil prices elevated close to the 70-line. Now also the Dubai curve has given in.

Brent crude oil forward curves

Total US commercial stocks now close to normal. Counter seasonal rise last week. Rest of year?

Total US crude and product stocks on a steady trend higher.

Analys
OPEC+ will likely unwind 500 kb/d of voluntary quotas in October. But a full unwind of 1.5 mb/d in one go could be in the cards
Down to mid-60ies as Iraq lifts production while Saudi may be tired of voluntary cut frugality. The Brent December contract dropped 1.6% yesterday to USD 66.03/b. This morning it is down another 0.3% to USD 65.8/b. The drop in the price came on the back of the combined news that Iraq has resumed 190 kb/d of production in Kurdistan with exports through Turkey while OPEC+ delegates send signals that the group will unwind the remaining 1.65 mb/d (less the 137 kb/d in October) of voluntary cuts at a pace of 500 kb/d per month pace.
Signals of accelerated unwind and Iraqi increase may be connected. Russia, Kazakhstan and Iraq were main offenders versus the voluntary quotas they had agreed to follow. Russia had a production ’debt’ (cumulative overproduction versus quota) of close to 90 mb in March this year while Kazakhstan had a ’debt’ of about 60 mb and the same for Iraq. This apparently made Saudi Arabia angry this spring. Why should Saudi Arabia hold back if the other voluntary cutters were just freeriding? Thus the sudden rapid unwinding of voluntary cuts. That is at least one angle of explanations for the accelerated unwinding.
If the offenders with production debts then refrained from lifting production as the voluntary cuts were rapidly unwinded, then they could ’pay back’ their ’debts’ as they would under-produce versus the new and steadily higher quotas.
Forget about Kazakhstan. Its production was just too far above the quotas with no hope that the country would hold back production due to cross-ownership of oil assets by international oil companies. But Russia and Iraq should be able to do it.
Iraqi cumulative overproduction versus quotas could reach 85-90 mb in October. Iraq has however steadily continued to overproduce by 3-5 mb per month. In July its new and gradually higher quota came close to equal with a cumulative overproduction of only 0.6 mb that month. In August again however its production had an overshoot of 100 kb/d or 3.1 mb for the month. Its cumulative production debt had then risen to close to 80 mb. We don’t know for September yet. But looking at October we now know that its production will likely average close to 4.5 mb/d due to the revival of 190 kb/d of production in Kurdistan. Its quota however will only be 4.24 mb/d. Its overproduction in October will thus likely be around 250 kb/d above its quota with its production debt rising another 7-8 mb to a total of close to 90 mb.
Again, why should Saudi Arabia be frugal while Iraq is freeriding. Better to get rid of the voluntary quotas as quickly as possible and then start all over with clean sheets.
Unwinding the remaining 1.513 mb/d in one go in October? If OPEC+ unwinds the remaining 1.513 mb/d of voluntary cuts in one big go in October, then Iraq’s quota will be around 4.4 mb/d for October versus its likely production of close to 4.5 mb/d for the coming month..
OPEC+ should thus unwind the remaining 1.513 mb/d (1.65 – 0.137 mb/d) in one go for October in order for the quota of Iraq to be able to keep track with Iraq’s actual production increase.
October 5 will show how it plays out. But a quota unwind of at least 500 kb/d for Oct seems likely. An overall increase of at least 500 kb/d in the voluntary quota for October looks likely. But it could be the whole 1.513 mb/d in one go. If the increase in the quota is ’only’ 500 kb/d then Iraqi cumulative production will still rise by 5.7 mb to a total of 85 mb in October.
Iraqi production debt versus quotas will likely rise by 5.7 mb in October if OPEC+ only lifts the overall quota by 500 kb/d in October. Here assuming historical production debt did not rise in September. That Iraq lifts its production by 190 kb/d in October to 4.47 mb/d (August level + 190 kb/d) and that OPEC+ unwinds 500 kb/d of the remining quotas in October when they decide on this on 5 October.


Teck Resources kan förse Nordamerika och kanske hela G7 med all germanium som behövs

Leading Edge Materials är på rätt plats i rätt tid

Oljepriset faller efter ny handelskonflikt mellan USA och Kina

Christian Kopfer kommenterar guld, koppar, olja och stål, samt några råvarubolag

Silver spränger den magiska gränsen, kostar nu över 50 USD per uns

Kinas elproduktion slog nytt rekord i augusti, vilket även kolkraft gjorde

Tyskland har så höga elpriser att företag inte har råd att använda elektricitet

Det stigande guldpriset en utmaning för smyckesköpare

Ett samtal om guld, olja, fjärrvärme och förnybar energi

OPEC+ missar produktionsmål, stöder oljepriserna
-
 Nyheter4 veckor sedan
Kinas elproduktion slog nytt rekord i augusti, vilket även kolkraft gjorde
-
Nyheter4 veckor sedan
Tyskland har så höga elpriser att företag inte har råd att använda elektricitet
-
 Nyheter4 veckor sedan
Det stigande guldpriset en utmaning för smyckesköpare
-
 Nyheter3 veckor sedan
Ett samtal om guld, olja, fjärrvärme och förnybar energi
-
 Nyheter2 veckor sedan
OPEC+ missar produktionsmål, stöder oljepriserna
-
Analys4 veckor sedan
Brent crude ticks higher on tension, but market structure stays soft
-
Analys3 veckor sedan
Are Ukraine’s attacks on Russian energy infrastructure working?
-

 Nyheter1 vecka sedan
Guld nära 4000 USD och silver 50 USD, därför kan de fortsätta stiga