

Analys
Brent and WTI – A tale of two benchmarks


Brent and West Texas Intermediate (WTI) are two globally recognised oil benchmarks. When market participants refer to the price of oil, they typically refer to one or the other or both. But despite having quite similar chemical properties, there are important distinguishing features between the two. Financial markets recognise these differences and, as a result, price the two differently. The two benchmarks have contrasting features in terms of where the oil is produced, how it is stored and transported and the way it is traded in international markets. These differences not only explain the historical price discrepancy between the two, but also help us understand why the two have behaved differently during the coronavirus pandemic and the ensuing market volatility. This article will contrast the distinguishing features between the two and, after developing a new lens to view the two benchmarks, replay the recent episode when WTI prices crashed into negative territory. The article will conclude by outlining the forces which will shape the fluid commodity going forward.
Same, same, but different
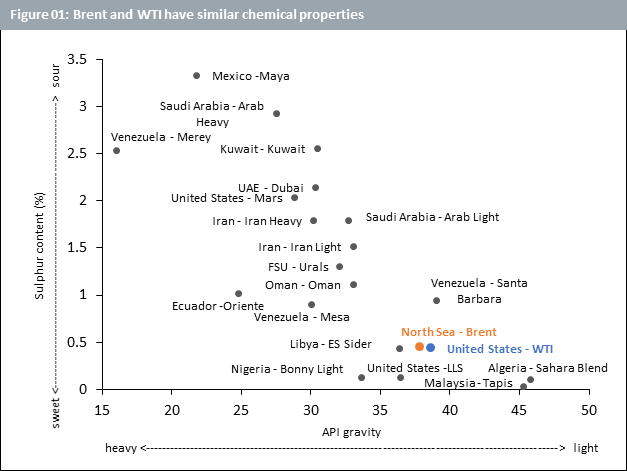
In ‘A tale of Two Cities’ by Charles Dickens, Sydney Carton sacrifices his life to save Charles Darnay, who is married to the woman Carton loves, by taking his place in prison moments before he is taken to the guillotine during the French revolution. He is able to pull off this selfless act of bravery thanks to the uncanny resemblance between him and Darnay. Similarly, most people would not be able to tell the difference if a barrel of WTI was replaced with one for Brent given the likeness between the two. Both Brent and WTI are referred to as light and sweet. They are ‘light’ in terms of the American Petroleum Institute (API) gravity. Having an API gravity greater than 10 makes them light and allows them to float on water, while an API gravity of less than 10 would have caused them to sink. Similarly, both have low sulphur content making them ‘sweet’ and easy to refine (See Figure 01).
But while Carton and Darnay looked alike, they were distinctly different individuals. Brent and WTI too, despite their resemblance, have their disparities. Brent Crude is extracted from the North Sea. Oil production from Europe, Africa and the Middle East tends to use Brent as its main benchmark. This accounts for around two-thirds of internationally traded crude oil. The Organisation of the Petroleum Exporting countries (OPEC), an intergovernmental organisation comprising 13 key oil producing countries as well as their 10 partner countries (collectively referred to as OPEC+), also typically use Brent as their oil price benchmark. In contrast, WTI is sourced primarily from Texas and most oil production in the US uses WTI as its main benchmark.
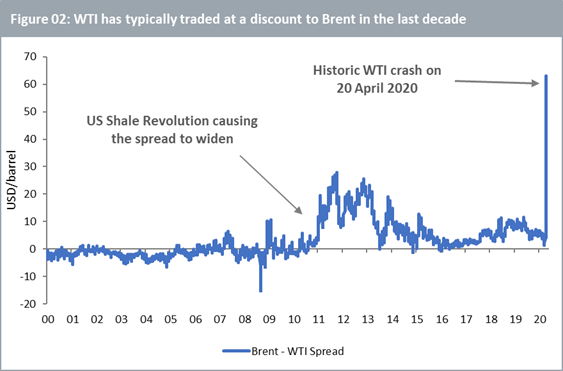
Brent and WTI have always traded at different prices giving rise to the Brent – WTI spread (Figure 02). Purely in terms of quality, WTI has a slight edge over Brent on account of its lower sulphur content making it moderately ‘sweeter’ and thus easier to refine. For this reason, WTI ought to theoretically trade at a premium over Brent. For a large part of the first decade of this century, WTI did indeed trade at a premium, i.e. the Brent – WTI spread was negative. Over the last decade however, the shale revolution in the US has brought large volumes of oil into the market making the US one of the largest oil producers in the world. The shale revolution refers to a combination of technological improvements and financial infrastructure enabling the US to produce oil from low-permeable shale, sandstone and carbonate rock formations in larger quantities than ever before. The shale oil industry has grown rapidly since 2011 and accounted for 63% of total US crude oil production in 2019 (according to the US Energy Information Administration). In line with economic principles of demand and supply, as the total volume of oil production increased in the US, this put downward pressure on WTI. The Brent – WTI spread has generally been positive in the last decade.
Another reason for the Brent – WTI spread is the logistical challenge for the US to transport oil from landlocked production hubs through a network of pipelines and to ship it overseas. This impinges on the overseas demand for oil from the US (WTI). In contrast, Brent is produced at or closer to sea making it easier for it to reach its overseas destinations. The US is however investing heavily in its pipeline infrastructure to enable it to send large vessels of oil from its shores to international buyers. Several such infrastructure projects are expected to be completed by 2021-2022 when we might see an increase in demand for WTI and thus a narrowing of its spread with Brent.
The historic WTI crash
The explanation above of the spread between the two benchmarks omits any discussion about the unprecedented spike on 20 April 2020. This section will unravel the story behind the anomalous occurrence.
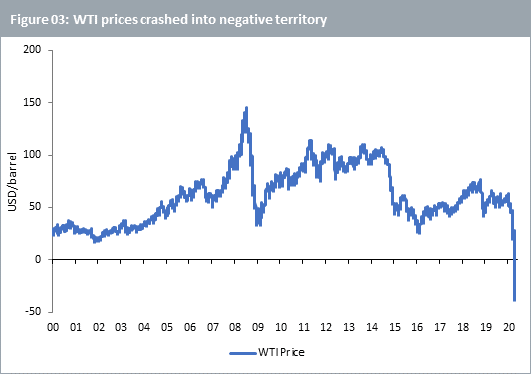
On Monday 20 April 2020, markets witnessed a historic crash in WTI prices (Figure 03). The crash occurred a day before the active Nymex WTI futures contract was due to expire. This contract, meant to deliver oil between 01 May and 31 May, crashed into negative territory as oil storage in the US became very tight. With the coronavirus pandemic causing considerable oil demand destruction putting entire countries in lockdown and bringing economic activity to a grinding halt, the reduction in oil production was not enough to balance the market creating a supply glut. The main delivery and settlement point in Cushing, Oklahoma was approaching its storage limit with any additional capacity likely already leased out or earmarked for other purposes. This acute pressure, so close to contract expiry at the point where contracts settle, contributed to the negative price. Those taking physical delivery from the expiring futures contract were being paid to take the oil and find a place to store it. The May contract expired the following day in slightly positive territory. When the June contract became the active contract upon the May contract’s expiry, prices recovered further as the issue of June deliveries creating the same problem was less worrying, at least at that point.
But Brent did not endure a similar crash. The main reason for this is that WTI, traded on the New York Mercantile Exchange (NYMEX), is a deliverable futures contract. Thus, upon expiry, the holder of the futures contract takes delivery of the underlying, i.e. barrels of oil. Brent however, traded on the Intercontinental Exchange (ICE), has a cash settlement procedure whereby the holder of the futures contract need not take delivery of the underlying upon expiry. Therefore, storage issues create a more direct risk to investors in WTI futures.
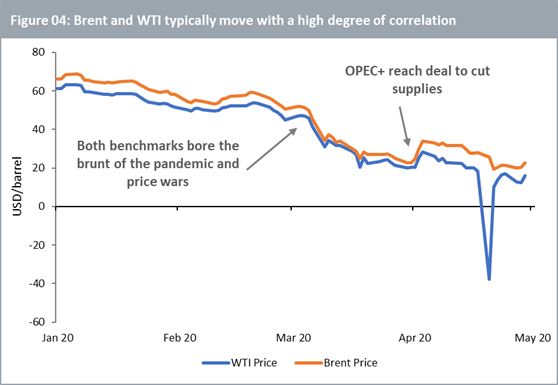
Outside of this idiosyncrasy pertaining to futures trading, the two benchmarks generally move with a high degree of correlation (Figure 04). At the peak of the coronavirus pandemic’s acceleration in April, a third of global oil demand was wiped out. Soon thereafter, major oil producers Saudi Arabia and Russia engaged in a price war. This created a double shock for oil as the suppliers opened the floodgates at a time when demand had just crashed. Both benchmarks experienced severe price weakness. But as policy decisions from OPEC+ can be expected to impact Brent prices more than WTI, the deal reached by the group at the start of April to cut suppliesprovided slightly more cushioning to Brent.
What happens next?
With a deeper understanding of the drivers of the two benchmarks, historic and recent price behaviour makes more sense. But the all-important question is, “what happens next?”. The fate of oil prices rests heavily on how quickly the world can overcome the pandemic and get the economic engines firing again. Volatility in oil prices may persist in the coming weeks, or even months, until uncertainty with regards to the pandemic and lockdowns diminishes. The relative price behaviour of WTI and Brent during this period will depend on the degree to which producers in the US and OPEC+ cut supplies to balance the market.
We however hope to paint a more optimistic picture of the world in the second half of this year. Oil prices may not recover quickly to where they were in February this year due to an overhang of excess supply, a fractured OPEC+ and a dented global economic engine. Nonetheless, after all the pain, the world will eventually return to some semblance of normalcy. Manufacturers will switch their machines on again, cars will return to the roads and aeroplanes will return to the skies. Once again, oil is expected to be in demand. And while one protagonist had to sacrifice himself to save the other in the tale told by Dickens, we expect both mainstays from the tale of two benchmarks to rise again when the crisis is over.
Mobeen Tahir, Associate Director, Research, WisdomTree
DISCLAIMER
This material is prepared by WisdomTree and its affiliates and is not intended to be relied upon as a forecast, research or investment advice, and is not a recommendation, offer or solicitation to buy or sell any securities or to adopt any investment strategy. The opinions expressed are as of the date of production and may change as subsequent conditions vary. The information and opinions contained in this material are derived from proprietary and non-proprietary sources. As such, no warranty of accuracy or reliability is given and no responsibility arising in any other way for errors and omissions (including responsibility to any person by reason of negligence) is accepted by WisdomTree, nor any affiliate, nor any of their officers, employees or agents. Reliance upon information in this material is at the sole discretion of the reader. Past performance is not a reliable indicator of future performance.

Some rebound but not much. Brent crude rebounded 1.5% yesterday to $65.47/b. This morning it is inching 0.2% up to $65.6/b. The lowest close last week was on Thursday at $64.11/b.

The curve structure is almost as week as it was before the weekend. The rebound we now have gotten post the message from OPEC+ over the weekend is to a large degree a rebound along the curve rather than much strengthening at the front-end of the curve. That part of the curve structure is almost as weak as it was last Thursday.
We are still on a weakening path. The message from OPEC+ over the weekend was we are still on a weakening path with rising supply from the group. It is just not as rapidly weakening as was feared ahead of the weekend when a quota hike of 500 kb/d/mth for November was discussed.
The Brent curve is on its way to full contango with Brent dipping into the $50ies/b. Thus the ongoing weakening we have had in the crude curve since the start of the year, and especially since early June, will continue until the Brent crude oil forward curve is in full contango along with visibly rising US and OECD oil inventories. The front-month Brent contract will then flip down towards the $60/b-line and below into the $50ies/b.
At what point will OPEC+ turn to cuts? The big question then becomes: When will OPEC+ turn around to make some cuts? At what (price) point will they choose to stabilize the market? Because for sure they will. Higher oil inventories, some more shedding of drilling rigs in US shale and Brent into the 50ies somewhere is probably where the group will step in.
There is nothing we have seen from the group so far which indicates that they will close their eyes, let the world drown in oil and the oil price crash to $40/b or below.
The message from OPEC+ is also about balance and stability. The world won’t drown in oil in 2026. The message from the group as far as we manage to interpret it is twofold: 1) Taking back market share which requires a lower price for non-OPEC+ to back off a bit, and 2) Oil market stability and balance. It is not just about 1. Thus fretting about how we are all going to drown in oil in 2026 is totally off the mark by just focusing on point 1.
When to buy cal 2026? Before Christmas when Brent hits $55/b and before OPEC+ holds its last meeting of the year which is likely to be in early December.
Brent crude oil prices have rebounded a bit along the forward curve. Not much strengthening in the structure of the curve. The front-end backwardation is not much stronger today than on its weakest level so far this year which was on Thursday last week.

The front-end backwardation fell to its weakest level so far this year on Thursday last week. A slight pickup yesterday and today, but still very close to the weakest year to date. More oil from OPEC+ in the coming months and softer demand and rising inventories. We are heading for yet softer levels.

Down to the lowest since early May. Brent crude has fallen sharply the latest four days. It closed at USD 64.11/b yesterday which is the lowest since early May. It is staging a 1.3% rebound this morning along with gains in both equities and industrial metals with an added touch of support from a softer USD on top.
What stands out the most to us this week is the collapse in the Dubai one to three months time-spread.
Dubai is medium sour crude. OPEC+ is in general medium sour crude production. Asian refineries are predominantly designed to process medium sour crude. So Dubai is the real measure of the balance between OPEC+ holding back or not versus Asian oil demand for consumption and stock building.
A sharp weakening of the front-end of the Dubai curve. The front-end of the Dubai crude curve has been holding out very solidly throughout this summer while the front-end of the Brent and WTI curves have been steadily softening. But the strength in the Dubai curve in our view was carrying the crude oil market in general. A source of strength in the crude oil market. The core of the strength.
The now finally sharp decline of the front-end of the Dubai crude curve is thus a strong shift. Weakness in the Dubai crude marker is weakness in the core of the oil market. The core which has helped to hold the oil market elevated.
Facts supports the weakening. Add in facts of Iraq lifting production from Kurdistan through Turkey. Saudi Arabia lifting production to 10 mb/d in September (normal production level) and lifting exports as well as domestic demand for oil for power for air con is fading along with summer heat. Add also in counter seasonal rise in US crude and product stocks last week. US oil stocks usually decline by 1.3 mb/week this time of year. Last week they instead rose 6.4 mb/week (+7.2 mb if including SPR). Total US commercial oil stocks are now only 2.1 mb below the 2015-19 seasonal average. US oil stocks normally decline from now to Christmas. If they instead continue to rise, then it will be strongly counter seasonal rise and will create a very strong bearish pressure on oil prices.
Will OPEC+ lift its voluntary quotas by zero, 137 kb/d, 500 kb/d or 1.5 mb/d? On Sunday of course OPEC+ will decide on how much to unwind of the remaining 1.5 mb/d of voluntary quotas for November. Will it be 137 kb/d yet again as for October? Will it be 500 kb/d as was talked about earlier this week? Or will it be a full unwind in one go of 1.5 mb/d? We think most likely now it will be at least 500 kb/d and possibly a full unwind. We discussed this in a not earlier this week: ”500 kb/d of voluntary quotas in October. But a full unwind of 1.5 mb/d”
The strength in the front-end of the Dubai curve held out through summer while Brent and WTI curve structures weakened steadily. That core strength helped to keep flat crude oil prices elevated close to the 70-line. Now also the Dubai curve has given in.

Brent crude oil forward curves

Total US commercial stocks now close to normal. Counter seasonal rise last week. Rest of year?

Total US crude and product stocks on a steady trend higher.

Analys
OPEC+ will likely unwind 500 kb/d of voluntary quotas in October. But a full unwind of 1.5 mb/d in one go could be in the cards
Down to mid-60ies as Iraq lifts production while Saudi may be tired of voluntary cut frugality. The Brent December contract dropped 1.6% yesterday to USD 66.03/b. This morning it is down another 0.3% to USD 65.8/b. The drop in the price came on the back of the combined news that Iraq has resumed 190 kb/d of production in Kurdistan with exports through Turkey while OPEC+ delegates send signals that the group will unwind the remaining 1.65 mb/d (less the 137 kb/d in October) of voluntary cuts at a pace of 500 kb/d per month pace.
Signals of accelerated unwind and Iraqi increase may be connected. Russia, Kazakhstan and Iraq were main offenders versus the voluntary quotas they had agreed to follow. Russia had a production ’debt’ (cumulative overproduction versus quota) of close to 90 mb in March this year while Kazakhstan had a ’debt’ of about 60 mb and the same for Iraq. This apparently made Saudi Arabia angry this spring. Why should Saudi Arabia hold back if the other voluntary cutters were just freeriding? Thus the sudden rapid unwinding of voluntary cuts. That is at least one angle of explanations for the accelerated unwinding.
If the offenders with production debts then refrained from lifting production as the voluntary cuts were rapidly unwinded, then they could ’pay back’ their ’debts’ as they would under-produce versus the new and steadily higher quotas.
Forget about Kazakhstan. Its production was just too far above the quotas with no hope that the country would hold back production due to cross-ownership of oil assets by international oil companies. But Russia and Iraq should be able to do it.
Iraqi cumulative overproduction versus quotas could reach 85-90 mb in October. Iraq has however steadily continued to overproduce by 3-5 mb per month. In July its new and gradually higher quota came close to equal with a cumulative overproduction of only 0.6 mb that month. In August again however its production had an overshoot of 100 kb/d or 3.1 mb for the month. Its cumulative production debt had then risen to close to 80 mb. We don’t know for September yet. But looking at October we now know that its production will likely average close to 4.5 mb/d due to the revival of 190 kb/d of production in Kurdistan. Its quota however will only be 4.24 mb/d. Its overproduction in October will thus likely be around 250 kb/d above its quota with its production debt rising another 7-8 mb to a total of close to 90 mb.
Again, why should Saudi Arabia be frugal while Iraq is freeriding. Better to get rid of the voluntary quotas as quickly as possible and then start all over with clean sheets.
Unwinding the remaining 1.513 mb/d in one go in October? If OPEC+ unwinds the remaining 1.513 mb/d of voluntary cuts in one big go in October, then Iraq’s quota will be around 4.4 mb/d for October versus its likely production of close to 4.5 mb/d for the coming month..
OPEC+ should thus unwind the remaining 1.513 mb/d (1.65 – 0.137 mb/d) in one go for October in order for the quota of Iraq to be able to keep track with Iraq’s actual production increase.
October 5 will show how it plays out. But a quota unwind of at least 500 kb/d for Oct seems likely. An overall increase of at least 500 kb/d in the voluntary quota for October looks likely. But it could be the whole 1.513 mb/d in one go. If the increase in the quota is ’only’ 500 kb/d then Iraqi cumulative production will still rise by 5.7 mb to a total of 85 mb in October.
Iraqi production debt versus quotas will likely rise by 5.7 mb in October if OPEC+ only lifts the overall quota by 500 kb/d in October. Here assuming historical production debt did not rise in September. That Iraq lifts its production by 190 kb/d in October to 4.47 mb/d (August level + 190 kb/d) and that OPEC+ unwinds 500 kb/d of the remining quotas in October when they decide on this on 5 October.


Teck Resources kan förse Nordamerika och kanske hela G7 med all germanium som behövs

Leading Edge Materials är på rätt plats i rätt tid

Oljepriset faller efter ny handelskonflikt mellan USA och Kina

Christian Kopfer kommenterar guld, koppar, olja och stål, samt några råvarubolag

Silver spränger den magiska gränsen, kostar nu över 50 USD per uns

Kinas elproduktion slog nytt rekord i augusti, vilket även kolkraft gjorde

Tyskland har så höga elpriser att företag inte har råd att använda elektricitet

Det stigande guldpriset en utmaning för smyckesköpare

OPEC+ missar produktionsmål, stöder oljepriserna

Ett samtal om guld, olja, fjärrvärme och förnybar energi
-
 Nyheter4 veckor sedan
Kinas elproduktion slog nytt rekord i augusti, vilket även kolkraft gjorde
-
Nyheter4 veckor sedan
Tyskland har så höga elpriser att företag inte har råd att använda elektricitet
-
 Nyheter4 veckor sedan
Det stigande guldpriset en utmaning för smyckesköpare
-
 Nyheter2 veckor sedan
OPEC+ missar produktionsmål, stöder oljepriserna
-
 Nyheter3 veckor sedan
Ett samtal om guld, olja, fjärrvärme och förnybar energi
-
Analys4 veckor sedan
Brent crude ticks higher on tension, but market structure stays soft
-
Analys3 veckor sedan
Are Ukraine’s attacks on Russian energy infrastructure working?
-

 Nyheter1 vecka sedan
Guld nära 4000 USD och silver 50 USD, därför kan de fortsätta stiga