

Analys
Why Brent 1mth at $65/b is reachable before Christmas

 Crude oil price action – Brent crude 1mth Inching 1% higher WoW amid dollar headwinds. Brent to WTI crude spreads continues to widen
Brent crude inched 1% higher over the past week with a close of $57.75/b while the longer dated Dec-2020 gained 0.4% to $54.75/b.
The energy complex in total gained 0.6% while the other commodity sub-indexes all experienced losses from a marginal 0.03% loss for metals to a more substantial 1.7% and 1.8% for Agri and precious respectively.
Overall commodities lost 0.4% over the week and thus slightly less than dollar headwind from a 0.7% stronger USD index.
Compared to the 0.4% gain in the Brent Dec-2020 the WTI Dec-2020 instead fell back 0.3% to $50.08/b.
The spread between longer dated Brent and WTI prices thus continued to expand last week rising to $4.67/b for the Dec-2020 horizon.
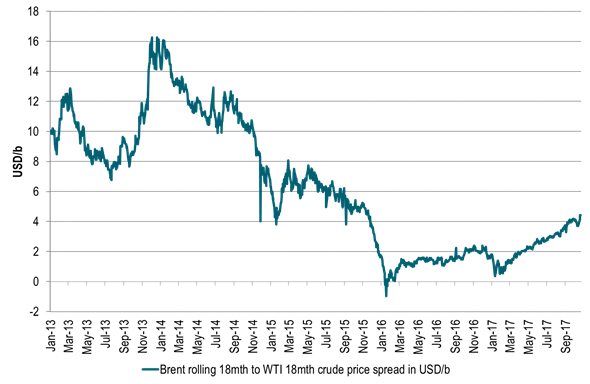
The further expansion in Brent – WTI crude spreads was even more pronounced on the Dec-2018 horizon where it expanded 0.7% to $4.35/b., the highest since November 2015.
Brent crude oil comment – Why Brent 1mth at $65/b is reachable before Christmas
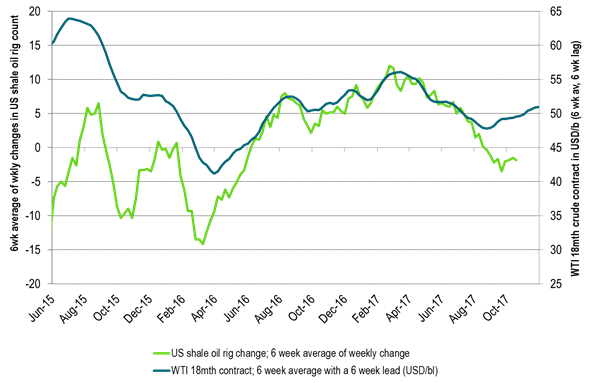
Declining US shale oil rig count is likely going to allow the mid-term WTI crude curve to move from current $51/b up towards the high of the year of around $56-57/b
Increasing US crude production is placing increasing strains on US crude oil export bottlenecks leading to further widening in the Brent to WTI crude spreads.
As a result mid-term forward Brent crude prices have the potential to move to $61-62/b when mid-term WTI moves to $56-57/b.
Further global inventory draws are likely to add yet steeper backwardation to the Brent crude curve which would allow the Brent 1mth contract to rise towards $65/b ($3-4/b above the Brent mid-term crude forward prices).
However, the 2018 crude oil market balance could be challenging as US shale oil players are likely going to drill less and complete more.
At the moment there is a tug of war between short term bullish drivers, real and visible, versus bearish concerns for 2018.
Bullish short term drivers are likely to win in the short term while medium term bearish drivers are likely going to come back and bite the market in the … in 2018.
There has been lots of comments that it would be unwise for Brent crude 1mth to move above $60/b because that would stimulate US shale oil production too much.
The thing is that it is not the 1mth Brent crude contract which sends stimulating price signals to US shale oil producers all that much. Rather it is the medium term forward WTI curve contracts which do so.
Typically it is the 1-3 year forward WTI contract price level which is what US shale oil players can sell and hedge new and existing production at. These forward prices are setting the level of profitability for new shale oil wells and production.
The Brent 1mth contract reached its highest price level since March 2015 in late September ($59.49/b) and is trading just $1.6/b shy of that level today at $57.88/b.
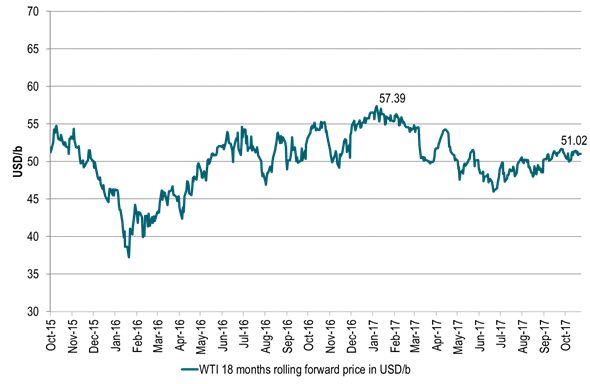
Conversely the medium term WTI forward prices have set no such new ytd highs. If we look at the rolling WTI 18 mths contract (1.5 years forward) it reached a high of the year in early January of $57.39/b.
That was real shale oil stimulus resulting in lots of additional shale oil rigs and drilling. On Friday however it closed at no more than $51.02/b with the highest price this side of the summer being $51.7/b
In late September we commented that “Brent was set free to rally on increasing backwardation and widening spread to WTI”. The argument was that we can get a higher Brent 1mth price without stimulating US shale oil production because of an increasing Brent backwardation and an increasing Brent to WTI crude spread both in the front and on the curve.
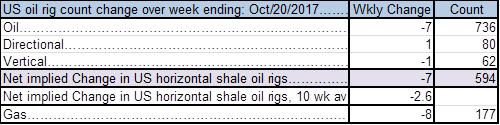
At the moment we see that US shale oil players are kicking out shale oil drilling rigs. Just last week they kicked out 7 shale oil rigs. Since early August they have kicked out 30 oil rigs and 24 implied shale oil rigs.
Assuming a 6 week lag between price action and rig count reaction this shedding of US oil rigs is taking place at a forward WTI18 mth crude price of $50-51/b (6 weeks ago).
The US shale oil players are thus sentiment wise telling the market that WTI at a medium term forward price level of $50/b is not enough for them to keep the current rig count running.
They are kicking out rigs at $50/b. Thus while empirical market experience from May 2016 to July 2017 was that the US shale oil rig count inflection point was around $47/b (18mth forward) it has now clearly shifted higher than $50-51/b.
We believe that the market dynamic with respect to US shale oil is much about trial and error. Having figured out that it is now no longer at $47/b and that it is now also higher than $50-51/b it now remains to figure out where it has moved too. Thus the next test should now be to figure out where the US shale oil rig count change versus WTI 18mth forward price level relationship inflection point has moved to. I.e. the market should allow the forward WTI18mth contract to move upwards. Acceptable moves upwards in perspective of what we have seen earlier this year would be that the WTI 18 mth contract moves to $55-56/b.
One reason why such a move higher for the WTI 18 mth price horizon is reasonable to expect is because even though the WTI crude curve is in contango at the very front end of the curve there is still an overall backwardation in the forward WTI curve structure. The consequence of this is that shale oil producers now have to sell at a discount to front end prices if they want to sell forward hedging their future production. This typically leads to reluctance and reduced forward selling by producers. Consumers however experience the opposite. Consumers can now buy forward at a discount to front end prices which typically leads to more forward buying. Thus less forward selling and more forward buying should typically help to lift the mid-term forward crude prices higher both for Brent and WTI.
Thus if we assume that the mid-term WTI forward crude prices has potential to move $5/b higher it would allow the Brent mid-term crude price to shift $5/b higher as well which would allow the Brent 1mth contract to shift $5/b higher as well. If we in addition assume that the Brent to WTI crude price spread on the curve expands a further $1/b then the Brent crude curve can shift yet another dollar higher. Add another dollar in further steepening Brent backwardation and the front end Brent has another dollar on the upside. Thus a total $2/b extra on widening Brent – WTI spread and further Brent backwardation steepening.
Thus in total the Brent 1mth contract has an upside potential of another $7/b. The move would place the 18 mth WTI price at $56/b versus ytd high in early January of $57.39/b and current $51/b. It would place the Brent 18 mth contract at $61/b and a new ytd high and highest since April 2015 and it would place the Brent 1mth contract just shy of $65/b. And still US shale producers would not be stimulated with a higher forward price than WTI 18mth at $56/b. Maybe that is where the US shale oil rig count to WTI18mth inflection point has shifted to? At the moment it is at least higher than $51/b given data since early August.
The sentimental drivers for such a move higher is going to be further draw downs in inventories (yes, market is running a deficit due to OPEC+ production cuts), further reductions in US shale oil rig count (yes, we expect US shale players to kick out 5-10 rigs every week to Christmas to balance drilling versus completions), further accumulation of net long Brent spec into the backwardated Brent crude curve with positive roll yield, emergence of geopolitical risk premium in crude prices as stocks move lower, stronger and stronger signals from Saudi Arabia and Russia that they are willing to extend cuts to end of 2018 topped up with forecasts pointing to a cold US winter ahead (stronger La Nina event) with US Atlantic coast mid-distillate stocks now below 5yr average.
However, there is a reason for why Saudi Arabia and Russia both are signalling elevated willingness to extend current production cuts all to the end of 2018. They are concerned for the oil market balance in 2018. And with good reason. Since November 2016 when OPEC+ decided to cut production there has been a veritable shale oil drilling party with an accumulation of 1735 uncompleted wells and the accumulation continued also in September adding another 179 uncompleted wells lifting the total to 7270 uncompleted wells. In comparison the shale players completed 10161 wells over the 12mths to September and on average 847 wells per mth.
Thus if 2017 was a US shale oil drilling party then 2018 may be a shale oil completion party. US shale oil completions have been rising every month since January. In December 2016 completions stood at a low of 645 wells rising to 1029 in September and still rising. If completions average 1100 wells per month in 2018 then it would be 30% higher than the average of 847 in the 12 mths to September. In our view the US shale oil players today have too many active drilling rigs. They should spend their money on completions rather than drilling. That is what creates oil and cash flow. Thus the natural thing to expect is a further decline in the drilling rig count. Maybe another 100 to 200 rigs down and at the same time to expect a further increase in completions and eventually a draw down in the inventory of drilled but yet uncompleted wells.
At the moment the market is in a tug of war between short term bullish drivers which are very true, very visible and very strong versus real concerns for the oil market balance for 2018. We expect the short term bullish drivers will win in the short term while the medium term issues will hit back at the market in the medium term.
Ch1: US shale oil players are kicking out drilling rigs with WTI 18 mth contract at $51/b
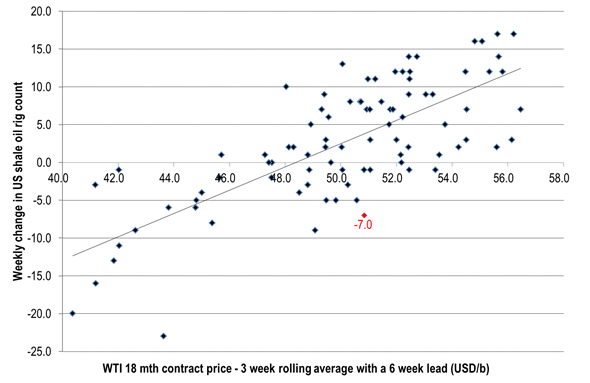
Ch2: US shale oil rig count change to WTI mid-term forward price breaking up. Inflection point shifting higher. Rigs being kicked out at WTI $50-51/b
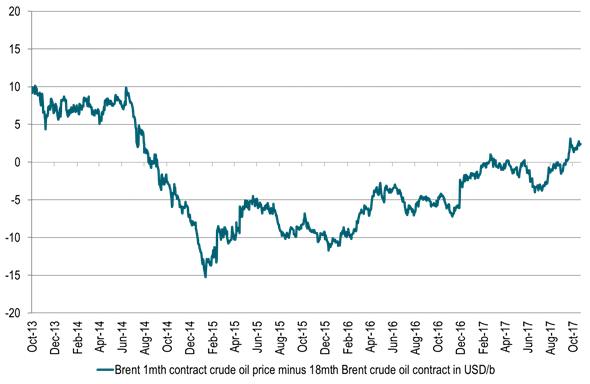
Ch3: Brent crude 1 to 18 mth time spread – Increasing backwardation as inventories falls
Stronger backwardation allows the 1mth contract to rise higher without stimulating US shale production on the forward WTI curve
Ch4: Rolling Brent 18mth price spread to the rolling WTI 18mth crude price
The spread is expanding as the US crude production is increasing
Higher spread will allow the Brent18 mth contract to move relatively higher versus the WTI curve without stimulating US shale oil production
More to come as US crude production continues to rise
Ch5: WTI 18mth forward crude oil price. Still lots of room on the upside before getting back to ytd high
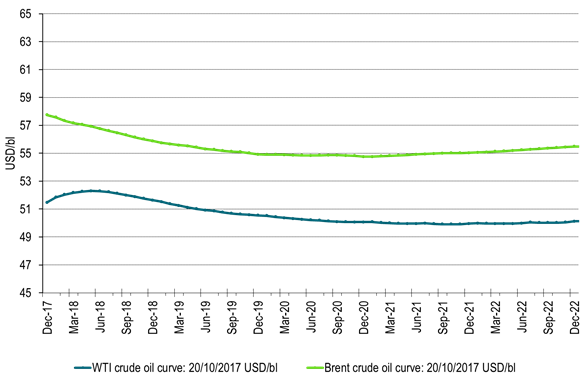
Ch6: Crude oil forward curves. Brent in backwardation, more to come. Front end WTI in front end contango to flip into front end backwardation
Ch7: Brent 1mth to WTI 1mth contract price spread makes a jump to $6/b
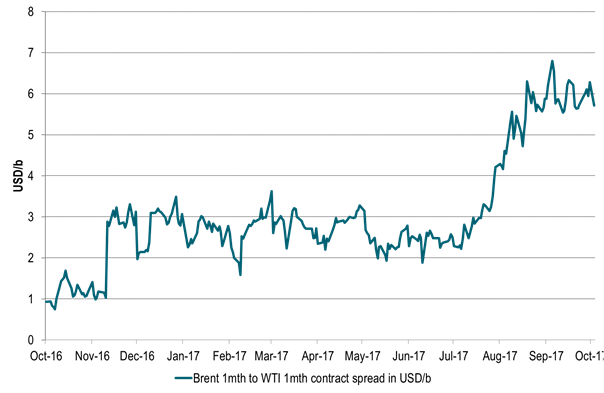
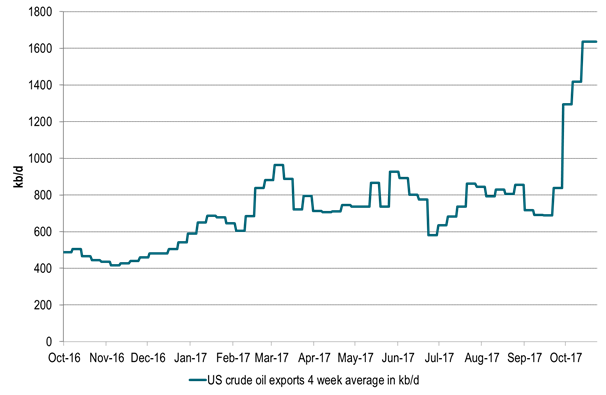
Ch7: Resulting in a big jump in US crude oil exports
This will drain US crude inventories and flip front end WTI contango into backwardation
Kind regards
Bjarne Schieldrop
Chief analyst, Commodities
SEB Markets
Merchant Banking
Parts of the Brent crude curve dipping into the high $50ies/b. Brent crude fell 2.3% over the week to Friday. It closed the week at $61.29/b, a slight gain on the day, but also traded to a low of $60.14/b that same day and just barely avoided trading into the $50ies/b. This morning it is risk-on in equities which seems to help industrial metals a little higher. But no such luck for oil. It is down 0.8% at $60.8/b. This week looks set for Brent crude to dip its feet in the $50ies/b. The Brent 3mth contract actually traded into the high $50ies/b on Friday.

The front-end backwardation has been on a weakening foot and is now about to fully disappear. The lowest point of the crude oil curve has also moved steadily lower and lower and its discount to the 5yr contract is now $6.8/b. A solid contango. The Brent 3mth contract did actually dip into the $50ies/b intraday on Friday when it traded to a low point of $59.93/b.
More weakness to come as lots of oil at sea comes to ports. Mid-East OPEC countries have boosted exports along with lower post summer consumption and higher production. The result is highly visibly in oil at sea which increased by 17 mb to 1,311 mb over the week to Sunday. Up 185 mb since mid-August. On its way to discharge at a port somewhere over the coming month or two.
Don’t forget that the oil market path ahead is all down to OPEC+. Remember that what is playing out in the oil market now is all by design by OPEC+. The group has decided that the unwind of the voluntary cuts is what it wants to do. In a combination of meeting demand from consumers as well as taking back market share. But we need to remember that how this plays out going forward is all at the mercy of what OPEC+ decides to do. It will halt the unwinding at some point. It will revert to cuts instead of unwind at some point.
A few months with Brent at $55/b and 40-50 US shale oil rigs kicked out may be what is needed. We think OPEC+ needs to see the exit of another 40-50 drilling rigs in the US shale oil patches to set US shale oil production on a path to of a 1 mb/d year on year decline Dec-25 to Dec-26. We are not there yet. But a 2-3 months period with Brent crude averaging $55/b would probably do it.
Oil on water increased 17 mb over the week to Sunday while oil in transit increased by 23 mb. So less oil was standing still. More was moving.

Crude oil floating storage (stationary more than 7 days). Down 11 mb over week to Sunday

The lowest point of the Brent crude oil curve versus the 5yr contract. Weakest so far this year.

Crude oil 1mth to 3mth time-spreads. Dubai held out strongly through summer, but then that center of strength fell apart in late September and has been leading weakness in crude curves lower since then.

Rebounding along with most markets. But concerns over solidity of Gaza peace may also contribute. Brent crude fell 0.8% yesterday to $61.91/b and its lowest close since May this year. This morning it is bouncing up 0.9% to $62.5/b along with a softer USD amid positive sentiment with both equities and industrial metals moving higher. Concerns that the peace in Gaza may be less solid than what one might hope for also yields some support to Brent. Bets on tech stocks are rebounding, defying fears of trade war. Money moving back into markets. Gold continues upwards its strong trend and a softer dollar helps it higher today as well.
US crude & products probably rose 5.6 mb last week (API) versus a normal seasonal decline of 2.4 mb. The US API last night partial and thus indicative data for US oil inventories. Their data indicates that US crude stocks rose 7.4 mb last week, gasoline stocks rose 3.0 mb while Distillate stocks fell 4.8 mb. Altogether an increase in commercial crude and product stocks of 5.6 mb. Commercial US crude and product stocks normally decline by 2.4 mb this time of year. So seasonally adjusted the US inventories rose 8 mb last week according to the indicative numbers by the API. That is a lot. Also, the counter seasonal trend of rising stocks versus normally declining stocks this time of year looks on a solid pace of continuation. If the API is correct then total US crude and product stocks would stand 41 mb higher than one year ago and 6 mb higher than the 2015-19 average. And if we combine this with our knowledge of a sharp increase in production and exports by OPEC(+) and a large increase in oil at sea, then the current trend in US oil inventories looks set to continue. So higher stocks and lower crude oil prices until OPEC(+) switch to cuts. Actual US oil inventory data today at 18:00 CET.
US commercial crude and product stocks rising to 1293 mb in week 41 if last nights indicative numbers from API are correct.

Crude oil soon coming to a port near you. OPEC has lifted production sharply higher this autumn. At the same time demand for oil in the Middle-East has fallen as we have moved out of summer heat and crude oil burn for power for air-conditioning. The Middle-East oil producers have thus been able to lift exports higher on both accounts. Crude oil and condensates on water has shot up by 177 mb since mid-August. This oil is now on its way to ports around the world. And when they arrive, it will likely help to lift stocks onshore higher. That is probably when we will lose the last bit of front-end backwardation the the crude oil curves. That will help to drive the front-month Brent crude oil price down to the $60/b line and revisit the high $50ies/b. Then the eyes will be all back on OPEC+ when they meet in early November and then again in early December.
Crude oil and condensates at sea have moved straight up by 177 mb since mid-August as OPEC(+) has produced more, consumed less and exported more.

When it starts to move lower it moves rather quickly. Gaza, China, IEA. Brent crude is down 2.1% today to $62/b after having traded as high as $66.58/b last Thursday and above $70/b in late September. The sell-off follows the truce/peace in Gaze, a flareup in US-China trade and yet another bearish oil outlook from the IEA.
A lasting peace in Gaze could drive crude oil at sea to onshore stocks. A lasting peace in Gaza would probably calm down the Houthis and thus allow more normal shipments of crude oil to sail through the Suez Canal, the Red Sea and out through the Bab-el-Mandeb Strait. Crude oil at sea has risen from 48 mb in April to now 91 mb versus a pre-Covid normal of about 50-60 mb. The rise to 91 mb is probably the result of crude sailing around Africa to be shot to pieces by the Houthis. If sailings were to normalize through the Suez Canal, then it could free up some 40 mb in transit at sea moving onshore into stocks.
The US-China trade conflict is of course bearish for demand if it continues.
Bearish IEA yet again. Getting closer to 2026. Credibility rises. We expect OPEC to cut end of 2025. The bearish monthly report from the IEA is what it is, but the closer we get to 2026, the more likely the IEA is of being ball-park right in its outlook. In its monthly report today the IEA estimates that the need for crude oil from OPEC in 2026 will be 25.4 mb/d versus production by the group in September of 29.1 mb/d. The group thus needs to do some serious cutting at the end of 2025 if it wants to keep the market balanced and avoid inventories from skyrocketing. Given that IEA is correct that is. We do however expect OPEC to implement cuts to avoid a large increase in inventories in Q1-26. The group will probably revert to cuts either at its early December meeting when they discuss production for January or in early January when they discuss production for February. The oil price will likely head yet lower until the group reverts to cuts.
Dubai: The Mid-East anchor dragging crude oil lower. Surplus emerging in Mid-East pricing. Crude oil prices held surprisingly strong all through the summer. A sign and a key source of that strength came from the strength in the front-end backwardation of the Dubai crude oil curve. It held out strong from mid-June and all until late September with an average 1-3mth time-spread premium of $1.8/b from mid-June to end of September. The 1-3mth time-spreads for Brent and WTI however were in steady deterioration from late June while their flat prices probably were held up by the strength coming from the Persian Gulf. Then in late September the strength in the Dubai curve suddenly collapsed. Since the start of October it has been weaker than both the Brent and the WTI curves. The Dubai 1-3mth time-spread now only stands at $0.25/b. The Middle East is now exporting more as it is producing more and also consuming less following elevated summer crude burn for power (Aircon) etc.
The only bear-element missing is a sudden and solid rise in OECD stocks. The only thing that is missing for the bear-case everyone have been waiting for is a solid, visible rise in OECD stocks in general and US oil stocks specifically. So watch out for US API indications tomorrow and official US oil inventories on Thursday.
No sign of any kind of fire-sale of oil from Saudi Arabia yet. To what we can see, Saudi Arabia is not at all struggling to sell its oil. It only lowered its Official Selling Prices (OSPs) to Asia marginally for November. A surplus market + Saudi determination to sell its oil to the market would normally lead to a sharp lowering of Saudi OSPs to Asia. Not yet at least and not for November.
The 5yr contract close to fixed at $68/b. Of importance with respect to how far down oil can/will go. When the oil market moves into a surplus then the spot price starts to trade in a large discount to the 5yr contract. Typically $10-15/b below the 5yr contract on average in bear-years (2009, 2015, 2016, 2020). But the 5yr contract is usually pulled lower as well thus making this approach a moving target. But the 5yr contract price has now been rock solidly been pegged to $68/b since 2022. And in the 2022 bull-year (Brent spot average $99/b), the 5yr contract only went to $72/b on average. If we assume that the same goes for the downside and that 2026 is a bear-year then the 5yr goes to $64/b while the spot is trading at a $10-15/b discount to that. That would imply an average spot price next year of $49-54/b. But that is if OPEC doesn’t revert to cuts and instead keeps production flowing. We think OPEC(+) will trim/cut production as needed into 2026 to prevent a huge build-up in global oil stocks and a crash in prices. But for now we are still heading lower. Into the $50ies/b.


Gruvbolaget Boliden överträffade analytikernas förväntningar

Australien och USA investerar 8,5 miljarder USD för försörjningskedja av kritiska mineraler
Brent crude set to dip its feet into the high $50ies/b this week

Vad guldets uppgång egentligen betyder för världen

Spotpriset på guld över 4300 USD och silver över 54 USD

OPEC+ missar produktionsmål, stöder oljepriserna

Goldman Sachs höjer prognosen för guld, tror priset når 4900 USD

Blykalla och amerikanska Oklo inleder ett samarbete
Guld nära 4000 USD och silver 50 USD, därför kan de fortsätta stiga
Are Ukraine’s attacks on Russian energy infrastructure working?
-
 Nyheter4 veckor sedan
OPEC+ missar produktionsmål, stöder oljepriserna
-
 Nyheter2 veckor sedan
Goldman Sachs höjer prognosen för guld, tror priset når 4900 USD
-
 Nyheter3 veckor sedan
Blykalla och amerikanska Oklo inleder ett samarbete
-
 Nyheter3 veckor sedan
Guld nära 4000 USD och silver 50 USD, därför kan de fortsätta stiga
-
Analys4 veckor sedan
Are Ukraine’s attacks on Russian energy infrastructure working?
-

 Nyheter2 veckor sedan
Leading Edge Materials är på rätt plats i rätt tid
-

 Nyheter3 veckor sedan
Ett samtal om guld, olja, koppar och stål
-

 Nyheter2 veckor sedan
Nytt prisrekord, guld stiger över 4000 USD