

Analys
Why Brent 1mth at $65/b is reachable before Christmas

 Crude oil price action – Brent crude 1mth Inching 1% higher WoW amid dollar headwinds. Brent to WTI crude spreads continues to widen
Brent crude inched 1% higher over the past week with a close of $57.75/b while the longer dated Dec-2020 gained 0.4% to $54.75/b.
The energy complex in total gained 0.6% while the other commodity sub-indexes all experienced losses from a marginal 0.03% loss for metals to a more substantial 1.7% and 1.8% for Agri and precious respectively.
Overall commodities lost 0.4% over the week and thus slightly less than dollar headwind from a 0.7% stronger USD index.
Compared to the 0.4% gain in the Brent Dec-2020 the WTI Dec-2020 instead fell back 0.3% to $50.08/b.
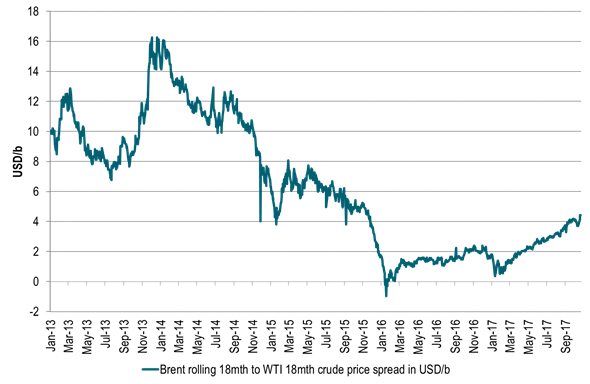
The spread between longer dated Brent and WTI prices thus continued to expand last week rising to $4.67/b for the Dec-2020 horizon.
The further expansion in Brent – WTI crude spreads was even more pronounced on the Dec-2018 horizon where it expanded 0.7% to $4.35/b., the highest since November 2015.
Brent crude oil comment – Why Brent 1mth at $65/b is reachable before Christmas
Declining US shale oil rig count is likely going to allow the mid-term WTI crude curve to move from current $51/b up towards the high of the year of around $56-57/b
Increasing US crude production is placing increasing strains on US crude oil export bottlenecks leading to further widening in the Brent to WTI crude spreads.
As a result mid-term forward Brent crude prices have the potential to move to $61-62/b when mid-term WTI moves to $56-57/b.
Further global inventory draws are likely to add yet steeper backwardation to the Brent crude curve which would allow the Brent 1mth contract to rise towards $65/b ($3-4/b above the Brent mid-term crude forward prices).
However, the 2018 crude oil market balance could be challenging as US shale oil players are likely going to drill less and complete more.
At the moment there is a tug of war between short term bullish drivers, real and visible, versus bearish concerns for 2018.
Bullish short term drivers are likely to win in the short term while medium term bearish drivers are likely going to come back and bite the market in the … in 2018.
There has been lots of comments that it would be unwise for Brent crude 1mth to move above $60/b because that would stimulate US shale oil production too much.
The thing is that it is not the 1mth Brent crude contract which sends stimulating price signals to US shale oil producers all that much. Rather it is the medium term forward WTI curve contracts which do so.
Typically it is the 1-3 year forward WTI contract price level which is what US shale oil players can sell and hedge new and existing production at. These forward prices are setting the level of profitability for new shale oil wells and production.
The Brent 1mth contract reached its highest price level since March 2015 in late September ($59.49/b) and is trading just $1.6/b shy of that level today at $57.88/b.
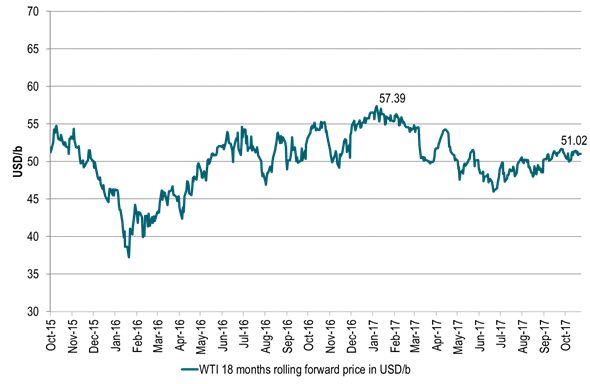
Conversely the medium term WTI forward prices have set no such new ytd highs. If we look at the rolling WTI 18 mths contract (1.5 years forward) it reached a high of the year in early January of $57.39/b.
That was real shale oil stimulus resulting in lots of additional shale oil rigs and drilling. On Friday however it closed at no more than $51.02/b with the highest price this side of the summer being $51.7/b
In late September we commented that “Brent was set free to rally on increasing backwardation and widening spread to WTI”. The argument was that we can get a higher Brent 1mth price without stimulating US shale oil production because of an increasing Brent backwardation and an increasing Brent to WTI crude spread both in the front and on the curve.
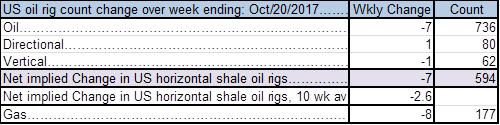
At the moment we see that US shale oil players are kicking out shale oil drilling rigs. Just last week they kicked out 7 shale oil rigs. Since early August they have kicked out 30 oil rigs and 24 implied shale oil rigs.
Assuming a 6 week lag between price action and rig count reaction this shedding of US oil rigs is taking place at a forward WTI18 mth crude price of $50-51/b (6 weeks ago).
The US shale oil players are thus sentiment wise telling the market that WTI at a medium term forward price level of $50/b is not enough for them to keep the current rig count running.
They are kicking out rigs at $50/b. Thus while empirical market experience from May 2016 to July 2017 was that the US shale oil rig count inflection point was around $47/b (18mth forward) it has now clearly shifted higher than $50-51/b.
We believe that the market dynamic with respect to US shale oil is much about trial and error. Having figured out that it is now no longer at $47/b and that it is now also higher than $50-51/b it now remains to figure out where it has moved too. Thus the next test should now be to figure out where the US shale oil rig count change versus WTI 18mth forward price level relationship inflection point has moved to. I.e. the market should allow the forward WTI18mth contract to move upwards. Acceptable moves upwards in perspective of what we have seen earlier this year would be that the WTI 18 mth contract moves to $55-56/b.
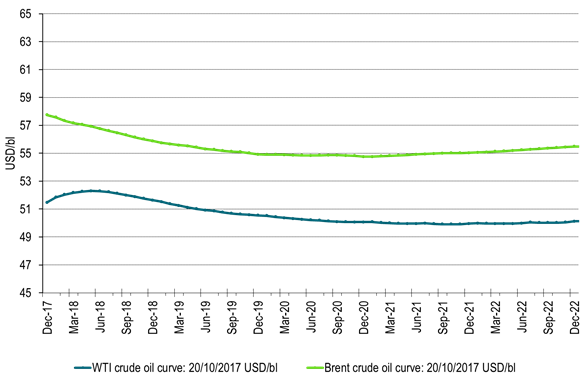
One reason why such a move higher for the WTI 18 mth price horizon is reasonable to expect is because even though the WTI crude curve is in contango at the very front end of the curve there is still an overall backwardation in the forward WTI curve structure. The consequence of this is that shale oil producers now have to sell at a discount to front end prices if they want to sell forward hedging their future production. This typically leads to reluctance and reduced forward selling by producers. Consumers however experience the opposite. Consumers can now buy forward at a discount to front end prices which typically leads to more forward buying. Thus less forward selling and more forward buying should typically help to lift the mid-term forward crude prices higher both for Brent and WTI.
Thus if we assume that the mid-term WTI forward crude prices has potential to move $5/b higher it would allow the Brent mid-term crude price to shift $5/b higher as well which would allow the Brent 1mth contract to shift $5/b higher as well. If we in addition assume that the Brent to WTI crude price spread on the curve expands a further $1/b then the Brent crude curve can shift yet another dollar higher. Add another dollar in further steepening Brent backwardation and the front end Brent has another dollar on the upside. Thus a total $2/b extra on widening Brent – WTI spread and further Brent backwardation steepening.
Thus in total the Brent 1mth contract has an upside potential of another $7/b. The move would place the 18 mth WTI price at $56/b versus ytd high in early January of $57.39/b and current $51/b. It would place the Brent 18 mth contract at $61/b and a new ytd high and highest since April 2015 and it would place the Brent 1mth contract just shy of $65/b. And still US shale producers would not be stimulated with a higher forward price than WTI 18mth at $56/b. Maybe that is where the US shale oil rig count to WTI18mth inflection point has shifted to? At the moment it is at least higher than $51/b given data since early August.
The sentimental drivers for such a move higher is going to be further draw downs in inventories (yes, market is running a deficit due to OPEC+ production cuts), further reductions in US shale oil rig count (yes, we expect US shale players to kick out 5-10 rigs every week to Christmas to balance drilling versus completions), further accumulation of net long Brent spec into the backwardated Brent crude curve with positive roll yield, emergence of geopolitical risk premium in crude prices as stocks move lower, stronger and stronger signals from Saudi Arabia and Russia that they are willing to extend cuts to end of 2018 topped up with forecasts pointing to a cold US winter ahead (stronger La Nina event) with US Atlantic coast mid-distillate stocks now below 5yr average.
However, there is a reason for why Saudi Arabia and Russia both are signalling elevated willingness to extend current production cuts all to the end of 2018. They are concerned for the oil market balance in 2018. And with good reason. Since November 2016 when OPEC+ decided to cut production there has been a veritable shale oil drilling party with an accumulation of 1735 uncompleted wells and the accumulation continued also in September adding another 179 uncompleted wells lifting the total to 7270 uncompleted wells. In comparison the shale players completed 10161 wells over the 12mths to September and on average 847 wells per mth.
Thus if 2017 was a US shale oil drilling party then 2018 may be a shale oil completion party. US shale oil completions have been rising every month since January. In December 2016 completions stood at a low of 645 wells rising to 1029 in September and still rising. If completions average 1100 wells per month in 2018 then it would be 30% higher than the average of 847 in the 12 mths to September. In our view the US shale oil players today have too many active drilling rigs. They should spend their money on completions rather than drilling. That is what creates oil and cash flow. Thus the natural thing to expect is a further decline in the drilling rig count. Maybe another 100 to 200 rigs down and at the same time to expect a further increase in completions and eventually a draw down in the inventory of drilled but yet uncompleted wells.
At the moment the market is in a tug of war between short term bullish drivers which are very true, very visible and very strong versus real concerns for the oil market balance for 2018. We expect the short term bullish drivers will win in the short term while the medium term issues will hit back at the market in the medium term.
Ch1: US shale oil players are kicking out drilling rigs with WTI 18 mth contract at $51/b
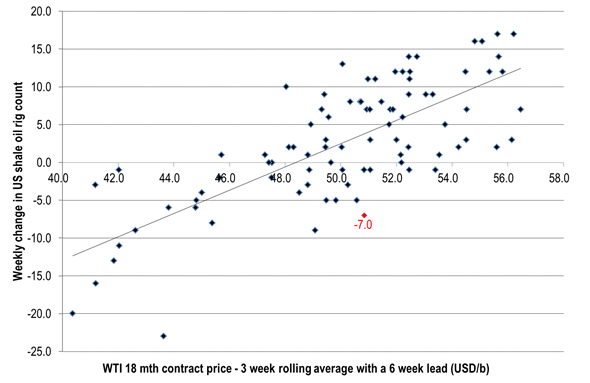
Ch2: US shale oil rig count change to WTI mid-term forward price breaking up. Inflection point shifting higher. Rigs being kicked out at WTI $50-51/b
Ch3: Brent crude 1 to 18 mth time spread – Increasing backwardation as inventories falls
Stronger backwardation allows the 1mth contract to rise higher without stimulating US shale production on the forward WTI curve
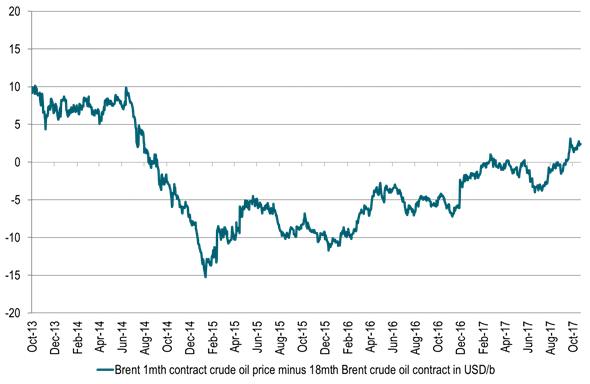
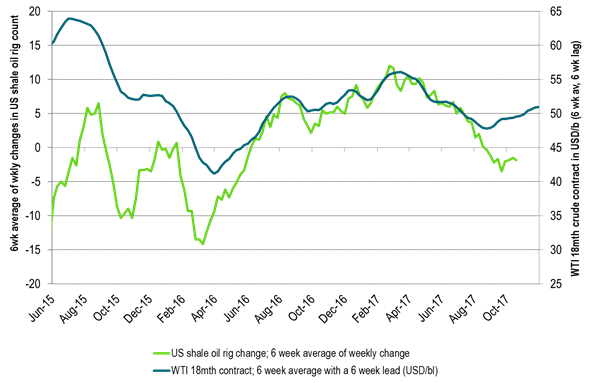
Ch4: Rolling Brent 18mth price spread to the rolling WTI 18mth crude price
The spread is expanding as the US crude production is increasing
Higher spread will allow the Brent18 mth contract to move relatively higher versus the WTI curve without stimulating US shale oil production
More to come as US crude production continues to rise
Ch5: WTI 18mth forward crude oil price. Still lots of room on the upside before getting back to ytd high
Ch6: Crude oil forward curves. Brent in backwardation, more to come. Front end WTI in front end contango to flip into front end backwardation
Ch7: Brent 1mth to WTI 1mth contract price spread makes a jump to $6/b
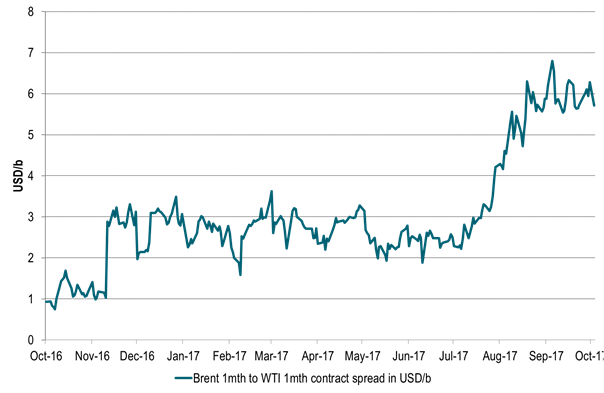
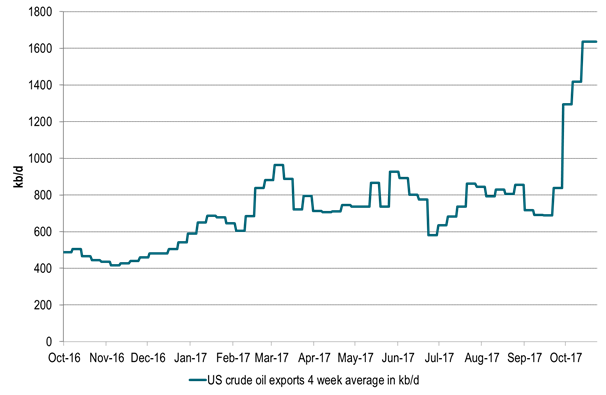
Ch7: Resulting in a big jump in US crude oil exports
This will drain US crude inventories and flip front end WTI contango into backwardation
Kind regards
Bjarne Schieldrop
Chief analyst, Commodities
SEB Markets
Merchant Banking

The latest weekly report from the US DOE showed a substantial drawdown across key petroleum categories, adding more upside potential to the fundamental picture.

Commercial crude inventories (excl. SPR) fell by 5.8 million barrels, bringing total inventories down to 415.1 million barrels. Now sitting 11% below the five-year seasonal norm and placed in the lowest 2015-2022 range (see picture below).
Product inventories also tightened further last week. Gasoline inventories declined by 2.1 million barrels, with reductions seen in both finished gasoline and blending components. Current gasoline levels are about 3% below the five-year average for this time of year.
Among products, the most notable move came in diesel, where inventories dropped by almost 4.1 million barrels, deepening the deficit to around 20% below seasonal norms – continuing to underscore the persistent supply tightness in diesel markets.
The only area of inventory growth was in propane/propylene, which posted a significant 5.1-million-barrel build and now stands 9% above the five-year average.
Total commercial petroleum inventories (crude plus refined products) declined by 4.2 million barrels on the week, reinforcing the overall tightening of US crude and products.


A classic case of “buy the rumor, sell the news” played out in oil markets, as Brent crude has dropped sharply – down nearly USD 10 per barrel since yesterday evening – following Iran’s retaliatory strike on a U.S. air base in Qatar. The immediate reaction was: “That was it?” The strike followed a carefully calibrated, non-escalatory playbook, avoiding direct threats to energy infrastructure or disruption of shipping through the Strait of Hormuz – thus calming worst-case fears.
After Monday morning’s sharp spike to USD 81.4 per barrel, triggered by the U.S. bombing of Iranian nuclear facilities, oil prices drifted sideways in anticipation of a potential Iranian response. That response came with advance warning and caused limited physical damage. Early this morning, both the U.S. President and Iranian state media announced a ceasefire, effectively placing a lid on the immediate conflict risk – at least for now.
As a result, Brent crude has now fallen by a total of USD 12 from Monday’s peak, currently trading around USD 69 per barrel.
Looking beyond geopolitics, the market will now shift its focus to the upcoming OPEC+ meeting in early July. Saudi Arabia’s decision to increase output earlier this year – despite falling prices – has drawn renewed attention considering recent developments. Some suggest this was a response to U.S. pressure to offset potential Iranian supply losses.
However, consensus is that the move was driven more by internal OPEC+ dynamics. After years of curbing production to support prices, Riyadh had grown frustrated with quota-busting by several members (notably Kazakhstan). With Saudi Arabia cutting up to 2 million barrels per day – roughly 2% of global supply – returns were diminishing, and the risk of losing market share was rising. The production increase is widely seen as an effort to reassert leadership and restore discipline within the group.
That said, the FT recently stated that, the Saudis remain wary of past missteps. In 2018, Riyadh ramped up output at Trump’s request ahead of Iran sanctions, only to see prices collapse when the U.S. granted broad waivers – triggering oversupply. Officials have reportedly made it clear they don’t intend to repeat that mistake.
The recent visit by President Trump to Saudi Arabia, which included agreements on AI, defense, and nuclear cooperation, suggests a broader strategic alignment. This has fueled speculation about a quiet “pump-for-politics” deal behind recent production moves.
Looking ahead, oil prices have now retraced the entire rally sparked by the June 13 Israel–Iran escalation. This retreat provides more political and policy space for both the U.S. and Saudi Arabia. Specifically, it makes it easier for Riyadh to scale back its three recent production hikes of 411,000 barrels each, potentially returning to more moderate increases of 137,000 barrels for August and September.
In short: with no major loss of Iranian supply to the market, OPEC+ – led by Saudi Arabia – no longer needs to compensate for a disruption that hasn’t materialized, especially not to please the U.S. at the cost of its own market strategy. As the Saudis themselves have signaled, they are unlikely to repeat previous mistakes.
Conclusion: With Brent now in the high USD 60s, buying oil looks fundamentally justified. The geopolitical premium has deflated, but tensions between Israel and Iran remain unresolved – and the risk of missteps and renewed escalation still lingers. In fact, even this morning, reports have emerged of renewed missile fire despite the declared “truce.” The path forward may be calmer – but it is far from stable.
Analys
A muted price reaction. Market looks relaxed, but it is still on edge waiting for what Iran will do
Brent crossed the 80-line this morning but quickly fell back assigning limited probability for Iran choosing to close the Strait of Hormuz. Brent traded in a range of USD 70.56 – 79.04/b last week as the market fluctuated between ”Iran wants a deal” and ”US is about to attack Iran”. At the end of the week though, Donald Trump managed to convince markets (and probably also Iran) that he would make a decision within two weeks. I.e. no imminent attack. Previously when when he has talked about ”making a decision within two weeks” he has often ended up doing nothing in the end. The oil market relaxed as a result and the week ended at USD 77.01/b which is just USD 6/b above the year to date average of USD 71/b.

Brent jumped to USD 81.4/b this morning, the highest since mid-January, but then quickly fell back to a current price of USD 78.2/b which is only up 1.5% versus the close on Friday. As such the market is pricing a fairly low probability that Iran will actually close the Strait of Hormuz. Probably because it will hurt Iranian oil exports as well as the global oil market.
It was however all smoke and mirrors. Deception. The US attacked Iran on Saturday. The attack involved 125 warplanes, submarines and surface warships and 14 bunker buster bombs were dropped on Iranian nuclear sites including Fordow, Natanz and Isfahan. In response the Iranian Parliament voted in support of closing the Strait of Hormuz where some 17 mb of crude and products is transported to the global market every day plus significant volumes of LNG. This is however merely an advise to the Supreme leader Ayatollah Ali Khamenei and the Supreme National Security Council which sits with the final and actual decision.
No supply of oil is lost yet. It is about the risk of Iran closing the Strait of Hormuz or not. So far not a single drop of oil supply has been lost to the global market. The price at the moment is all about the assessed risk of loss of supply. Will Iran choose to choke of the Strait of Hormuz or not? That is the big question. It would be painful for US consumers, for Donald Trump’s voter base, for the global economy but also for Iran and its population which relies on oil exports and income from selling oil out of that Strait as well. As such it is not a no-brainer choice for Iran to close the Strait for oil exports. And looking at the il price this morning it is clear that the oil market doesn’t assign a very high probability of it happening. It is however probably well within the capability of Iran to close the Strait off with rockets, mines, air-drones and possibly sea-drones. Just look at how Ukraine has been able to control and damage the Russian Black Sea fleet.
What to do about the highly enriched uranium which has gone missing? While the US and Israel can celebrate their destruction of Iranian nuclear facilities they are also scratching their heads over what to do with the lost Iranian nuclear material. Iran had 408 kg of highly enriched uranium (IAEA). Almost weapons grade. Enough for some 10 nuclear warheads. It seems to have been transported out of Fordow before the attack this weekend.
The market is still on edge. USD 80-something/b seems sensible while we wait. The oil market reaction to this weekend’s events is very muted so far. The market is still on edge awaiting what Iran will do. Because Iran will do something. But what and when? An oil price of 80-something seems like a sensible level until something do happen.


Hur säkrar vi Sveriges tillgång till kritiska metaller och mineral i en ny geopolitisk verklighet?

Lundin Mining ska bli en av de tio största kopparproducenterna i världen

Sommarvädret styr elpriset i Sverige

Samtal om flera delar av råvarumarknaden
Tightening fundamentals – bullish inventories from DOE

Stor uppsida i Lappland Guldprospekterings aktie enligt analys
Silverpriset släpar efter guldets utveckling, har mer uppsida

Uppgången i oljepriset planade ut under helgen

Låga elpriser i sommar – men mellersta Sverige får en ökning

Mahvie Minerals växlar spår – satsar fullt ut på guld
-
 Nyheter4 veckor sedan
Stor uppsida i Lappland Guldprospekterings aktie enligt analys
-
 Nyheter4 veckor sedan
Silverpriset släpar efter guldets utveckling, har mer uppsida
-
 Nyheter3 veckor sedan
Uppgången i oljepriset planade ut under helgen
-
 Nyheter3 veckor sedan
Låga elpriser i sommar – men mellersta Sverige får en ökning
-
 Nyheter2 veckor sedan
Mahvie Minerals växlar spår – satsar fullt ut på guld
-
Analys3 veckor sedan
Very relaxed at USD 75/b. Risk barometer will likely fluctuate to higher levels with Brent into the 80ies or higher coming 2-3 weeks
-

 Nyheter1 vecka sedan
Oljan, guldet och marknadens oroande tystnad
-

 Nyheter1 vecka sedan
Jonas Lindvall är tillbaka med ett nytt oljebolag, Perthro, som ska börsnoteras