

Analys
A ”Game of Chicken”: How long do you dare to wait before buying?

The EUA market rallied 3.4% ydy and is adding another 0.5% this afternoon with EUA Dec-24 at EUR 54.2/ton. Despite the current bounce in prices we think that the ongoing sell-off in EUA prices still has another EUR 10/ton downside from here which will place the low-point of EUA Dec-24 and Dec-25 at around around EUR 45/ton. Rapidly rising natural gas inventory surplus versus normal and nat gas demand in Europe at 23% below normal will likely continue to depress nat gas prices in Europe and along with that EUA prices. The EUA price will likely struggle to break below the EUR 50/ton level, but we think it will break.

That said, our strong view is still that the deal of the year is to build strategic long positions in EUA contracts. These certificates are ”licence to operate” for all companies who are participants in the EU ETS irrespective whether it is industry, shipping, aviation or utilities. We have argued this strongly towards our corporate clients. The feedback we are getting is that many of them indeed are planning to do just that with board approvals pending. Issuance of EUAs is set to fall sharply from 2026 onward. The Market Stability Reserve (MSR) mechanism will clean out any surplus EUAs above 833 m t by 2025/26. Medium-term market outlook 2026/27 is unchanged and not impacted by current bearish market fundamentals with fair EUA price north of EUR 100/ton by then. Building strategic long position in EUAs in 2024 is not about pinpointing the low point which we think will be around EUR 45/ton, but instead all about implementing a solid strategic purchasing plan for EUAs for 2024.
The ingredients in the bottoming process will be: 1) Re-start of European industry as energy prices come down to normal, 2) Revival in nat gas demand as this happens, 3) Nat gas prices finding a floor and possibly rebounding a bit as this happens, 4) Asian nat gas demand reviving as nat gas now normally priced versus oil, 5) Strategic purchasing of EUA by market participants in the EU ETS, 6) Speculative buying of EUAs, 7) Bullish political intervention in H2-24 and 2025 as EU economies revive on cheap energy and politicians have 2024-elections behind them.
On #1 we now see calculations that aluminium smelters in Europe now are in-the-money but not restarted yet. On #2 we see that demand destruction (temp. adj.) in Europe is starting to fade a bit. On #3 we have not seen that yet. On #4 we see stronger flows of LNG to Asia. On #5 we see lots of our corporate clients planning to purchase strategically and finding current EUA prices attractive. On #6 it may be a bit early and so as well for #7.
For EU ETS participants it may be a ”Game of Chicken”: How long do you dare to wait before buying? Those who wait too long may find the carbon constrained future hard to handle.
Ydy’s short-covering rally lost some steam this morning before regaining some legs in the afternoon. The EUA Dec-24 ydy rallied 3.4% to EUR 53.97/ton in what looks like a short-covering-rally in both coal, nat gas, power and EUAs. This morning it gave almost all of the gains back again before regaining some strength in the afternoon to the point where it is now up at EUR 54.7/ton which is +1.4% vs. ydy. A weather forecast promising more seasonally normal temperatures and below normal winds could be part of the explanation.
The power market is currently the main driver and nat gas prices the most active agent. The main driver in the EUA market is the power market. When the EUA market is medium-tigh (not too loose and not too tight), then the EUA price will naturally converge towards the balancing point where the cost of coal fired electricity equals the cost of gas fired electricity. I.e. the EUA price which solves the equation: a*Coal_price + b*EUA_price = c*Gas_price + d*EUA_price where a, b, c and d are coefficients given by energy efficiency levels, emission factors and EURUSD fex forward rates. As highlighted earlier, this is not one unique EUA balancing price but a range of crosses between different efficiencies for coal power and gas power versus each other.
Coal-to-gas dynamics will eventually fade as price driver for EUAs but right now they are fully active. Eventually these dynamics will come to a halt as a price driver for the EUA price and that is when the carbon market (EU ETS) becomes so tight that all the dynamical flexibility to flex out of coal and into gas has been exhausted. At that point in time the marginal abatement cost setting the price of an EUA will move to other parts of the economy where the carbon abatement cost typically is EUR 100/ton or higher. We expect this to happen in 2026/27.
But for now it is all about the power market and the converging point where the EUA price is balancing the cost of Coal + CO2 equal to Gas + CO2 as described above. And here again it is mostly about the price of natural gas which has moved most dramatically of the pair Coal vs Gas.
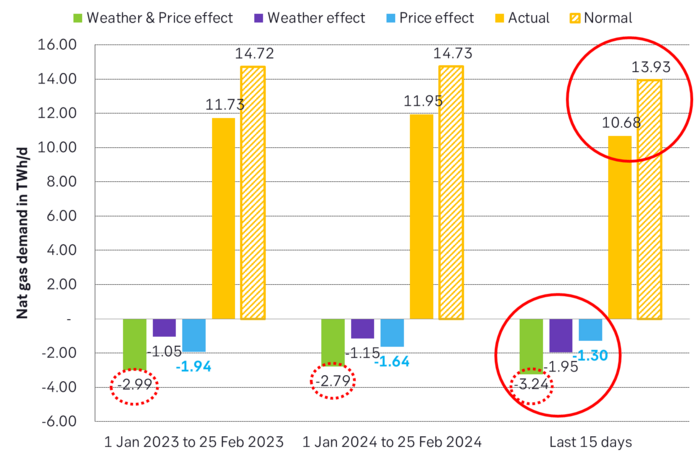
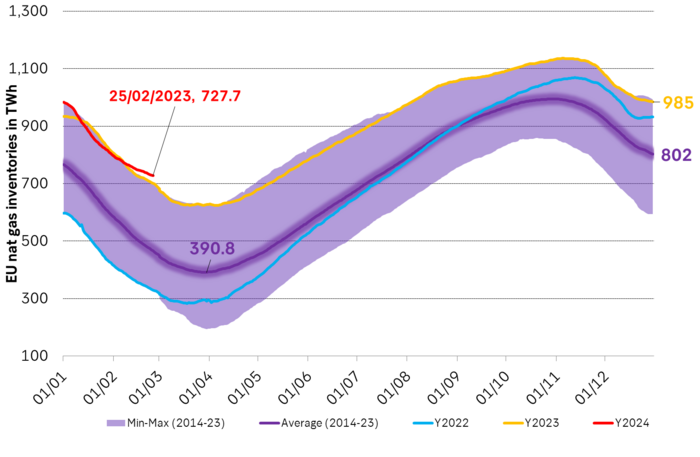
Nat gas demand in Europe is running 23% below normal and inventories are way above normal. And natural gas prices have fallen lower and lower as proper demand recovery keeps lagging the price declines. Yes, demand will eventually revive due low nat gas prices, and we can see emerging signs of that happening both in Europe and in Asia, but nat gas in Europe is still very, very weak vs. normal. But reviving demand is typically lagging in time vs price declines. Nat gas in Europe over the 15 days to 25. Feb was roughly 23% below normal this time of year in a combination of warm weather and still depressed demand. Inventories are falling much slower than normal as a result and now stand at 63.9% vs. a normal 44.4% which is 262 TWh more than normal inventories.
Bearish pressure in nat gas prices looks set to continue in the short term. Natural gas prices will naturally be under pressure to move yet lower as long as European nat gas demand revival is lagging and surplus inventory of nat gas keeps rising rapidly. And falling front-end nat gas prices typically have a guiding effect on forward nat gas prices as well.
Yet lower nat gas prices and yet lower EUA prices in the near term most likely. Nat gas prices in Europe will move yet lower regarding both spot and forwards and the effect on EUA will be continued bearish pressure on prices.
EUA’s may struggle a bit to break below the EUR 50/ton line but most likely they will. EUA prices will typically struggle a bit to cross below EUR 50/ton just because it is a significant number. But it is difficult to see that this price level won’t be broken properly as the bearish pressure continues from the nat gas side of the equation. Even if nat gas prices comes to a halt at current prices we should still see the EUA price break below the EUR 50/ton level and down towards EUR 45/ton for Dec-24 and Dec-25.
The front-year nat gas price is the most important but EUA price should move yet lower even if it TTF-2025 stays unchanged at EUR 27.7/ton. The front-year is the most important for the EUA price as that is where there is most turnover and hedging. The following attractors for the EUA forward prices is with today’s TTF forward price curve (TTF Cal-2025 = EUR 27.7/ton) and today’s forward EURUSD FX curve and with ydy’s ARA coal closing prices. What it shows is that the forward EUA attractors are down at EUR 45/ton and lower.
The front-year Coal-to-Gas differential is the most important ”attractor” for the EUA price (Cal-2025 = average of Dec-24 and Dec-25) and that is down to around EUR 45/ton with a TTF Cal-2025 price of EUR 27.7/ton. The bearish pressure on EUA prices will continue as long as the forward nat gas prices are at these price levels or lower.
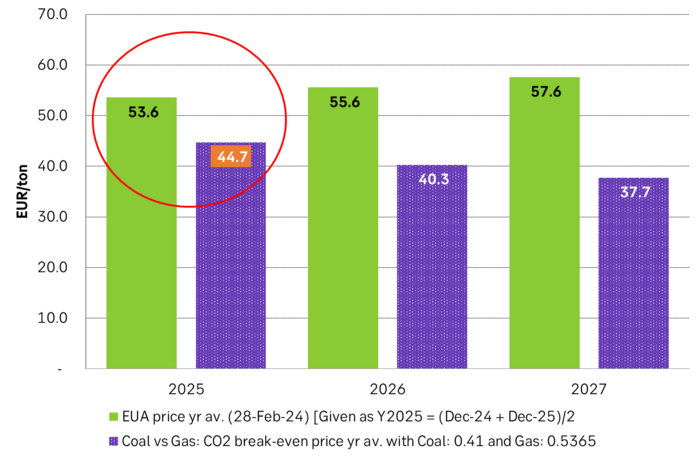
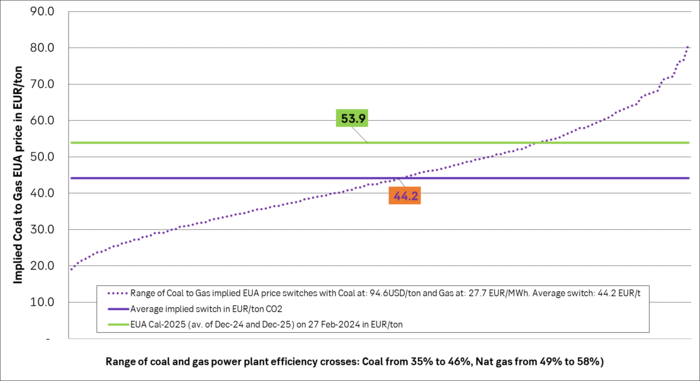
And if we take the EUA attractors from all the different energy efficiency crosses between coal and gas then we get an average attractor of EUR 44.2/ton for EUA Cal-2025 (= average of Dec-24 and Dec-25) versus a market price today of EUR 53.9/ton.
Calculating all the energy efficiency crosses between coal and gas power plants with current prices for coal and nat gas for 2025 we get an average of EUR 44.2/ton vs an EUA market price of EUR 53.9/ton. Bearish pressure on EUAs will continue as long as this is the case.
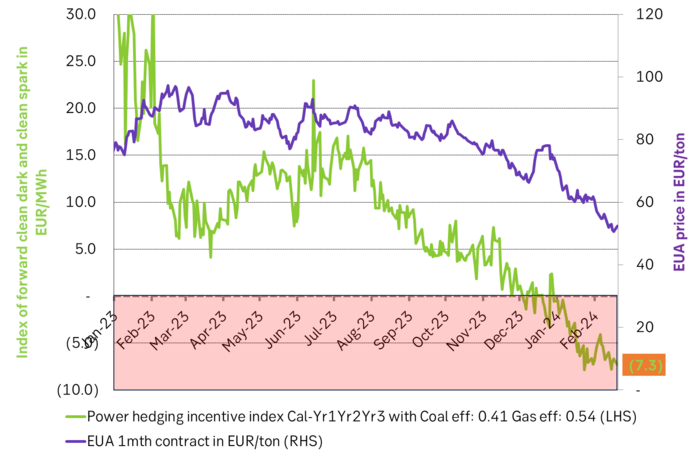
Utility hedging incentive index still deeply negative: Utilities have no incentive currently to buy coal, gas and EUAs forward and sell power forward against it as these forward margins are currently negative => very weak purchasing of EUAs from utilities for the time being.
Natural gas in Europe for different periods with diff between actual and normal decomposed into ”price effect” and ”weather effect”. Demand last 15 days were 23% below normal!
Natural gas inventories in Europe vs the 2014-2023 average. Surplus vs. normal is rising rapidly.
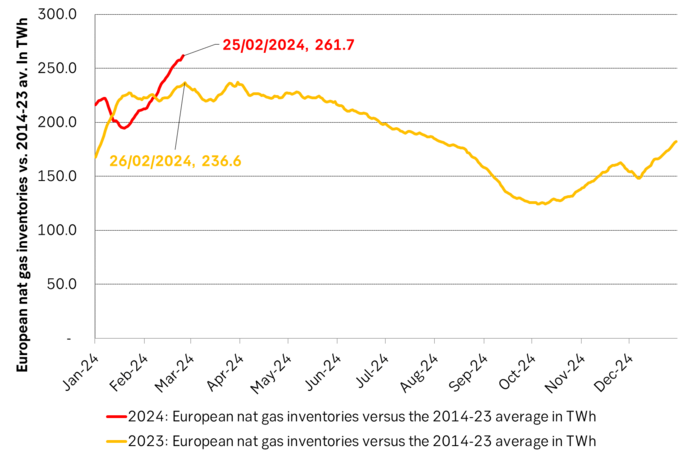
Nat gas inventories in Europe at record high for the time of year. Depressing spot prices more and more. Nat gas prices are basically shouting: ”Demand, demand, where are you?? Come and eat me!”
Some rebound but not much. Brent crude rebounded 1.5% yesterday to $65.47/b. This morning it is inching 0.2% up to $65.6/b. The lowest close last week was on Thursday at $64.11/b.

The curve structure is almost as week as it was before the weekend. The rebound we now have gotten post the message from OPEC+ over the weekend is to a large degree a rebound along the curve rather than much strengthening at the front-end of the curve. That part of the curve structure is almost as weak as it was last Thursday.
We are still on a weakening path. The message from OPEC+ over the weekend was we are still on a weakening path with rising supply from the group. It is just not as rapidly weakening as was feared ahead of the weekend when a quota hike of 500 kb/d/mth for November was discussed.
The Brent curve is on its way to full contango with Brent dipping into the $50ies/b. Thus the ongoing weakening we have had in the crude curve since the start of the year, and especially since early June, will continue until the Brent crude oil forward curve is in full contango along with visibly rising US and OECD oil inventories. The front-month Brent contract will then flip down towards the $60/b-line and below into the $50ies/b.
At what point will OPEC+ turn to cuts? The big question then becomes: When will OPEC+ turn around to make some cuts? At what (price) point will they choose to stabilize the market? Because for sure they will. Higher oil inventories, some more shedding of drilling rigs in US shale and Brent into the 50ies somewhere is probably where the group will step in.
There is nothing we have seen from the group so far which indicates that they will close their eyes, let the world drown in oil and the oil price crash to $40/b or below.
The message from OPEC+ is also about balance and stability. The world won’t drown in oil in 2026. The message from the group as far as we manage to interpret it is twofold: 1) Taking back market share which requires a lower price for non-OPEC+ to back off a bit, and 2) Oil market stability and balance. It is not just about 1. Thus fretting about how we are all going to drown in oil in 2026 is totally off the mark by just focusing on point 1.
When to buy cal 2026? Before Christmas when Brent hits $55/b and before OPEC+ holds its last meeting of the year which is likely to be in early December.
Brent crude oil prices have rebounded a bit along the forward curve. Not much strengthening in the structure of the curve. The front-end backwardation is not much stronger today than on its weakest level so far this year which was on Thursday last week.

The front-end backwardation fell to its weakest level so far this year on Thursday last week. A slight pickup yesterday and today, but still very close to the weakest year to date. More oil from OPEC+ in the coming months and softer demand and rising inventories. We are heading for yet softer levels.

Down to the lowest since early May. Brent crude has fallen sharply the latest four days. It closed at USD 64.11/b yesterday which is the lowest since early May. It is staging a 1.3% rebound this morning along with gains in both equities and industrial metals with an added touch of support from a softer USD on top.
What stands out the most to us this week is the collapse in the Dubai one to three months time-spread.
Dubai is medium sour crude. OPEC+ is in general medium sour crude production. Asian refineries are predominantly designed to process medium sour crude. So Dubai is the real measure of the balance between OPEC+ holding back or not versus Asian oil demand for consumption and stock building.
A sharp weakening of the front-end of the Dubai curve. The front-end of the Dubai crude curve has been holding out very solidly throughout this summer while the front-end of the Brent and WTI curves have been steadily softening. But the strength in the Dubai curve in our view was carrying the crude oil market in general. A source of strength in the crude oil market. The core of the strength.
The now finally sharp decline of the front-end of the Dubai crude curve is thus a strong shift. Weakness in the Dubai crude marker is weakness in the core of the oil market. The core which has helped to hold the oil market elevated.
Facts supports the weakening. Add in facts of Iraq lifting production from Kurdistan through Turkey. Saudi Arabia lifting production to 10 mb/d in September (normal production level) and lifting exports as well as domestic demand for oil for power for air con is fading along with summer heat. Add also in counter seasonal rise in US crude and product stocks last week. US oil stocks usually decline by 1.3 mb/week this time of year. Last week they instead rose 6.4 mb/week (+7.2 mb if including SPR). Total US commercial oil stocks are now only 2.1 mb below the 2015-19 seasonal average. US oil stocks normally decline from now to Christmas. If they instead continue to rise, then it will be strongly counter seasonal rise and will create a very strong bearish pressure on oil prices.
Will OPEC+ lift its voluntary quotas by zero, 137 kb/d, 500 kb/d or 1.5 mb/d? On Sunday of course OPEC+ will decide on how much to unwind of the remaining 1.5 mb/d of voluntary quotas for November. Will it be 137 kb/d yet again as for October? Will it be 500 kb/d as was talked about earlier this week? Or will it be a full unwind in one go of 1.5 mb/d? We think most likely now it will be at least 500 kb/d and possibly a full unwind. We discussed this in a not earlier this week: ”500 kb/d of voluntary quotas in October. But a full unwind of 1.5 mb/d”
The strength in the front-end of the Dubai curve held out through summer while Brent and WTI curve structures weakened steadily. That core strength helped to keep flat crude oil prices elevated close to the 70-line. Now also the Dubai curve has given in.

Brent crude oil forward curves

Total US commercial stocks now close to normal. Counter seasonal rise last week. Rest of year?

Total US crude and product stocks on a steady trend higher.

Analys
OPEC+ will likely unwind 500 kb/d of voluntary quotas in October. But a full unwind of 1.5 mb/d in one go could be in the cards
Down to mid-60ies as Iraq lifts production while Saudi may be tired of voluntary cut frugality. The Brent December contract dropped 1.6% yesterday to USD 66.03/b. This morning it is down another 0.3% to USD 65.8/b. The drop in the price came on the back of the combined news that Iraq has resumed 190 kb/d of production in Kurdistan with exports through Turkey while OPEC+ delegates send signals that the group will unwind the remaining 1.65 mb/d (less the 137 kb/d in October) of voluntary cuts at a pace of 500 kb/d per month pace.
Signals of accelerated unwind and Iraqi increase may be connected. Russia, Kazakhstan and Iraq were main offenders versus the voluntary quotas they had agreed to follow. Russia had a production ’debt’ (cumulative overproduction versus quota) of close to 90 mb in March this year while Kazakhstan had a ’debt’ of about 60 mb and the same for Iraq. This apparently made Saudi Arabia angry this spring. Why should Saudi Arabia hold back if the other voluntary cutters were just freeriding? Thus the sudden rapid unwinding of voluntary cuts. That is at least one angle of explanations for the accelerated unwinding.
If the offenders with production debts then refrained from lifting production as the voluntary cuts were rapidly unwinded, then they could ’pay back’ their ’debts’ as they would under-produce versus the new and steadily higher quotas.
Forget about Kazakhstan. Its production was just too far above the quotas with no hope that the country would hold back production due to cross-ownership of oil assets by international oil companies. But Russia and Iraq should be able to do it.
Iraqi cumulative overproduction versus quotas could reach 85-90 mb in October. Iraq has however steadily continued to overproduce by 3-5 mb per month. In July its new and gradually higher quota came close to equal with a cumulative overproduction of only 0.6 mb that month. In August again however its production had an overshoot of 100 kb/d or 3.1 mb for the month. Its cumulative production debt had then risen to close to 80 mb. We don’t know for September yet. But looking at October we now know that its production will likely average close to 4.5 mb/d due to the revival of 190 kb/d of production in Kurdistan. Its quota however will only be 4.24 mb/d. Its overproduction in October will thus likely be around 250 kb/d above its quota with its production debt rising another 7-8 mb to a total of close to 90 mb.
Again, why should Saudi Arabia be frugal while Iraq is freeriding. Better to get rid of the voluntary quotas as quickly as possible and then start all over with clean sheets.
Unwinding the remaining 1.513 mb/d in one go in October? If OPEC+ unwinds the remaining 1.513 mb/d of voluntary cuts in one big go in October, then Iraq’s quota will be around 4.4 mb/d for October versus its likely production of close to 4.5 mb/d for the coming month..
OPEC+ should thus unwind the remaining 1.513 mb/d (1.65 – 0.137 mb/d) in one go for October in order for the quota of Iraq to be able to keep track with Iraq’s actual production increase.
October 5 will show how it plays out. But a quota unwind of at least 500 kb/d for Oct seems likely. An overall increase of at least 500 kb/d in the voluntary quota for October looks likely. But it could be the whole 1.513 mb/d in one go. If the increase in the quota is ’only’ 500 kb/d then Iraqi cumulative production will still rise by 5.7 mb to a total of 85 mb in October.
Iraqi production debt versus quotas will likely rise by 5.7 mb in October if OPEC+ only lifts the overall quota by 500 kb/d in October. Here assuming historical production debt did not rise in September. That Iraq lifts its production by 190 kb/d in October to 4.47 mb/d (August level + 190 kb/d) and that OPEC+ unwinds 500 kb/d of the remining quotas in October when they decide on this on 5 October.


Oljepriset faller efter ny handelskonflikt mellan USA och Kina

Christian Kopfer kommenterar guld, koppar, olja och stål, samt några råvarubolag

Silver spränger den magiska gränsen, kostar nu över 50 USD per uns

Blykalla, Evroc och Studsvik vill bygga kärnkraftsdrivna datacenter i Sverige

Toppmöte om framtidens kärnkraft runt Östersjön hölls idag

Mahvie Minerals i en guldtrend
Volatile but going nowhere. Brent crude circles USD 66 as market weighs surplus vs risk

Aktier i guldbolag laggar priset på guld

Kinas elproduktion slog nytt rekord i augusti, vilket även kolkraft gjorde

Tyskland har så höga elpriser att företag inte har råd att använda elektricitet
-
 Nyheter4 veckor sedan
Mahvie Minerals i en guldtrend
-
Analys4 veckor sedan
Volatile but going nowhere. Brent crude circles USD 66 as market weighs surplus vs risk
-
 Nyheter4 veckor sedan
Aktier i guldbolag laggar priset på guld
-
 Nyheter4 veckor sedan
Kinas elproduktion slog nytt rekord i augusti, vilket även kolkraft gjorde
-
Nyheter4 veckor sedan
Tyskland har så höga elpriser att företag inte har råd att använda elektricitet
-

 Nyheter4 veckor sedan
Guld når sin högsta nivå någonsin, nu även justerat för inflation
-

 Nyheter4 veckor sedan
Det stigande guldpriset en utmaning för smyckesköpare
-
Analys4 veckor sedan
Brent crude ticks higher on tension, but market structure stays soft