Analys
SEB – Jordbruksprodukter, vecka 50
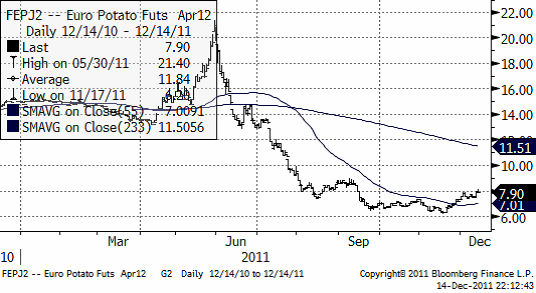
 I detta det sista veckobrevet för 2011 om marknaderna för jordbruksprodukter kan vi summera året. Det senaste året har priset på kvarnvete sjunkit med 23%, rapsfrö med 12%. Mjölkpriset har stigit med 35% och urea med 52%. Tack vare gynnsamt väder har priset på potatis fallit med 71% på Eurexbörsen i Frankfurt. Dollarn är upp med 3% mot svenska kronor och euron är oförändrad, faktiskt.
Konjunkturoron och med den oron för svagare efterfrågan på mat tynger marknaderna just nu. Precis som väntat åstadkom EU-ledarna ingenting, vilket gick upp för marknaden på måndagen när stora kursfall noterades på råvaru-, kapital- och kreditmarknader i hela världen. Det hela sjönk in ordentligt på onsdagen, när panikförsäljning startade i guldmarknaden och sedan spred sig till oljemarknaden och slutligen till hela råvarumarknaden. OPEC kom under onsdagens möte i Wien fram till att öka produktionen av olja (höja produktionstaket). Det hjälpte inte upp situationen på marknaden.
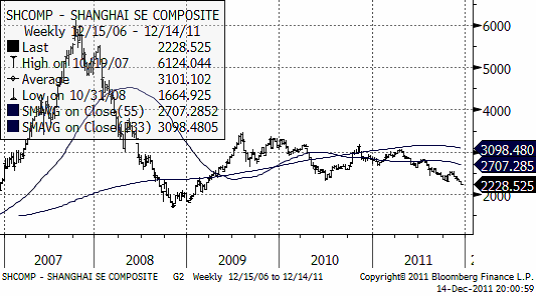
Den ledande kinesiska websidan för fastighetsbranschen sade i måndags att antalet fastighetsaffärer har fallit mer än 50% i 13 av de 35 största städerna och sjunkit i 27 av dem. Kinas ekonomi bromsar in och Shanghaibörsens aktieindex noterade ett kursfall i onsdags till den lägsta nivån på mer än 2 år.
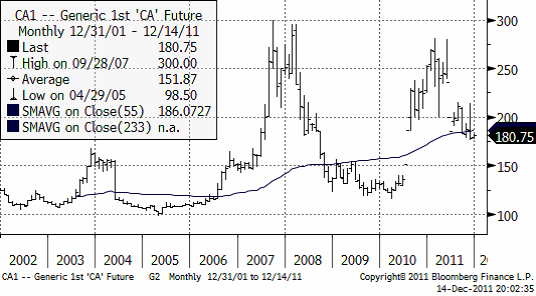
Nedan ser vi vetepriset på Matif de senaste tio åren. Priset är faktiskt ganska högt ännu i ett historiskt perspektiv och det är fortfarande attraktiva priser att säkra framtida försäljning till genom att sälja terminskontrakt.
Vete
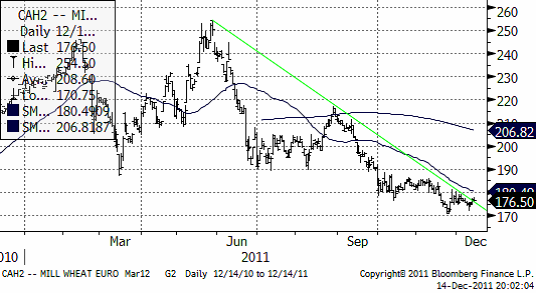
Terminspriset på Matif-vete (mars) ligger i en stadig trend nedåt.
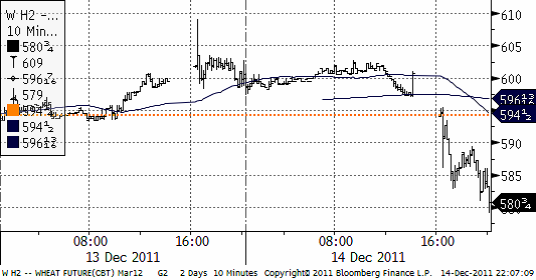
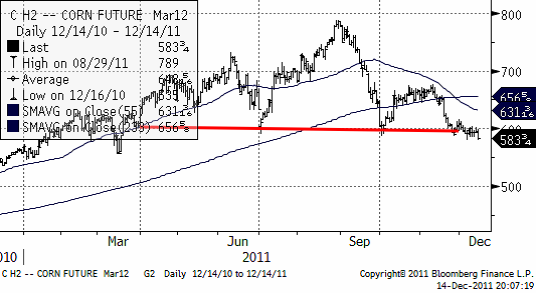
När handeln öppnade på CBOT i onsdags eftermiddag satta kursfallet fart. Priset för mars-leverans föll från 600 cent / bushel ner till 580 cent, som vi ser i diagrammet nedan.
Fredagens WASDE rapport bjöd inte på några större överraskningar då marknaden förväntade sig en höjning av estimaten för produktion samt utgående lager. Några dagar innan hade dessutom FAO kommit med sin decemberrapport där man justerade upp den globala vete produktionen till rekordhöga 694.8 mt, vilket är en ökning med 6.5% jämfört med 2010 och 10 mt mer än den tidigare högsta nivån från 2009.
 Den globala vete produktionen justerades upp 5.7 mt till en all-time-high på 688.97 mt, där USDA höjer sina estimat för Argentina, Australien, Kanada och Kina medan estimaten för Nordafrika sänks något.
Produktionen för EU-27 noterades oförändrad (137.49 mt) från föregående rapport. Även produktionen i Ryssland och Kazakhstan var oförändrad (56 mt resp 21 mt) medan FAO tidigare i veckan estimerade produktionen till 58 mt resp 24 mt för dessa länder.
Utgående lager (world wheat ending stocks) för 2011/12 justeras upp till 208.52 mt jämfört med 202.60 mt för en månad sedan. Detta gör att vi nu börjar närma oss historiska rekordnivåer. Intressant var också utgående lager för USA. Innan rapporten förväntade sig marknaden en snittsiffra på ca 830 miljoner bushels, en liten förändring från novembers 828 miljoner bushels, men när rapporten kom hade USDA justerat upp siffran med 50 miljoner och landade på 878 miljoner till följd av en nedjustering på 50 miljoner bushels för estimerad export.
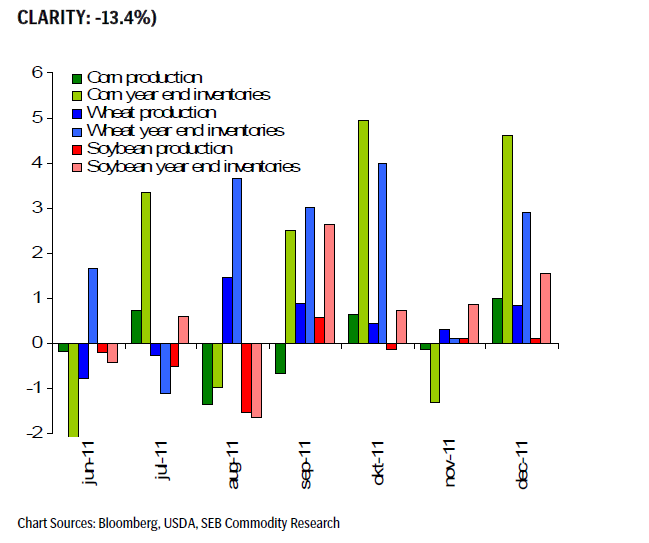
Terminspriserna sjönk som en första reaktion på WASDE-rapporten för att sedan återhämtade sig trots att rapporten var starkt ”bearish” för vetet med rekordskördar, höga lagernivåer och minskad export. Vi ser i grafen nedan (procentuell förändring) att detta är femte månaden i följd som USDA har reviderat upp produktionen och utgående lager för vete!
PRODUCTION AND INVENTORY ESTIMATE
REVISIONS
(WASDE, MONTHLY DATA, %, JUNE CORN INV. EST. CUT FOR
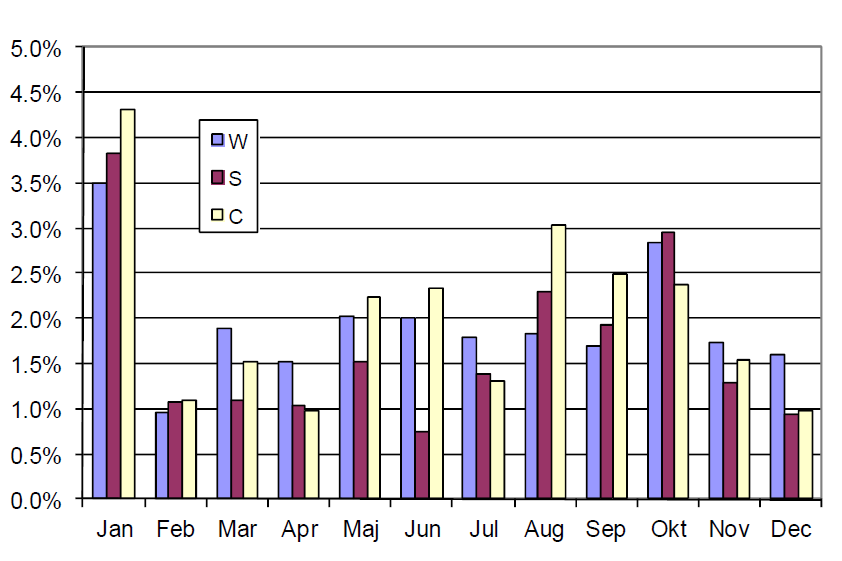
Men redan nu börjar marknaden att blicka fram emot januaris WASDE-rapport. Det är den rapportsom brukar ge de största prisrörelserna när den kommer ut:
Genomsnittlig prisrörelse på WASDE-rapporteringsdagar sedan 2002 (10 år):
I fredags publicerade också FranceAgriMer sina arealprognoser för nästa säsong där man räknar med följande ökningar av arealen; vete (+1,61%), durumvete (2,79%), korn (0,91%) och raps (+1,75%). Frankrike är EU:s största producent och exportör av vete.
Enligt Coceral kommer den europeiska (EU-27) vete produktionen att uppgå till 129.64 mt i år, vilket är en justering från 128.39 mt från förra månaden.
Egyptens GASC köpte 180,000 ton vete i tisdags med jämn fördelning mellan Ryssland, Argentina och… Frankrike! Priset på det franska vetet som vann budgivningen kom in på 240.50 usd / ton, vilket var ca 3.50 usd / ton billigare än det ryska vetet på 243.98 usd / ton (FOB). Ryssland har dock ett övertag mot Frankrike vad gäller frakt (kostnad) till Egypten. Argentina erbjuder fortfarande det billigaste vetet (226.19 usd / ton) men har dyrare fraktkostnad emot sig.
Nämnvärt är också att US White Wheat fanns med i denna budgivning, men exkluderades då leveransen inte avsåg 60,000 ton. Vi ser dock att gapet i prisskillnaderna nu minskar och att både det franska och amerikanska vetet börjar bli konkurrenskraftigt mot FSU länderna.
Även det kraftiga fallet i euron ger stöd åt jordbruksprodukterna på Matif och gör att Europa åter kan konkurrera på den internationella marknaden.
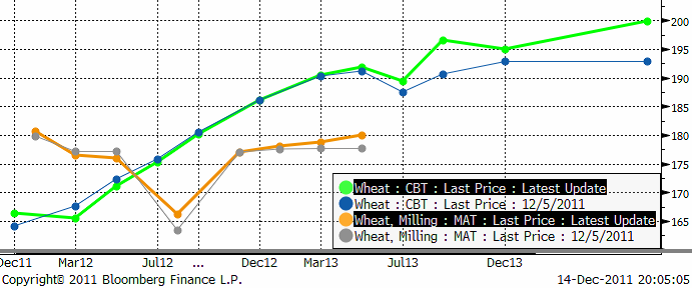
Nedan ser vi terminskurvan för Chicagovete och Matif nu och för en vecka sedan. De ”feta” kurvorna är de aktuella. De ”smala” är förra veckans. Matif är nästan inte förändrat alls, medan priserna liksom förra veckan gått upp i Chicago – för längre löptider. Bakom ligger oro för kommande skörd pga La Niña kanske och förmodligen också för att räntorna (som man kan låna till) är högre.
Allt talar för att Matif-vete faller ner i första hand till 150 – 160 – euro-nivån.
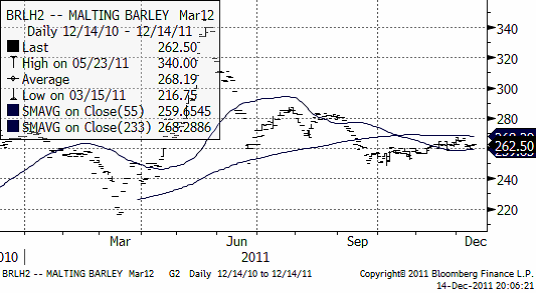
Maltkorn
Maltkornsmarknaden har behållit sin styrka relativt andra spannmål med marsleverans på Matif på 262 euro per ton.
I Ryssland försöker regeringen att stödja produktionen av maltkorn genom subventioner av inköp av utsäde och bekämpningsmedel. Även om Ryssland producerar 17 MMT foderkorn så importeras det 400 000 ton maltkorn varje år sedan 2007 för att möta de behov som finns.
Potatis
Priset på potatis av årets skörd fortsatte stiga i veckan, ännu en vecka. Rapporten kom från Jordbruksverket tidigare i veckan om en betydligt högre skörd av matpotatis i Sverige, men informationen nådde alltså marknaden redan på försommaren, när priserna började falla. Nedan ser vi kursdiagrammet på europeisk potatis, som handlas på Eurex; terminen avser leverans april 2012.
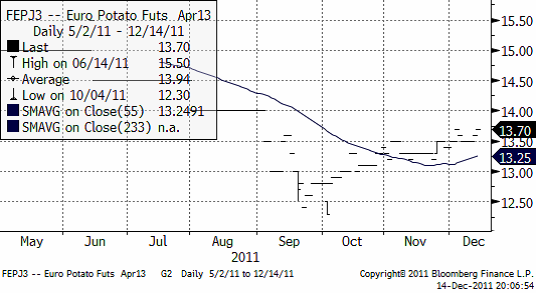
Priset för leverans i april 2013 ligger betydligt högre på 13.37 euro per deciton och har också stigit ännu mer den senaste tiden.
Majs
Majspriset föll liksom det mesta andra kraftigt när börserna öppnade på onsdagseftermiddagen. Den 12 december rapporterade Martell Crop Projections att tork-stressen ökat i Argentina och södra Brasiliens majsfält. De skriver
”Growing conditions have become increasingly stressful in southern South America the past 2-3 weeks with intense drying. The crop area affected by emerging drought includes Argentina’s eastern grain belt in Buenos Aires, Entre Rios and Santa Fe. La Nina is the suspected culprit. Uruguay and Rio Grande do Sul in Brazil also are very dry.”
Kopplingen till etanol och oron kring Irans kärnvapenprogram och dess potentiellt explosiva effekt på oljepriset gör majshandlare oroliga att sälja, fast mycket annat tyder på att priset borde vara lägre.
Nedan ser vi marskontraktet på CBOT, där priset just fallit ner från 600-cent-nivån.
Tekniskt ser det ut som om priset skulle kunna falla ner mot 500 cent.
Sojabönor
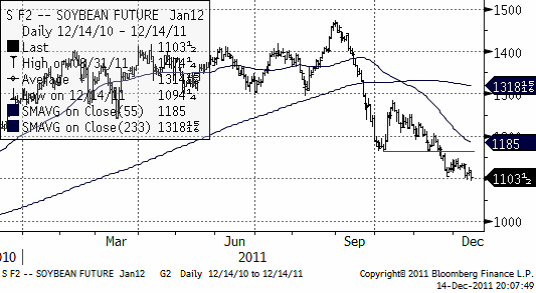
Priset på sojabönor befinner sig i en sjunkande trend. Vi sade i förra veckan att den lilla rekylen uppåt var ett säljtillfälle och det visade sig rätt. Priset ligger just nu på 1100 cent, som har utgjort ett stöd. Troligtvis bryter trenden nedåt igenom nivån och då blir nästa nivå som kan utgöra ett stöd, den jämna siffran 1000 cent.
Vi är negativa ur tekniskt perspektiv de närmaste tre månaderna.
Raps
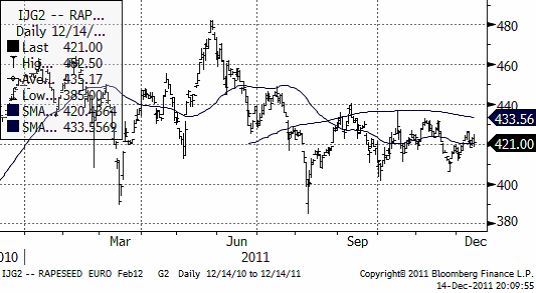
Priset på raps har gått upp och håller sig starkt med stöd från den svaga euron.
Uppgifter om att Hormuz-sundet skulle stängas på grund av militärövning (vilket förnekades av Irans utrikesdepartement) och nyheten om en attack mot en oljeledning i Irak fick råoljepriset att stiga under tisdagen och drog med sig priset på raps. Priset har också påverkats av oro över de extremt torra väderförhållanden som kan komma att påverka ny skörd.
Oljepriset föll under onsdagskvällen mycket kraftigt, med mer än 4% för Brent och mer än 5% för West Texas Intermediate. Detta bör påverka rapsfröet på Matif under torsdag och fredag. Nedan ser vi priset på februariterminen på Matif.
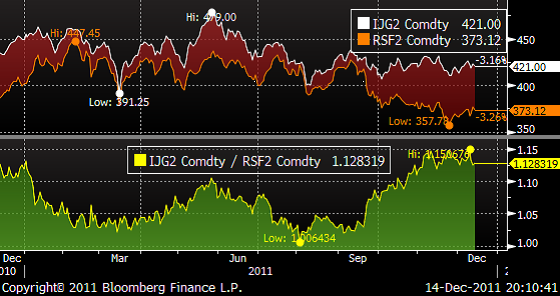
Matifraps var förra veckan 13% dyrare än kanadensisk canola och ligger kvar på samma nivå den är veckan. Raps är ovanligt dyrt.
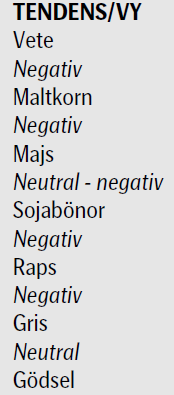
Vi har en negativ vy på Matif raps.
Mjölk
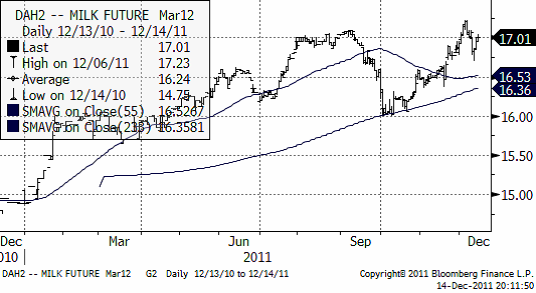
Nedan ser vi priset på marskontraktet på flytande mjölk (kontakt avräknat mot USDA:s prisindex). Priset har varit väldigt rörligt den senaste tiden. Trenden är uppåtriktad, men är vid den nivå som priset toppade vid under sensommaren. Det kan utgöra ett motstånd för ytterligare prisuppgång.
Gris
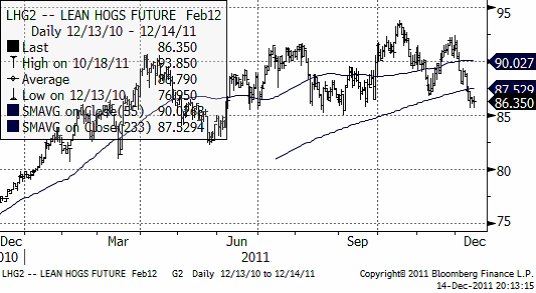
Priset på lean hogs har fallit stadigt den senaste veckan, men priset ligger ännu inom det breda prisintervall som etablerades under senvåren. 85 cent torde utgöra ett stöd, såsom botten på prisintervallet.
Valutor
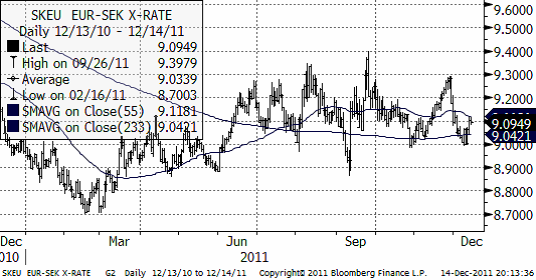
EURSEK har märkligt nog stigit upp från 9 kr. Kanske tycker marknaden att det finns anledning att tveka även om den svenska kronans värde.
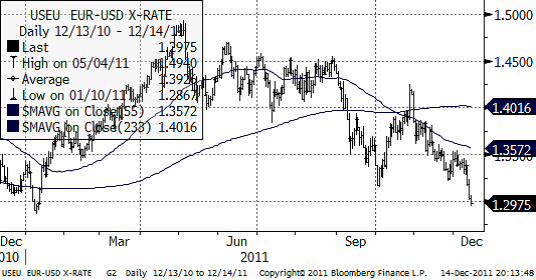
EURUSD är i en tydlig negativ trend.
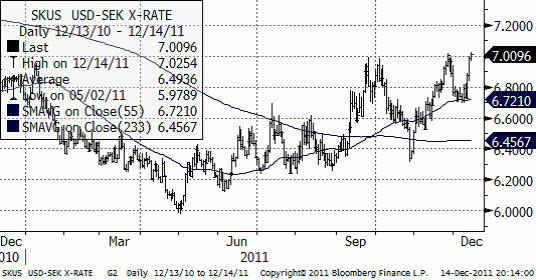
USDSEK har en stigande trend och har nått upp till heltalet 7 kr per dollar. Växelkursen har vänt ner därifrån två gånger tidigare och frågan är nu om kursen ska orka ta sig igenom den här gången.
Gödsel
Kväve
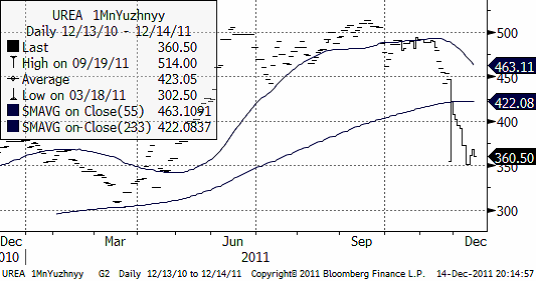
Nedan ser vi 1 månads terminspris på Urea fob Uyzhnyy. Priset har fallit kraftigt under hösten.
[box]SEB Veckobrev Jordbruksprodukter är producerat av SEB Merchant Banking och publiceras i samarbete och med tillstånd på Råvarumarknaden.se[/box]
Disclaimer
The information in this document has been compiled by SEB Merchant Banking, a division within Skandinaviska Enskilda Banken AB (publ) (“SEB”).
Opinions contained in this report represent the bank’s present opinion only and are subject to change without notice. All information contained in this report has been compiled in good faith from sources believed to be reliable. However, no representation or warranty, expressed or implied, is made with respect to the completeness or accuracy of its contents and the information is not to be relied upon as authoritative. Anyone considering taking actions based upon the content of this document is urged to base his or her investment decisions upon such investigations as he or she deems necessary. This document is being provided as information only, and no specific actions are being solicited as a result of it; to the extent permitted by law, no liability whatsoever is accepted for any direct or consequential loss arising from use of this document or its contents.
About SEB
SEB is a public company incorporated in Stockholm, Sweden, with limited liability. It is a participant at major Nordic and other European Regulated Markets and Multilateral Trading Facilities (as well as some non-European equivalent markets) for trading in financial instruments, such as markets operated by NASDAQ OMX, NYSE Euronext, London Stock Exchange, Deutsche Börse, Swiss Exchanges, Turquoise and Chi-X. SEB is authorized and regulated by Finansinspektionen in Sweden; it is authorized and subject to limited regulation by the Financial Services Authority for the conduct of designated investment business in the UK, and is subject to the provisions of relevant regulators in all other jurisdictions where SEB conducts operations. SEB Merchant Banking. All rights reserved.
Analys
Brent slips to USD 64.5: sanction doubts and OPEC focus reduce gains

After reaching USD 66.78 per barrel on Friday afternoon, Brent crude has since traded mostly sideways, yet dipping lower this morning. The market appears to be consolidating last week’s sharp gains, with Brent now easing back to around USD 64.5 per barrel, roughly USD 2.3 below Friday’s peak but still well above last Monday’s USD 60.07 low.

The rebound last week was initially driven by Washington’s decision to blacklist Russia’s two largest oil producers, Rosneft and Lukoil, which together account for nearly half of the country’s crude exports. The move sparked a wave of risk repricing and short covering, with Brent rallying almost 10% from Monday’s trough. Yet, the market is now questioning the actual effectiveness of the sanctions. While a full blacklisting sounds dramatic, the mechanisms for enforcement remain unclear, and so far, there are no signs of disrupted Russian flows.
In practice, these measures are unlikely to materially affect Russian supply or revenues in the near term, yet we have now seen Indian refiners reportedly paused new orders for Russian barrels pending government guidance. BPCL is expected to issue a replacement spot tender within 7–10 days, potentially sourcing crude from non-sanctioned entities instead. Meanwhile, Lukoil is exploring the sale of overseas assets, and Germany has requested extra time for Rosneft to reorganize its refining interests in the country.
The broader market focus is now shifting toward this week’s Fed decision and Sunday’s OPEC+ meeting, both seen as potential short-term price drivers. Renewed U.S.-China trade dialogue ahead of Trump’s meeting with President Xi Jinping in South Korea is also lending some macro support.
In short, while the White House’s latest move adds to geopolitical noise, it does not yet represent a true supply disruption. If Washington had intended to apply real pressure, it could have advanced the long-standing Senate bill enforcing secondary sanctions on buyers of Russian oil, legislation with overwhelming backing, or delivered more direct military assistance to Ukraine. Instead, the latest action looks more like political theatre than policy shift, projecting toughness without imposing material economic pain.
Still, while the immediate supply impact appears limited, the episode has refocused attention on Russia’s export vulnerability and underscored the ongoing geopolitical risk premium in the oil market. Combined with counter-seasonal draws in U.S. crude inventories, record-high barrels at sea, and ongoing uncertainty ahead of the OPEC+ meeting, short-term fundamentals remain somewhat tighter than the broader surplus story suggests.
i.e., the sanctions may prove mostly symbolic, but the combination of geopolitics and uneven inventory draws is likely to keep Brent volatile around the low to mid-USD 60s in the days ahead.
Analys
Sell the rally. Trump has become predictable in his unpredictability

Hesitant today. Brent jumped to an intraday high of $66.36/b yesterday after having touched an intraday low of $60.07/b on Monday as Indian and Chinese buyers cancelled some Russian oil purchases and instead redirected their purchases towards the Middle East due to the news US sanctions. Brent is falling back 0.4% this morning to $65.8/b.

It’s our strong view that the only sensible thing is to sell this rally. In all Trump’s unpredictability he has become increasingly predictable. Again and again he has rumbled about how he is going to be tough on Putin. Punish Putin if he won’t agree to peace in Ukraine. Recent rumbling was about the Tomahawk rockets which Trump threatened on 10 October and 12 October to sell/send to Ukraine. Then on 17 October he said that ”the U.S. didn’t want to give away weapons (Tomahawks) it needs”.
All of Trump’s threats towards Putin have been hot air. So far Trump’s threats have been all hot air and threats which later have evaporated after ”great talks with Putin”. After all these repetitions it is very hard to believe that this time will be any different. The new sanctions won’t take effect before 21. November. Trump has already said that: ”he was hoping that these new sanctions would be very short-lived in any case”. Come 21. November these new sanctions will either evaporate like all the other threats Trump has thrown at Putin before fading them. Or the sanctions will be postponed by another 4 weeks or 8 weeks with the appearance that Trump is even more angry with Putin. But so far Trump has done nothing that hurt Putin/Russia. We can’t imagine that this will be different. The only way forward in our view for a propre lasting peace in Ukraine is to turn Ukraine into defensive porcupine equipped with a stinging tail if need be.
China will likely stand up to Trump if new sanctions really materialize on 21 Nov. Just one country has really stood up to Trump in his tariff trade war this year: China. China has come of age and strength. I will no longer be bullied. Trump upped tariffs. China responded in kind. Trump cut China off from high-end computer chips. China put on the breaks on rare earth metals. China won’t be bullied any more and it has the power to stand up. Some Chinese state-owned companies like Sinopec have cancelled some of their Russian purchases. But China’s Foreign Ministry spokesperson Guo Jiakun has stated that China “oppose unilateral sanctions which lack a basis in international law and authorization of the UN Security Council”. Thus no one, not even the US shall unilaterally dictate China from whom they can buy oil or not. This is yet another opportunity for China to show its new strength and stand up to Trump in a show of force. Exactly how China choses to play this remains to be seen. But China won’t be bullied by over something as important as its oil purchases. So best guess here is that China will defy Trump on this. But probably China won’t need to make a bid deal over this. Firstly because these new sanctions will either evaporate as all the other threats or be postponed once we get to 21 November. Secondly because the sanctions are explicit towards US persons and companies but only ”may” be enforced versus non-US entities.
Sanctions is not a reduction in global supply of oil. Just some added layer of friction. Anyhow, the new sanctions won’t reduce the supply of Russian crude oil to the market. It will only increase the friction in the market with yet more need for the shadow fleet and ship to ship transfer of Russian oil to dodge the sanctions. If they materialize at all.
The jump in crude oil prices is probably due to redirections of crude purchases to the Mid-East and not because all speculators are now turned bullish. Has oil rallied because all speculators now suddenly have turned bullish? We don’t think so. Brent crude has probably jumped because some Indian and Chinese oil purchasers of have redirected their purchases from Russia towards the Mid-East just in case the sanctions really materializes on 21 November.
Analys
Brent crude set to dip its feet into the high $50ies/b this week

Parts of the Brent crude curve dipping into the high $50ies/b. Brent crude fell 2.3% over the week to Friday. It closed the week at $61.29/b, a slight gain on the day, but also traded to a low of $60.14/b that same day and just barely avoided trading into the $50ies/b. This morning it is risk-on in equities which seems to help industrial metals a little higher. But no such luck for oil. It is down 0.8% at $60.8/b. This week looks set for Brent crude to dip its feet in the $50ies/b. The Brent 3mth contract actually traded into the high $50ies/b on Friday.

The front-end backwardation has been on a weakening foot and is now about to fully disappear. The lowest point of the crude oil curve has also moved steadily lower and lower and its discount to the 5yr contract is now $6.8/b. A solid contango. The Brent 3mth contract did actually dip into the $50ies/b intraday on Friday when it traded to a low point of $59.93/b.
More weakness to come as lots of oil at sea comes to ports. Mid-East OPEC countries have boosted exports along with lower post summer consumption and higher production. The result is highly visibly in oil at sea which increased by 17 mb to 1,311 mb over the week to Sunday. Up 185 mb since mid-August. On its way to discharge at a port somewhere over the coming month or two.
Don’t forget that the oil market path ahead is all down to OPEC+. Remember that what is playing out in the oil market now is all by design by OPEC+. The group has decided that the unwind of the voluntary cuts is what it wants to do. In a combination of meeting demand from consumers as well as taking back market share. But we need to remember that how this plays out going forward is all at the mercy of what OPEC+ decides to do. It will halt the unwinding at some point. It will revert to cuts instead of unwind at some point.
A few months with Brent at $55/b and 40-50 US shale oil rigs kicked out may be what is needed. We think OPEC+ needs to see the exit of another 40-50 drilling rigs in the US shale oil patches to set US shale oil production on a path to of a 1 mb/d year on year decline Dec-25 to Dec-26. We are not there yet. But a 2-3 months period with Brent crude averaging $55/b would probably do it.
Oil on water increased 17 mb over the week to Sunday while oil in transit increased by 23 mb. So less oil was standing still. More was moving.

Crude oil floating storage (stationary more than 7 days). Down 11 mb over week to Sunday

The lowest point of the Brent crude oil curve versus the 5yr contract. Weakest so far this year.

Crude oil 1mth to 3mth time-spreads. Dubai held out strongly through summer, but then that center of strength fell apart in late September and has been leading weakness in crude curves lower since then.

-

 Nyheter3 veckor sedan
Goldman Sachs höjer prognosen för guld, tror priset når 4900 USD
-

 Nyheter4 veckor sedan
Blykalla och amerikanska Oklo inleder ett samarbete
-

 Nyheter4 veckor sedan
Guld nära 4000 USD och silver 50 USD, därför kan de fortsätta stiga
-

 Nyheter2 veckor sedan
Leading Edge Materials är på rätt plats i rätt tid
-

 Nyheter3 veckor sedan
Nytt prisrekord, guld stiger över 4000 USD
-

 Nyheter4 veckor sedan
Ett samtal om guld, olja, koppar och stål
-

 Analys4 veckor sedan
OPEC+ will likely unwind 500 kb/d of voluntary quotas in October. But a full unwind of 1.5 mb/d in one go could be in the cards
-

 Nyheter4 veckor sedan
Neptune Energy bekräftar enorma litiumfyndigheter i Tyskland


