

Analys
The most important data point in the global oil market will be published on Friday 28 June


US crude oil production has been booming for more than a decade. Interrupted by two setbacks in response to sharp price declines. The US boom has created large waves in the global oil market and made life very difficult for OPEC(+). Brent crude has not traded below USD 70/b since Dec-2021 and over the past year, it has averaged USD 84/b. US shale oil production would typically boom with such a price level historically. However, there has been zero growth in US crude oil production from Sep-2023 to Mar-2024. This may be partially due to a cold US winter, but something fundamentally seems to have changed. We recently visited a range of US E&P and oil services companies in Houston. The general view was that there would be zero growth in US crude oil production YoY to May 2025. If so and if it also is a general shift to sideways US crude oil production beyond that point, it will be a tremendous shift for the global oil market. It will massively improve the position of OPEC+. It will also sharply change our perception of the forever booming US shale oil supply. But ”the proof is in the pudding” and that is data. More specifically the US monthly, controlled oil production data is to be published on Friday 28 June.
The most important data point in the global oil market will be published on Friday 28 June. The US EIA will then publish its monthly revised and controlled oil production data for April. Following years of booming growth, the US crude oil production has now gone sideways from September 2023 to March 2024. Is this a temporary blip in the growth curve due to a hard and cold US winter or is it the early signs of a huge, fundamental shift where US crude oil production moves from a decade of booming growth to flat-lining horizontal production?
We recently visited a range of E&P and oil services companies in Houston. The general view there was that US crude oil production will be no higher in May 2025 than it is in May 2024. I.e. zero growth.
It may sound undramatic, but if it plays out it is a huge change for the global oil market. It will significantly strengthen the position of OPEC+ and its ability to steer the oil price to a suitable level of its choosing.
The data point on Friday will tell us more about whether the companies we met are correct in their assessment of non-growth in the coming 12 months or whether production growth will accelerate yet again following a slowdown during winter.
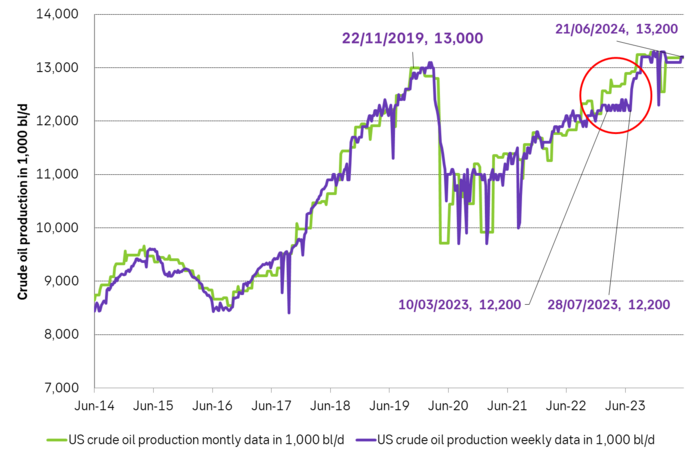
The US releases weekly estimates for its crude oil production but these are rough, temporary estimates. The market was fooled by these weekly numbers last year when the weekly numbers pointed to a steady production of around 12.2 m b/d from March to July while actual monthly data, with a substantial lag in publishing, showed that production was rising strongly.
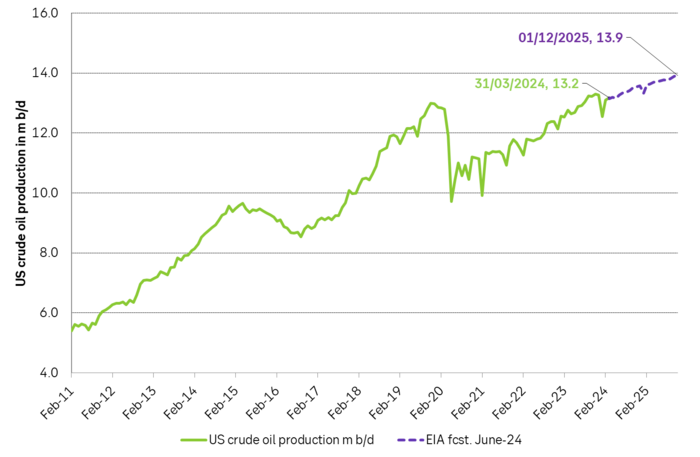
The real data are the monthly, controlled data. These data will be the ”proof of the pudding” of whether US shale oil production now is about to shift from a decade of booming growth to instead flat-line sideways or whether it will drift gradually higher as projected by the US EIA in its latest Short-Term Energy Outlook.
US crude oil production given by weekly data and monthly data. Note that the monthly, controlled data comes with a significant lag. The market was thus navigating along the weekly data which showed ”sideways at 12.2 m b/d” for a significant period last year until actual data showed otherwise with a time-lag.
If we add in Natural Gas Liquids and zoom out to include history back to 2001 we see an almost uninterrupted boom in supply since Sep 2011 with a few setbacks. At first glance, this graph gives little support to a belief that US crude oil production now suddenly will go sideways. Simple extrapolation of the graph indicates growth, growth, growth.
US crude and liquids production has boomed since September 2011
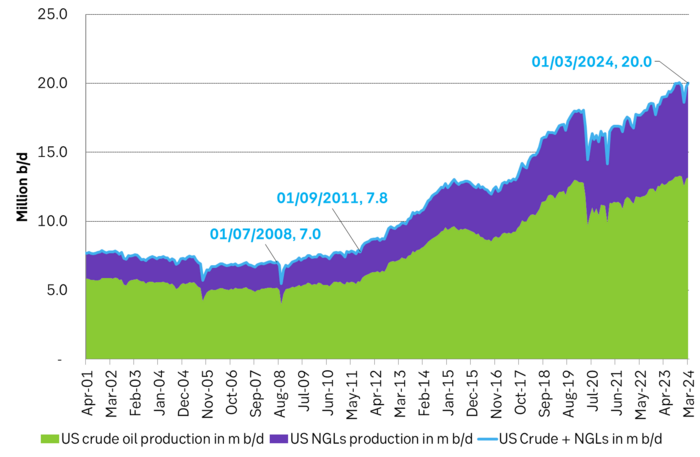
However. The latest actual data point for US crude oil production is for March with a reading of 13.18 m b/d. What stands out is that production then was still below the September level of 13.25 m b/d.
The world has gotten used to forever growing US crude oil production due to the US shale oil revolution, with shorter periods of sharp production declines as a result of sharp price declines.
But the Brent crude oil price hasn’t collapsed. Instead, it is trading solidly in the range of USD 70-80-90/b. The front-month Brent crude oil contract hasn’t closed below USD 70/b since December 2021.
Experiences from the last 15 years would imply wild production growth and activity in US shale oil production at current crude oil prices. But US crude oil production has now basically gone sideways to lower from September to March.
The big, big question is thus: Are we now witnessing the early innings of a big change in US shale oil production where we shift from booming growth to flat-lining of production?
If we zoom in we can see that US liquids production has flat-lined since September 2023. Is the flat-lining from Sep to Mar due to the cold winter so that we’ll see a revival into spring and summer or are we witnessing the early signs of a huge change in the global oil market where US crude oil production goes from booming growth to flat-line production.

The message from Houston was that there will be no growth in US crude oil production until May 2025. SEB recently visited oil and gas producers and services providers in Houston to take the pulse of the oil and gas business. Especially so the US shale oil and shale gas business. What we found was an unusually homogeneous view among the companies we met concerning both the state of the situation and the outlook. The sentiment was kind of peculiar. Everybody was making money and was kind of happy about that, but there was no enthusiasm as the growth and boom years were gone. The unanimous view was that US crude oil production would be no higher one year from now than it is today. I.e. flat-lining from here.
The arguments for flat-lining of US crude oil production here onward were many.
1) The shale oil business has ”grown up” and matured with a focus on profits rather than growth for the sake of growth.
2) Bankruptcies and M&As have consolidated the shale oil companies into larger, fewer public companies now accounting for up to 75% of total production. Investors in these companies have little interest/appetite for growth after having burned their fingers during a decade and a half of capital destruction. These investors may also be skeptical of the longevity of the US shale oil business. Better to fully utilize the current shale oil infrastructure steadily over the coming years and return profits to shareholders than to invest in yet more infrastructure capacity and growth.
3) The remaining 25% of shale oil producers which are in private hands have limited scope for growth as they lack pipeline capacity for bringing more crude oil from field to market. Associated nat gas production is also a problem/bottleneck as flaring is forbidden in many places and pipes to transport nat gas from field to market are limited.
4) The low-hanging fruits of volume productivity have been harvested. Drilling and fracking are now mostly running 24/7 and most new wells today are all ”long wells” of around 3 miles. So hard to shave off yet another day in terms of ”drilling yet faster” and the length of the wells has increasingly reached their natural optimal length.
5) The average ”rock quality” of wells drilled in the US in 2024 will be of slightly lower quality than in 2023 and 2025 will be slightly lower quality than 2024. That is not to say that the US, or more specifically the Permian basin, is quickly running out of shale oil resources. But this will be a slight headwind. There is also an increasing insight into the fact that US shale oil resources are indeed finite and that it is now time to harvest values over the coming 5-10 years. One company we met in Houston argued that US shale oil production would now move sideways for 6-7 years and then overall production decline would set in.
The US shale oil revolution can be divided into three main phases. Each phase is probably equally revolutionary as the other in terms of impact on the global oil market.
1) The boom phase. It started after 2008 but didn’t accelerate in force before the ”Arab Spring” erupted and drove the oil price to USD 110/b from 2011 to 2014. It was talked down time and time again, but it continued to boom and re-boom to the point that today it is almost impossible to envision that it won’t just continue to boom or at least grow forever.
2) The plateau phase. The low-hanging fruits of productivity growth have been harvested. The highest quality resources have been utilized. The halfway point of resources has been extracted. Consolidation, normalization, and maturity of the business has been reached. Production goes sideways.
3) The decline phase. Eventually, the resources will have been extracted to the point that production unavoidably starts to decline.
Moving from phase one to phase two may be almost as shocking for the oil market as the experience of phase 1. The discussions we had with oil producers and services companies in Houston may indicate that we may now be moving from phase one to phase two. That there will be zero shale oil production growth YoY in 2025 and that production then may go sideways for 6-7 years before phase three sets in.
US EIA June STEO report with EIA’s projection for US crude oil production to Dec-2025. Softer growth, but still growth.
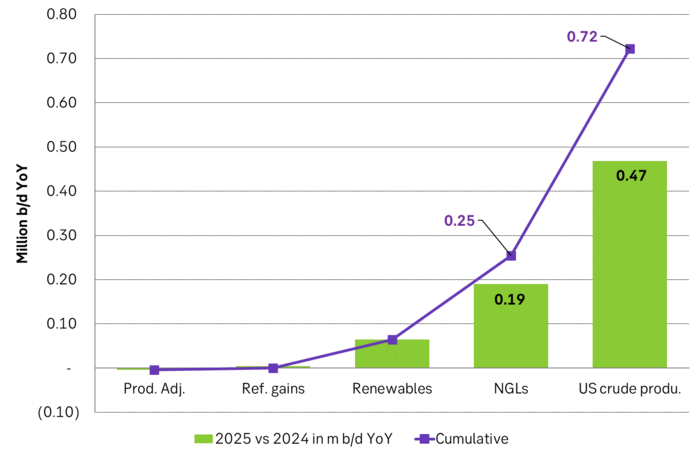
US EIA June STEO report with YoY outlook growth for 2025. Projects that US crude production will grow by 0.47 m b/d YoY in 2025 and that total liquids will grow by 720 k b/d YoY.
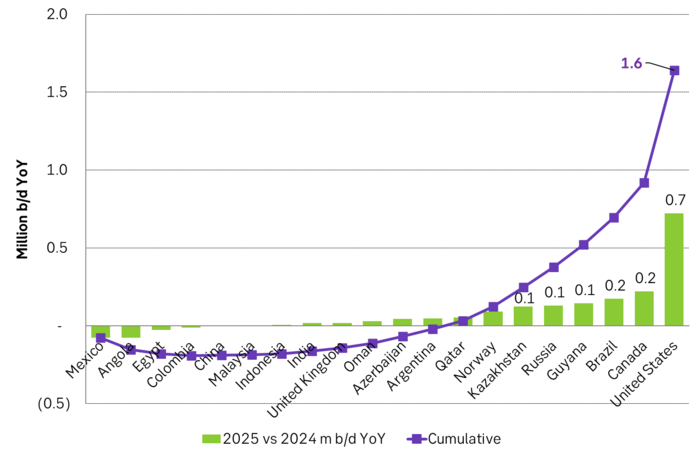
US EIA June STEO report with outlook for production growth by country in 2025. This shows how big the US production growth of 0.7 m b/d YoY really is compared to other producers around the world
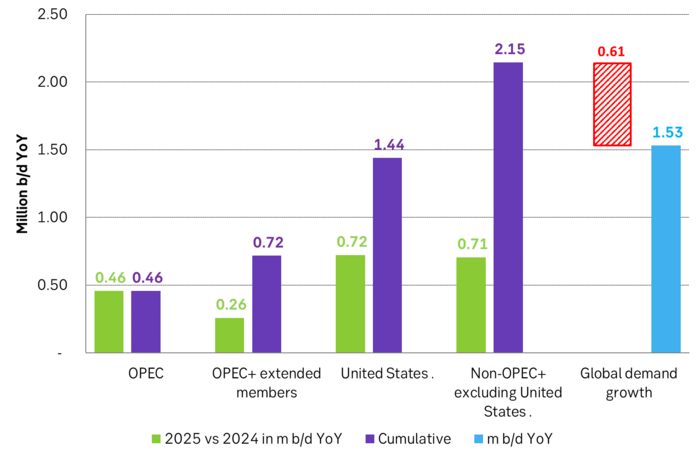
US EIA June STEO report with projected global growth in supply and demand YoY in 2025. Solid demand growth, but even strong supply growth with little room for OPEC+ to expand. Production growth by non-OPEC+ will basically cover global oil demand growth.
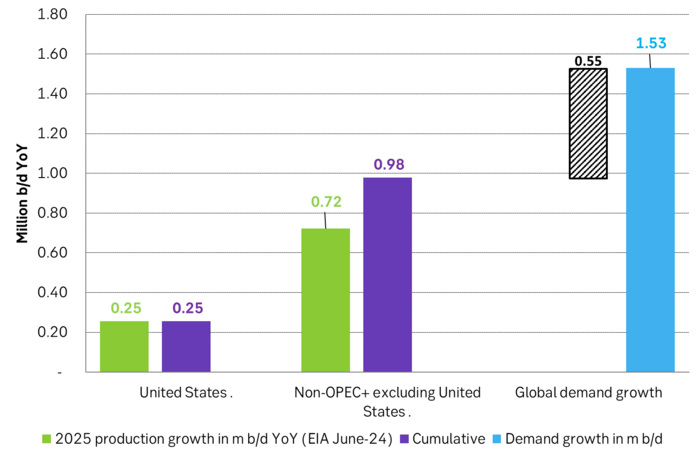
But if there instead is zero growth in US crude oil production in 2025 and the US liquids production only grows by 0.25 m b/d YoY due to NGLs and biofuels, then suddenly there is room for OPEC+ to put some of its current production cuts back into the market. Thus growth/no-growth in US shale oil production will be of huge importance for OPEC+ in 2025. If there is no growth in US shale oil then OPEC+ will have a much better position to control the oil price to where it wants it.
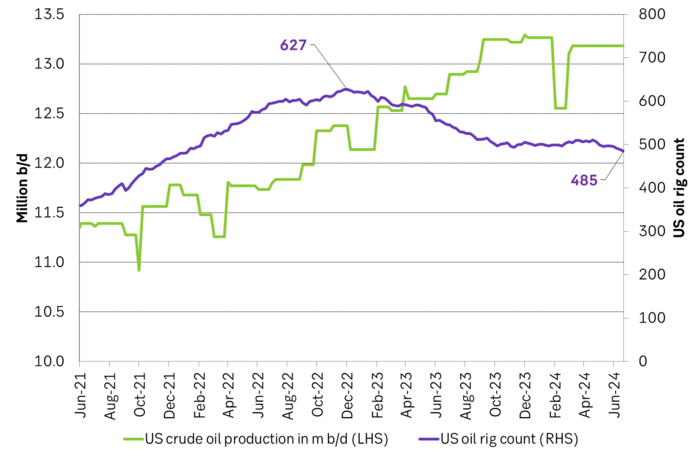
US crude oil production and drilling rig count
Brent is climbing higher. Front-month is at USD 106.3/bl this morning, close to a weekly high and a USD 9/bl jump from Mondays open. This is the move we flagged as a risk earlier in the week: the market shifting from ”a deal is around the corner” to ”this is going to take longer than we thought”.

Analyst Commodities, SEB
During April, rest-of-year Brent remained remarkably stable around USD 90/bl. A stability which rested on one single assumption: the SoH reopens around 1 May. That assumption is now slowly falling apart.
As we highlighted yesterday: every week of delay beyond 1 May adds (theoretically) ish USD 5/bl to the rest-of-year average, as global inventories draw 100 million barrels per week. i.e., a mid-May reopening implies rest-of-year Brent closer to USD 100/bl, and anything pushing into June or July takes us meaningfully higher.
What’s changed in the last 48 hours:
#1: The US military has formally warned that clearing suspected sea mines from SoH could take up to six months. That is a completely different timescale from what the financial market is pricing. Even a political deal tomorrow does not immediately reopen the strait.
#2: Trump has shifted his tone from urgency to ”strategic patience”. In yesterday’s press conference: ”Don’t rush me… I want a great deal.” The market is reading this as a president no longer feeling pressured by timelines, with the naval blockade running in the background.
#3: So far, the military activity is escalating, not de-escalating. Axios reports Iran is laying more mines in SoH. The US 3rd carrier strike group (USS George H.W. Bush) is arriving with two countermine vessels. Trump yesterday ordered the US Navy to destroy any Iranian boats caught laying mines. While CNN reports that the Pentagon is actively drawing up plans to strike Iranian SoH capabilities and individual Iranian military leaders if the ceasefire collapses. i.e., NOT a attitude consistent with an imminent deal!
Spot crude and product prices eased off the early-April highs on a combination of system rerouting and deal optimism. Both now weakening. Goldman estimates April Gulf output is reduced by 14.5 mbl/d, or 57% of pre-war supply, a number that keeps getting worse the longer this drags on.
Demand-side adaptation is ongoing: S. Korea has cut its Middle East crude dependence from 69% to 56% by pulling more from the Americas and Africa, and Japan is kicking off a second round of SPR releases from 1 May. But SPRs are finite.
Ref. to the negotiations, we should not bet on speed. The current Iranian leadership is dominated by genuine hardliners willing to absorb economic pain and run the clock to extract concessions. That is not a setup for a rapid resolution. US/Israeli media briefings keep framing the delay as ”internal Iranian divisions”, the reality is more complicated and points toward weeks and months, not days.
Our point is that the complexity is large, and higher prices have only just started (given a scenario where the negotiations drag out in time). The market spent April leaning on the USD 90/bl rest-of-year assumption; that case is diminishing by the hour. If ”early May reopening” is replaced by ”June, July or later” over the next week or two, both crude and products have meaningful room to reprice higher from here. There is a high risk being short energy and betting on any immediate political resolution(!).
Down on Friday. Up on Monday. The Brent June crude oil contract traded down 5.1% last week to a close of $90.38/b. It reached a high of $103.87/b last Monday and a low of $86.09/b on Friday as Iran announced that the Strait of Hormuz was fully open for transit. That quickly changed over the weekend as the US upheld its blockade of Iranian oil exports while Iran naturally responded by closing the SoH again. The US blew a hole in the engine room of the Iranian ship TOUSKA and took custody of the ship on Sunday. Brent crude is up 5.6% this morning to $95.4/b.
The cease-fire is expiring tomorrow. The US has said it will send a delegation for a second round of negotiations in Islamabad in Pakistan. But Iran has for now rejected a second round of talks as it views US demands as unrealistic and excessive while the US is also blocking the Strait of Hormuz.
While Brent is up 5% this morning, the financial market is still very optimistic that progress will be made. That talks will continue and that the SoH will fully open by the start of May which is consistent with a rest-of-year average Brent crude oil price of around $90/b with the market now trading that balance at around $88/b.
Financial optimism vs. physical deterioration. We have a divergence where the financial market is trading negotiations, improvements and resolution while at the same time the physical market is deteriorating day by day. Physical oil flows remain constrained by disrupted flows, longer voyage times and elevated freight and insurance costs.
Financial markets are betting that a US/Iranian resolution will save us in time from violent shortages down the road. But every day that the SoH remains closed is bringing us closer to a potentially very painful point of shortages and much higher prices.
The US blockade is also a weapon of leverage against its European and Asian allies. When Iran closed the SoH it held the world economy as a hostage against the US. The US blockade of the SoH is of course blocking Iranian oil exports. But it is also an action of disruption directed towards Europe and Asia. The US has called for the rest of the world to engaged in the war with Iran: ”If you want oil from the Persian Gulf, then go and get it”. A risk is that the US plays brinkmanship with the global oil market directed towards its European and Asian allies and maybe even towards China to force them to engage and take part. Maybe unthinkable. But unthinkable has become the norm with Trump in the White House.
Wild moves yesterday. Brent crude traded to a high of $114.43/b and a low of $96.0/b and closed at $99.94/b yesterday.
US – Iran negotiations ongoing or not? What a day. Donald Trump announced that good talks were ongoing between Iran and the US and that the 48 hour deadline before bombing Iranian power plants and energy infrastructure was postponed by five days subject to success of ongoing meetings. Iranian media meanwhile stated that no meetings were ongoing at all.
Today we are scratching our heads trying to figure out what yesterday was all about.
Friends and family playing the market? Was it just Trump and his friends and family who were playing with oil and equity markets with $580m and $1.46bn in bets being placed by someone in oil and equity markets just 15 minutes before Trump’s announcement?
Was Trump pulling a TACO as he reached his political and economic pain point: Brent at $112/b, US Gas at $4/gal, SPX below 200dma and US 10yr above 4.4%?
Different Iranian factions with Trump talking with one of them? Are there real negotiations going on but with the US talking to one faction in Iran while another, the hardliners, are not involved and are denying any such negotiations going on?
Extending the ultimatum to attack and invade Kharg island next weekend? Or, is the five day delay of the deadline a tactical decision to allow US amphibious assault ships and marines to arrive in the Gulf in the upcoming weekend while US and Israeli continues to degrade Iranian military targets till then. And then next weekend a move by the US/Israel to attack and conquer for example the Kharg island?
We do not really know which it is or maybe a combination of these.
We did get some kind of TACO ydy. But markets have been waiting for some kind of TACO to happen and yesterday we got some kind of TACO. And Brent crude is now trading at $101.5/b as a result rather than at $112-114/b as it did no the high yesterday.
But what really matters in our view is the political situation on the ground in Iran. Will hardliners continue to hold power or will a more pragmatic faction gain power?
If the hardliners remain in power then oil pain should extend all the way to US midterm elections. The hardliners were apparently still in charge as of last week. Iran immediately retaliated and damaged LNG infrastructure in Qatar after Israel hit Iranian South Pars. The SoH was still closed and all messages coming out of Iran indicated defiance. Hardliners continues in power has a huge consequence for oil prices going forward. The regime has played its ’oil-weapon’ (closing or chocking the Strait of Hormuz). It is using it to achieve political goals. Deterrence: it needs to be so politically and economically expensive to attack Iran that it won’t happen again in the future. Or at least that the US/Israel thinks 10-times over before they attack again. The highest Brent crude oil closing price since the start of the war is $112.19/b last Friday. In comparison the 20-year inflation adjusted Brent price is $103/b. So Brent crude last Friday at $112.19/b isn’t a shockingly high price. And it is still far below the nominal high of $148/b from 2008 which is $220/b if inflation adjusted. So once in a lifetime Iran activates its most powerful weapon. The oil weapon. It needs to show the power of this weapon and it needs to reap political gains. Getting Brent to $112/b and intraday high of $119.5/b (9 March) isn’t a display of the power of that weapon. And it is not a deterrence against future attacks.
So if the hardliners remain in power in Iran, then the SoH will likely remain chocked all the way to US midterm elections and Brent crude will at a minimum go above the historical nominal high of $148/b from 2008.
Thus the outlook for the oil price for the rest of the year doesn’t depend all that much of whether Trump pulls a TACO or not. Stops bombing or not. It depends more on who is in charge in Iran. If it is the hardliners, then deterrence against future attacks via chocking of the SoH and high oil prices is the likely line of action. It is impacting the world but the Iranian ’oil-weapon’ is directed towards the US president and the the US midterm elections.
If a pragmatic faction gets to power in Iran, then a very prosperous future is possible. However, if power is shifting towards a more pragmatic faction in Iran then a completely different direction could evolve. Such a faction could possibly be open for cooperation with the US and the GCC and possibly put its issues versus Israel aside. Then the prosperity we have seen evolving in Dubai could be a possible future also for Iran.
So far it looks like the hardliners are fully in charge. As far as we can see, the hardliners are still fully in control in Iran. That points towards continued chocking of the SoH and oil prices ticking higher as global inventories (the oil market buffers) are drawn lower. And not just for a few more weeks, but possibly all the way to the US midterm elections.


Brent crude up USD 9/bl on the week… ”deal around the corner” narrative fades
Market Still Betting on Timely Resolution, But Each Day Raises Shortage Risk

Christian Kopfer om läget för oljan

Marknaden måste börja betrakta de höga kopparpriserna som det nya normala

Det fysiska spotpriset på brentolja har slagit nytt rekord

40 minuter med Javier Blas om hur världen verkligen påverkas av energikrisen
Det fysiska spotpriset på brentolja har slagit nytt rekord
Marknaden måste börja betrakta de höga kopparpriserna som det nya normala
Christian Kopfer om läget för oljan

Efter tillväxten: Guldbrev satsar på expansion i Europa
-
 Nyheter3 veckor sedan
40 minuter med Javier Blas om hur världen verkligen påverkas av energikrisen
-
 Nyheter3 veckor sedan
Det fysiska spotpriset på brentolja har slagit nytt rekord
-
 Nyheter3 veckor sedan
Marknaden måste börja betrakta de höga kopparpriserna som det nya normala
-
 Nyheter2 veckor sedan
Christian Kopfer om läget för oljan
-
 Nyheter3 veckor sedan
Efter tillväxten: Guldbrev satsar på expansion i Europa
-
Analys5 dagar sedan
Market Still Betting on Timely Resolution, But Each Day Raises Shortage Risk
-
Analys1 dag sedan
Brent crude up USD 9/bl on the week… ”deal around the corner” narrative fades