

Analys
The EUA price could drop to EUR 40/ton and then be picked up by Airliners, Shipping and Utilities

The EUA price is dropping hard along with a sharp decline in the front-year TTF nat gas contract. The typical last-round sell-off in EUA prices have typically been a final sell-off of 10-20-30%. From EUR 60/ton level it implies a price decline down to EUR 54; 48; 42/ton. The front-year nat gas price and the front-year Coal-to-Gas (C-t-G) differential is what has held the EUA price above EUR 60/ton. But if the TTF 2025 price falls down to EUR 27/ton the front-year C-t-G differential will fall all the way towards EUR 40/ton. That TTF 2025 falls to EUR 27/ton or lower seems likely to happen and the risk is high that the EUA price will be sucked down along with it. But nat gas demand is starting to come back with a lag in nat gas price declines in the EU but probably also in Asia. Thus first an over-sell in nat gas prices, then demand revival and then a rebound in both nat gas prices and EUA prices. Airliners, shipping companies and Utilities will probably buy as much EUAs they can get if the EUA price fall down towards EUR 40/ton.

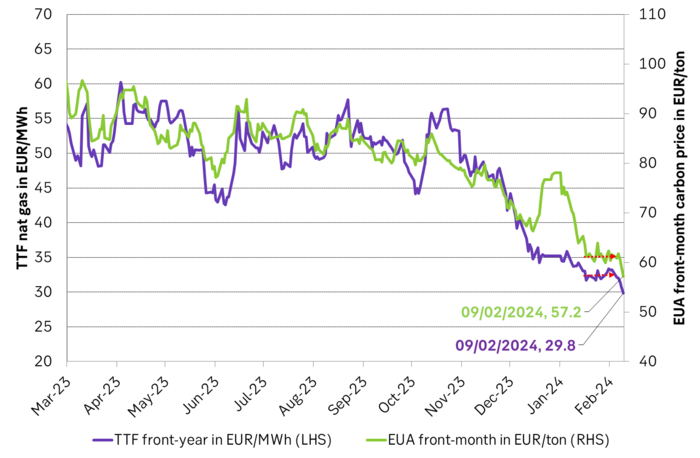
Front-year 2025 TTF nat gas price falls hard and so does the EUA price. The front-month EUA price dropped 2.7% yesterday to EUR 58.97/ton and thus broke out of the sideways trend around EUR 61/ton since 18 January. Today it has sold off another 3.2% to EUR 57.1/ton.
Again it is the nat gas price which is leading the way and more specifically it is about the front-year nat gas which lost 1.9% on Wednesday and another 2.5% again ydy to a close of EUR 30.65/MWh and today it has solf off 2.8% to EUR 29.8/ton.
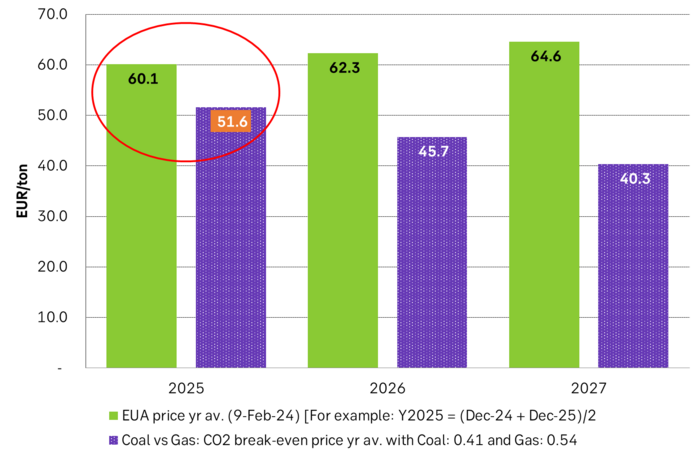
The EUA price has very clearly been balancing on the front-year Coal-to-Gas (C-t-G) differentials. The C-t-G differentials have been significantly lower than EUR 60/ton both at the front-end of the curve (1-2-3 month) and for calendars 2026 and 2027. But the front-year nat gas price has held up at around EUR 31/MWh quite well since around mid January.
How far down will the EUA price go? The final sell-off could be down towards EUR 40/ton. With these dynamics the big question then becomes: How far down will the front-year nat gas contract sell? It will of course sell off too far as commodities always do. The reason commodities do this is the natural reactive chain of events which normally comes with a lag: First the price goes down before dropping hard in the final round of the sell-off. Then demand comes back with a lag to the price action. This again drives the price back up and off from the lows to a level consistent with the revival in demand. If demand instead had reacted immediately to lower prices then the hard drop at the end of the sell-off might not have happened.
Looking at previous hard, final sell-off-drops in the EUA price we can see that final drops typically have been 10-20-30% as the last final drop. If we take the EUR 60/ton as the starting point of this final drop, then we are talking an EUA price bottom of somewhere in the range of EUR 54; 48; 42/ton.
Global nat gas demand destruction in the face of very high nat gas prices solved the energy crisis. Let’s link this back to price action in nat gas. The reason why Europe has managed the recent energy crisis (Russia/Ukraine, nat gas,…) so surprisingly well is 1) Large reduction in nat gas demand in EU due to exceptionally high prices and 2) Significant demand destruction in Asia freeing up nat gas to flow to the EU. I.e. it was global demand destruction of nat gas in response to extremely high prices globally which solved the energy crisis. It was solved by the global market.
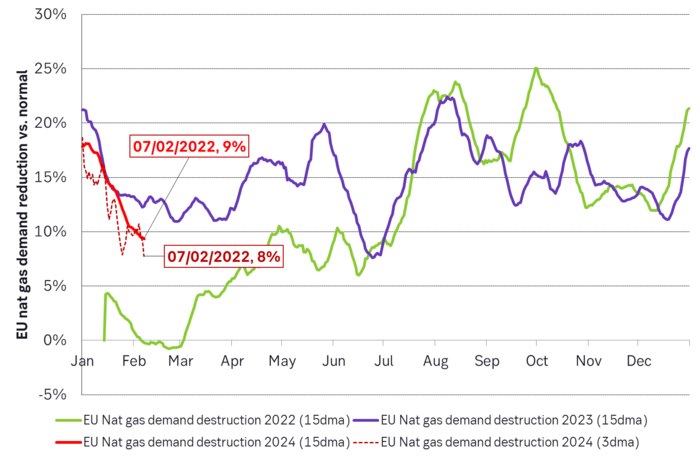
Demand for nat gas is starting to come back as the price falls. The nominal historical average nat gas TTF price was EUR 20/MWh from 2010 to 2019. But the real average was EUR 26/MWh. So seen from the eyes of consumers in both Europe and Asia, a price of EUR 26/MWh is an historically absolutely normal price. Demand for nat gas should thus naturally accelerate back towards normal levels at current nat gas prices. Not just in Europe, but also globally in all regions exposed to nat gas prices set by global LNG prices. This is already happening in the EU. Temp. adj. demand destruction vs. normal has typically been running at around 16% from mid-2022 to December 2023. Average ytd is 14% while the last 15 days is 9%. Demand destruction is fading as the price of nat gas is falling. But do remember that this is also happening in Asia but it is harder to track.
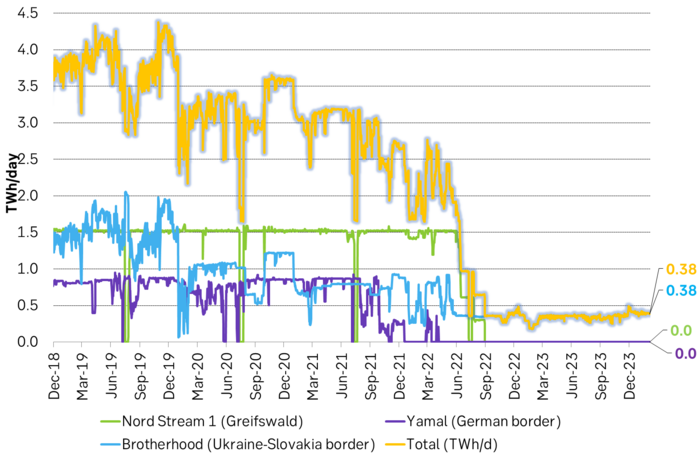
Normal nat gas demand AND normal gas prices is not consistent as Russian nat gas exports still down 1100 TWh/yr. There is however an inconsistency here in expecting normal prices and normal demand for natural gas now onward. The inconsistency is that the EU and thus the world is still robbed of the normal flow of nat gas on pipelines to Europe. This amounts to a loss of 3 TWh/day and thus close to 1100 TWh/year. When this gas is no longer flowing to the EU it isn’t flowing anywhere. It is lost to both the EU and the world. Until that is, Russia has built loads of new pipes to Asia and new LNG terminals. And that takes years.
A return to normal prices and normal demand while the world still is missing 1100 TWh/year of Russian nat gas isn’t really a consistent outcome in our view.
Demand for nat gas will continue to revive as the price of nat gas keeps falling. But both the EU and the world still need of a nat gas price at above normal levels to induce a certain amount of demand destruction until the point in time when new LNG export facilities globally has managed to replace the 1100 TWh/year we have lost from Russia.
Front-end TTF nat gas down to EUR 27/MWh could drive the EUA price to EUR 40/ton. The dynamic sell-off nat gas, prices will likely move lower than to the level which over time is consistent with continued need for some demand destruction globally. This because demand revival will come with a lag to the decline in prices. It is thus fully plausible that the TTF 2025 contract moves all the way down to EUR 27/MWh (or maybe even lower). If so it would imply a 2025 C-t-G differential of only EUR 40/ton for the EUA price to balance on and reference to. That could be the final hard drop in the EUA price. That’s a 30% drop from EUR 60/ton. But it won’t last because that nat gas price is likely too low vs. what is needed globally to maintain some level of demand destruction for a while longer.
An EUA price of EUR 40/ton would also be too cheap to resist for a range of market participants and they’d likely jump in and purchase with both hands. Airliners and shipping companies which will have difficulties of shifting away from fossil fuels and will need EUAs for years to come. Also utilities could step in and purchase large amounts of EUAs even if forward margins are negative. Some EU based utilities with large fossil-based assets bought truckloads of EUAs from 2011 to 2017 when the EUA price ranged from EUR 3/ton to EUR 9/ton. For them the EUA certificate is not only a marginal cost. It is also a licence to operate. The EUA price will of course not return to that level again. But if we move to EUR 40-50/ton, then it will probably trigger strategic buying by shipping companies, airliners as well as utilities.
Front-year TTF nat gas TTF price is dropping and leading the EUA price lower after a period of sideways action since mid-Jan
But the EU and the world is still missing some 3 TWh/d or 1100 TWh/yr of piped nat gas from Russia. When Russian nat gas is no longer flowing on pipes to Europe, it is flowing nowhere.
Nat gas demand destruction in the EU has been running at 15% to 17% since mid-2022 in the face of high nat gas prices. But demand destruction is now fading down to 8%. Demand has started to come back as nat gas prices fall. Demand is probably also coming back in Asia, but not so easily to see.
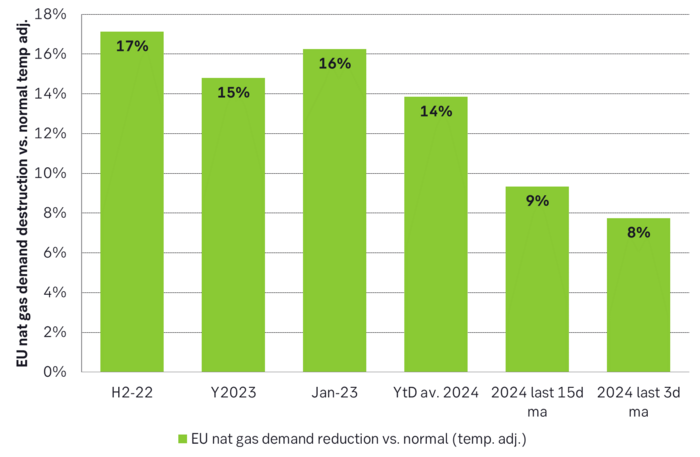
EU nat gas demand destruction has started to fade.
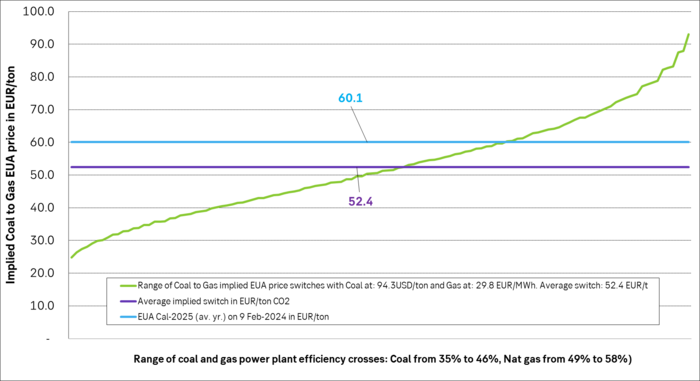
Forward Coal to Gas (C-t-G) differentials vs EUA market prices. The EUA price has balanced on the front-year differential. But that has now fallen like a rock along with the fall in front-year TTF nat gas price. Lead the EUA into a free-fall
The front-year Coal-to-Gas differential is a distribution of crosses between many different levels of efficiencies for coal and nat gas power plants. Averages of these are EUR 52.4/ton with Coal at USD 94.3/ton and Nat gas at EUR 29.8/MWh (both front-year 2025 prices). So EUA price is still hanging high.
Down on Friday. Up on Monday. The Brent June crude oil contract traded down 5.1% last week to a close of $90.38/b. It reached a high of $103.87/b last Monday and a low of $86.09/b on Friday as Iran announced that the Strait of Hormuz was fully open for transit. That quickly changed over the weekend as the US upheld its blockade of Iranian oil exports while Iran naturally responded by closing the SoH again. The US blew a hole in the engine room of the Iranian ship TOUSKA and took custody of the ship on Sunday. Brent crude is up 5.6% this morning to $95.4/b.

The cease-fire is expiring tomorrow. The US has said it will send a delegation for a second round of negotiations in Islamabad in Pakistan. But Iran has for now rejected a second round of talks as it views US demands as unrealistic and excessive while the US is also blocking the Strait of Hormuz.
While Brent is up 5% this morning, the financial market is still very optimistic that progress will be made. That talks will continue and that the SoH will fully open by the start of May which is consistent with a rest-of-year average Brent crude oil price of around $90/b with the market now trading that balance at around $88/b.
Financial optimism vs. physical deterioration. We have a divergence where the financial market is trading negotiations, improvements and resolution while at the same time the physical market is deteriorating day by day. Physical oil flows remain constrained by disrupted flows, longer voyage times and elevated freight and insurance costs.
Financial markets are betting that a US/Iranian resolution will save us in time from violent shortages down the road. But every day that the SoH remains closed is bringing us closer to a potentially very painful point of shortages and much higher prices.
The US blockade is also a weapon of leverage against its European and Asian allies. When Iran closed the SoH it held the world economy as a hostage against the US. The US blockade of the SoH is of course blocking Iranian oil exports. But it is also an action of disruption directed towards Europe and Asia. The US has called for the rest of the world to engaged in the war with Iran: ”If you want oil from the Persian Gulf, then go and get it”. A risk is that the US plays brinkmanship with the global oil market directed towards its European and Asian allies and maybe even towards China to force them to engage and take part. Maybe unthinkable. But unthinkable has become the norm with Trump in the White House.
Wild moves yesterday. Brent crude traded to a high of $114.43/b and a low of $96.0/b and closed at $99.94/b yesterday.
US – Iran negotiations ongoing or not? What a day. Donald Trump announced that good talks were ongoing between Iran and the US and that the 48 hour deadline before bombing Iranian power plants and energy infrastructure was postponed by five days subject to success of ongoing meetings. Iranian media meanwhile stated that no meetings were ongoing at all.
Today we are scratching our heads trying to figure out what yesterday was all about.
Friends and family playing the market? Was it just Trump and his friends and family who were playing with oil and equity markets with $580m and $1.46bn in bets being placed by someone in oil and equity markets just 15 minutes before Trump’s announcement?
Was Trump pulling a TACO as he reached his political and economic pain point: Brent at $112/b, US Gas at $4/gal, SPX below 200dma and US 10yr above 4.4%?
Different Iranian factions with Trump talking with one of them? Are there real negotiations going on but with the US talking to one faction in Iran while another, the hardliners, are not involved and are denying any such negotiations going on?
Extending the ultimatum to attack and invade Kharg island next weekend? Or, is the five day delay of the deadline a tactical decision to allow US amphibious assault ships and marines to arrive in the Gulf in the upcoming weekend while US and Israeli continues to degrade Iranian military targets till then. And then next weekend a move by the US/Israel to attack and conquer for example the Kharg island?
We do not really know which it is or maybe a combination of these.
We did get some kind of TACO ydy. But markets have been waiting for some kind of TACO to happen and yesterday we got some kind of TACO. And Brent crude is now trading at $101.5/b as a result rather than at $112-114/b as it did no the high yesterday.
But what really matters in our view is the political situation on the ground in Iran. Will hardliners continue to hold power or will a more pragmatic faction gain power?
If the hardliners remain in power then oil pain should extend all the way to US midterm elections. The hardliners were apparently still in charge as of last week. Iran immediately retaliated and damaged LNG infrastructure in Qatar after Israel hit Iranian South Pars. The SoH was still closed and all messages coming out of Iran indicated defiance. Hardliners continues in power has a huge consequence for oil prices going forward. The regime has played its ’oil-weapon’ (closing or chocking the Strait of Hormuz). It is using it to achieve political goals. Deterrence: it needs to be so politically and economically expensive to attack Iran that it won’t happen again in the future. Or at least that the US/Israel thinks 10-times over before they attack again. The highest Brent crude oil closing price since the start of the war is $112.19/b last Friday. In comparison the 20-year inflation adjusted Brent price is $103/b. So Brent crude last Friday at $112.19/b isn’t a shockingly high price. And it is still far below the nominal high of $148/b from 2008 which is $220/b if inflation adjusted. So once in a lifetime Iran activates its most powerful weapon. The oil weapon. It needs to show the power of this weapon and it needs to reap political gains. Getting Brent to $112/b and intraday high of $119.5/b (9 March) isn’t a display of the power of that weapon. And it is not a deterrence against future attacks.
So if the hardliners remain in power in Iran, then the SoH will likely remain chocked all the way to US midterm elections and Brent crude will at a minimum go above the historical nominal high of $148/b from 2008.
Thus the outlook for the oil price for the rest of the year doesn’t depend all that much of whether Trump pulls a TACO or not. Stops bombing or not. It depends more on who is in charge in Iran. If it is the hardliners, then deterrence against future attacks via chocking of the SoH and high oil prices is the likely line of action. It is impacting the world but the Iranian ’oil-weapon’ is directed towards the US president and the the US midterm elections.
If a pragmatic faction gets to power in Iran, then a very prosperous future is possible. However, if power is shifting towards a more pragmatic faction in Iran then a completely different direction could evolve. Such a faction could possibly be open for cooperation with the US and the GCC and possibly put its issues versus Israel aside. Then the prosperity we have seen evolving in Dubai could be a possible future also for Iran.
So far it looks like the hardliners are fully in charge. As far as we can see, the hardliners are still fully in control in Iran. That points towards continued chocking of the SoH and oil prices ticking higher as global inventories (the oil market buffers) are drawn lower. And not just for a few more weeks, but possibly all the way to the US midterm elections.
A brief sigh of relief yesterday as oil infra at Kharg wasn’t damaged. But higher today. Brent crude dabbled around a bit yesterday in relief that oil infrastructure at Iran’s Kharg island wasn’t damaged. It traded briefly below the 100-line and in a range of $99.54 – 106.5/b. Its close was near the low at $100.21/b.
No easy victorious way out for Trump. So no end in sight yet. Brent is up 3.2% today to $103.4/b with no signs that the war will end anytime soon. Trump has no easy way to declare victory and mission accomplished as long as Iran is in full control of the Strait of Hormuz while also holding some 440 kg of uranium enriched to 60% and not far from weapons grade at 90%. As long as these two factors are unresolved it is difficult for Trump to pull out of the Middle East. Naturally he gets increasingly frustrated over the situation as the oil price and US retail gas prices keeps ticking higher while the US is tied into the mess in the Middle East. Trying to drag NATO members into his mess but not much luck there.
When commodity prices spike they spike 2x, 3x, 4x or 5x. Supply and demand for commodities are notoriously inflexible. When either of them shifts sharply, the the price can easily go to zero (April 2022) or multiply 2x, 3x, or even 5x of normal. Examples in case cobalt in 2025 where Kongo restricted supply and the price doubled. Global LNG in 2022 where the price went 5x normal for the full year average. Demand for tungsten in ammunition is up strongly along with full war in the middle east. And its price? Up 537%.
Why hasn’t the Brent crude oil price gone 2x, 3x, 4x or 5x versus its normal of $68/b given close to full stop in the flow of oil of the Strait of Hormuz? We are after all talking about close to 20% of global supply being disrupted. The reason is the buffers. It is fairly easy to store oil. Commercial operators only hold stocks for logistical variations. It is a lot of oil in commercial stocks, but that is predominantly because the whole oil system is so huge. In addition we have Strategic Petroleum Reserves (SPRs) of close to 2500 mb of crude and 1000 mb of oil products. The IEA last week decided to release 400 mb from global SPR. Equal to 20 days of full closure of the Strait of Hormuz. Thus oil in commercial stocks on land, commercial oil in transit at sea and release of oil from SPRs is currently buffering the situation.
But we are running the buffers down day by day. As a result we see gradually increasing stress here and there in the global oil market. Asia is feeling the pinch the most. It has very low self sufficiency of oil and most of the exports from the Gulf normally head to Asia. Availability of propane and butane many places in India (LPG) has dried up very quickly. Local prices have tripled as a result. Local availability of crude, bunker oil, fuel oil, jet fuel, naphtha and other oil products is quickly running down to critical levels many places in Asia with prices shooting up. Oman crude oil is marked at $153/b. Jet fuel in Singapore is marked at $191/b.
Oil at sea originating from Strait of Hormuz from before 28 Feb is rapidly emptied. Oil at sea is a large pool of commercial oil. An inventory of oil in constant move. If we assume that the average journey from the Persian Gulf to its destinations has a volume weighted average of 13.5 days then the amount of oil at sea originating from the Persian Gulf when the the US/Israel attacked on 28 Feb was 13.5 days * 20 mb/d = 269 mb. Since the strait closed, this oil has increasingly been delivered at its destinations. Those closest to the Strait, like Pakistan, felt the emptying of this supply chain the fastest. Propane prices shooting to 3x normal there already last week and restaurants serving cold food this week is a result of that. Some 50-60% of Asia’s imports of Naphtha normally originates from the Persian Gulf. So naphtha is a natural pain point for Asia. The Gulf also a large and important exporter of Jet fuel. That shut in has lifted jet prices above $200/b.
To simplify our calculations we assume that no oil has left the Strait since that date and that there is no increase in Saudi exports from Yanbu. Then the draining of this inventory at sea originated from the Persian Gulf will essentially look like this:
The supply chain of oil at sea originating from the Strait of Hormuz is soon empty. Except for oil allowed through the Strait of Hormuz by Iran and increased exports from Yanbu in the Red Sea. Not included here.

Oil at sea is falling fast as oil is delivered without any new refill in the Persian Gulf. Waivers for Russian crude is also shifting Russian crude to consumers. Brent crude will likely start to feel the pinch much more forcefully when oil at sea is drawn down another 200 mb to around 1000 mb. That is not much more than 10 days from here.

Oil and oil products are starting to become very pricy many places. Brent crude has still been shielded from spiking like the others.


Market Still Betting on Timely Resolution, But Each Day Raises Shortage Risk

Christian Kopfer om läget för oljan

Marknaden måste börja betrakta de höga kopparpriserna som det nya normala

Det fysiska spotpriset på brentolja har slagit nytt rekord

40 minuter med Javier Blas om hur världen verkligen påverkas av energikrisen
40 minuter med Javier Blas om hur världen verkligen påverkas av energikrisen

Elpriserna fördubblas, stor osäkerhet inför sommaren

MP Materials, USA:s svar på Kinas dominans över sällsynta jordartsmetaller
Det fysiska spotpriset på brentolja har slagit nytt rekord
Marknaden måste börja betrakta de höga kopparpriserna som det nya normala
-
 Nyheter3 veckor sedan
40 minuter med Javier Blas om hur världen verkligen påverkas av energikrisen
-
 Nyheter4 veckor sedan
Elpriserna fördubblas, stor osäkerhet inför sommaren
-
 Nyheter4 veckor sedan
MP Materials, USA:s svar på Kinas dominans över sällsynta jordartsmetaller
-
 Nyheter3 veckor sedan
Det fysiska spotpriset på brentolja har slagit nytt rekord
-
 Nyheter2 veckor sedan
Marknaden måste börja betrakta de höga kopparpriserna som det nya normala
-
Analys4 veckor sedan
TACO (or Whatever It Was) Sends Oil Lower — Iran Keeps Choking Hormuz
-
 Nyheter1 vecka sedan
Christian Kopfer om läget för oljan
-

 Nyheter3 veckor sedan
Efter tillväxten: Guldbrev satsar på expansion i Europa