

Analys
Buying EUAs on the cheap will likely be one of the great opportunities of 2024

There are certainly bearish forces at work in the EUA market currently. Spot-wise, yes, but current forward price curve dynamics also creates a bearish pressure. Not the least from the utility side which normally is the big forward buyer of EUAs. They can now buy back previous forward hedges which where they locked in positive forward power margins. The can now instead reverse these which means that they instead of buying EUAs forward will sell EUAs forward.


That said, the MSR mechanism in the EUA market basically ensures that any surplus EUA above 833 million ton in the TNAC (Total Number of Allowances in Circulation) is wiped out within 2-3 years. The medium term EUA market fundamentals in 2026/27 and beyond is thus mostly untouched of what is going on right now. Forward 2026/27 and onward fundamentals are thus still as strong as they were previously which calls for a minimum price of EUR 100/ton or more by that time-horizon.
The question is what will be the catalyst which will turn this around to bullish price action instead of current bearish price action. A return to positive, forward clean dark and clean spark spreads is one. Economic revival in Europe as nat gas prices now have come down almost to the real average gas price level from 2010 to 2019 is another. Strong buying from shipping as they have no free allocations on their hands and will need every single EUA they buy in the years to come. But also industry will need increasingly more EUAs in the years to come and could utilize the current slump in EUA prices. Investors could also dive in at price levels seen ”too low” versus medium-term fundamental prices. Though hedge funds rarely have time to wait 2-3 years for a revival. But at some point the difference between the EUA spot price and what is considered a fair EUA price level (given politics and forward EUA fundamentals) become too big and too tempting to resist for both speculators and users of EUAs
Every year has unique opportunities in different types of assets, equities, currencies etc. We think that one of the great opportunities in 2024 when looked upon in hindsight, will be cheap EUAs. Thus those in need for EUAs in the years ahead should bid their time and pay attention to the opportunity currently playing out in the EU carbon market.
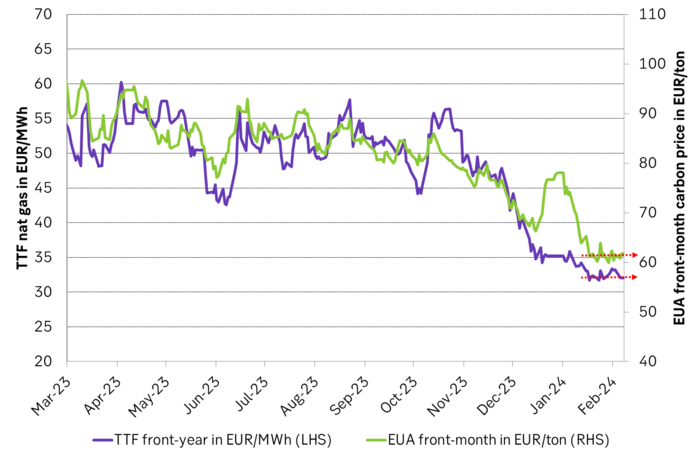
Since 17 January the front-month EUA price has ranged between an intraday low of EUR 59.12/ton and an intraday high of EUR 64.05/ton and with an average of closes of EUR 61.4/ton. The stabilization in the EUA price seems strongly related to the price development in the front-year TTF nat gas price which has stabilized at around EUR 32/MWh during the exact same period following a sharp price decline since early October last year.
The front-year TTF nat gas contract has stabilized at around EUR 32/MWh and the average year 2025 EUA price has stabilized for now around EUR 61/ton.
But the EUA price may have halted around the EUR 60/ton mark for other reasons as well. One is that when politicians tightened up the EUA market with backloading (2014) and MSR (2019) the EUA price rallied on its own merits and ahead of the Coal-to-Gas differentials all the way up to EUR 60/ton in 2021. In September 2021 however the C-t-G differentials (implied price of EUAs by marginal power market dynamics in an EUA market which is not too tight and not too loose) rallied ahead and above the EUA price due to the rally in nat gas prices. This then helped to drive the EUA price yet higher. The EUA price is now however back down at the crossover price of EUR 60/ton from September 2021 at which the EUA price previously was able to reach on its own merits (political tightening).
The average EUA front-year price in EUR/ton vs. the implied front-year C-t-G differential with 41% efficient coal and 54% efficient nat gas. The difference between the efficiency of 41% to 54% is not much different than the often used 36% vs 49%.
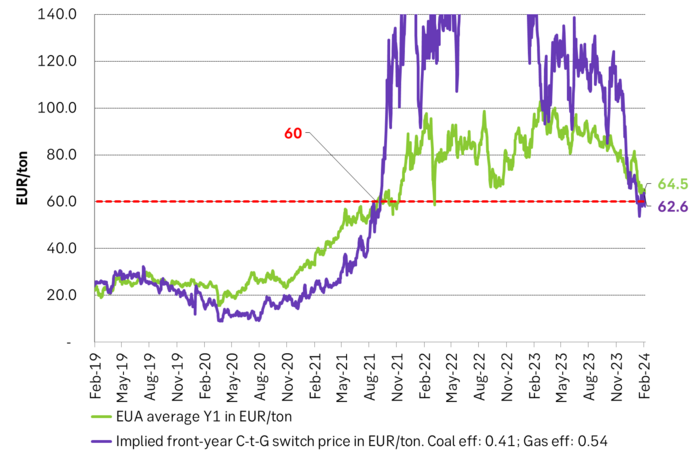
The EUA price also seems to follow the front-year C-t-G differentials quite closely while the discrepancies widen out further out on the curve. Thus a further sharp decline in the front-year TTF nat gas price is probably needed dynamically to drive the EUA price yet lower.
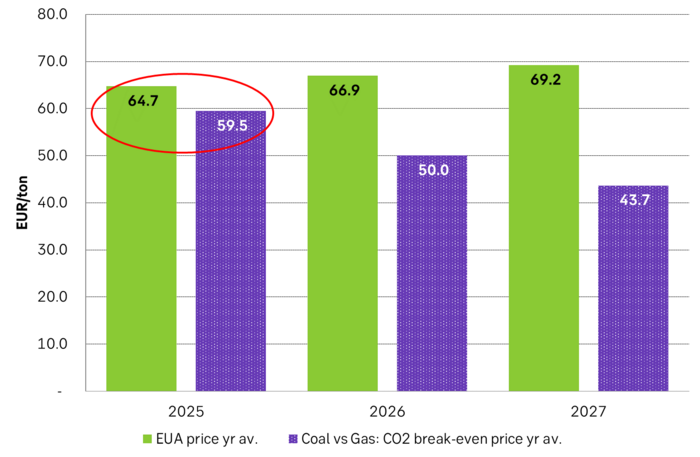
The EUA price seems to be anchored to the front-year TTF nat gas price as well as the front-year Coal-to-Gas differentials. But further out on the curve the latter widens out. Either because of increasing market tightness or simply due to curve structures. There are no support from C-t-G differentials in the current forward curves for 2026 and 2027.
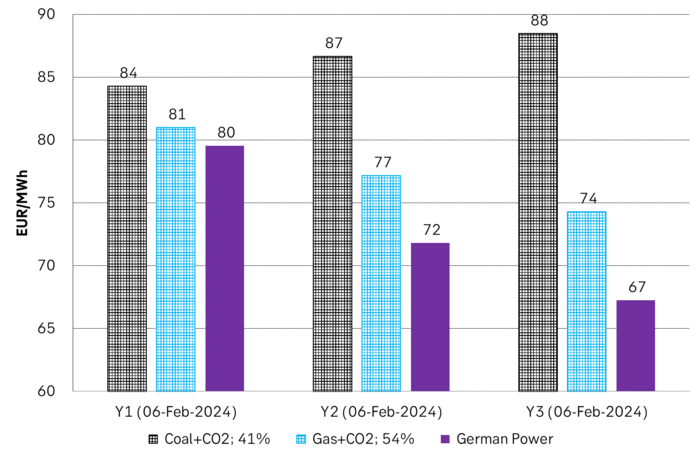
A serious element of weakness in the EUA market currently is that current forward clean power margins are negative. I.e. there is likely very limited amount of forward hedging by utilities as it doesn’t make sense for utilities to lock-in negative forward margins. Utilities are normally a large source of forward buying of EUAs and now there is probably close to nothing. And maybe even the opposite: Utilities may reverse previously entered hedges where they locked in forward positive margins and now instead can buy them back at favorable negative levels.
On a forward basis it costs more to produce power with Coal+CO2 or Gas+CO2 than it is possible to sell the power at on a forward basis.
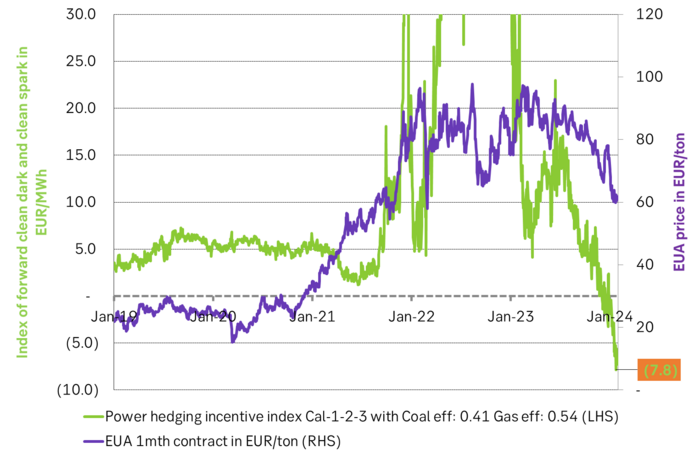
The following graph shows a ”utility hedging incentive index” which when positive indicates positive, clean forward coal and gas power margins with a weighting of 75%, 50% and 25% on the nearest Yr1, Yr2 and Yr3. Very strong and positive forward power margins since Jan 2019. The index crossed below the EUR 5/MWh margin October last year and now sits at a massive negative EUR 7.8/MWh at which Utilities are incentivised to revers their previous hedges and buy back previously sold power and then sell coal, gas and EUAs.
The EUA price vs. SEB’s Utility forward hedging incentive index. Now very negative. Potentially feeds EUA sales into the market from the Utility side.
There are thus certainly bearish forces at work in the EUA market currently. Both spot-wise but also current forward price curve dynamics creates a bearish pressure. Not the least from the utility side which normally is the big forward buyer of EUAs.
That said, the MSR mechanism in the EUA market basically ensures that any surplus EUA above 833 million ton in the TNAC (Total Number of Allowances in Circulation) is wiped out within 2-3 years. The medium term EUA market fundamentals in 2026/27 are thus mostly untouched of what is going on right now. Forward 2026/27 and onward fundamentals are thus still as strong as they were previously which calls for a minimum price of EUR 100/ton or more by that time-horizon.
The question is what will be the catalyst which will turn this around to bullish price action. Positive, forward clean dark and clean spark spreads is one. Economic revival in Europe as nat gas prices now have come down almost to the real average gas price level from 2010 to 2019. Strong buying from shipping as they have no free allocations on their hands and will need every single EUA the buy in the years to come. But also industry will need increasingly more EUAs in the years to come. Investors could also dive in at price levels seen ”too low” versus medium-term fundamental prices. Though hedge funds rarely have time to wait 2-3 years for a revival. But at some point the difference between the EUA spot price and what is considered a fair EUA price level (given politics and forward EUA fundamentals) become too big and too tempting to resist for both speculators and users of EUAs
Market is starting to take US/Iran headlines with a pinch of salt. Brent crude rose $2.8/b yesterday to an official close of $112.1/b. But after that it traded as low as $108.05/b before ending late night at around $109.7/b. Through the day it traded in a range of $106.87 – 112.72/b amid a flurry of news or rumors from Iran and the US. ”US temporary sanctions during negotiations” (falls alarm). ”We will bomb Iran” (not anyhow),… etc. While the market is still fluctuating to this kind of news flow, it is starting to take such headlines with a pinch of salt.
We’ll see. Maybe, maybe not. The Brent M1 contract is trading at $110.2/b this morning which very close to the average ticks through yesterday of $110.4/b.
Trump with bearish, verbal intervention whenever Brent trades above $110/b it seems. What seems to be a pattern is that Trump states something like ”very good negotiations going on with Iran”, ”New leaders in Iran are great,..”, ”Great progress in negotiations,…”, ”Deal in sight,..” etc whenever the Brent M1 contract trades above $110/b. An effort to cool the market. These hot air verbal interventions from Trump used to have a heavy bearish impact on prices, but they now seems to have less and less effect unless they are backed by reality.
As far as we can see there has been no real progress in the negotiations between the US and Iran with both sides still standing by their previous demands.
Iran is getting stronger while the cease fire lasts making a return to war for Trump yet harder. Iran is naturally in constant preparation for a return to war given Trump’s steady threats of bombing Iran again. Iran is naturally doing what ever is possible to prepare for a return to war. And every day the cease fire lasts it is better prepared. This naturally makes it more and more difficult and dangerous for the US to return to warring activity versus Iran as the consequences for energy infrastructure in the Persian Gulf will be more and more severe the longer the cease fire lasts. Israel seems to see it this way as well. That the war is not won and that current frozen state of a cease fire gives Iran opportunity to rebuild military and politically.
Global inventories are drawing down day by day. How much? In the meantime the Strait of Hormuz stays closed. There is varying measures and estimates of how much global inventories are drawing down. Our rough estimate, back of the envelope, is that global inventories are drawing down by at least some 10 mb/d or about 300 mb/d in a balance between loss of supply versus demand destruction. Other estimates we see are a monthly draw of 250-270 mb/d. The IEA only ’measured’ a draw in global observable stocks of 117 mb in April with oil on water rising 53 mb while on shore stocks fell 170 mb. But global stocks are hard to measure with large invisible, unmeasured stocks. As such a back of the envelope approach may be better.
Oil products is what the world is consuming. Oil product prices likely to rise while product stocks fall. Strategic Petroleum Reserves (SPR) are predominantly crude oil. Discharging oil from OECD SPR stocks, a sharp reduction in Chinese crude imports and a reduction in global refinery throughput of 6-7 mb/d has helped to keep crude oil markets satisfactorily supplied. But global inventories are drawing down none the less. And oil products is really what the world is consuming. So if global refinery throughput stays subdued, then demand will eventually have to match the supply of oil products. The likely path forward this summer is a steady draw down in jet fuel, diesel and gasoline. Higher prices for these. Then, if possible, higher refinery throughput and higher usage of crude in response to very profitable refinery margins. And lastly sharper draw in crude stocks and higher prices for these. But some 6 mb/d of oil products used to be exported through the Strait of Hormuz. And it may not be so easy to ramp up refinery activity across the world to compensate. Especially as Ukraine continues to damage Russian refineries as well as Russian crude production and export facilities.
Watch oil product stocks and prices as well as Brent calendar 2027. What to watch for this summer is thus oil product inventories falling and oil product premiums to crude rising. Another measure to watch is the Brent crude 2027 contract as it rises steadily day by day as the Strait of Hormuz stays closed and global oil inventories decline. The latter is close to the highest level since the start of the war and keeps rising.
The Brent M1 contract and the Brent 2027 prices and current price of jet fuel in Europe (ARA). All in USD/b

Our back of the envelope calculation of the global shortage created by the closure of the Strait of Hormuz. Note that 3.5 mb/d of discharge from SPR is also a draw. Note also that ’Forced demand loss’ of 2.5 mb/d is probably temporary and will fall back towards zero as logistics are sorted out leaving ’Price demand loss’ to do the job of balancing the market. Thus a shortfall of at least 9 mb/d created by the closure. More if SPR discharge is included and more if Forced demand loss recedes.

Brent is climbing higher. Front-month is at USD 106.3/bl this morning, close to a weekly high and a USD 9/bl jump from Mondays open. This is the move we flagged as a risk earlier in the week: the market shifting from ”a deal is around the corner” to ”this is going to take longer than we thought”.
Analyst Commodities, SEB
During April, rest-of-year Brent remained remarkably stable around USD 90/bl. A stability which rested on one single assumption: the SoH reopens around 1 May. That assumption is now slowly falling apart.
As we highlighted yesterday: every week of delay beyond 1 May adds (theoretically) ish USD 5/bl to the rest-of-year average, as global inventories draw 100 million barrels per week. i.e., a mid-May reopening implies rest-of-year Brent closer to USD 100/bl, and anything pushing into June or July takes us meaningfully higher.
What’s changed in the last 48 hours:
#1: The US military has formally warned that clearing suspected sea mines from SoH could take up to six months. That is a completely different timescale from what the financial market is pricing. Even a political deal tomorrow does not immediately reopen the strait.
#2: Trump has shifted his tone from urgency to ”strategic patience”. In yesterday’s press conference: ”Don’t rush me… I want a great deal.” The market is reading this as a president no longer feeling pressured by timelines, with the naval blockade running in the background.
#3: So far, the military activity is escalating, not de-escalating. Axios reports Iran is laying more mines in SoH. The US 3rd carrier strike group (USS George H.W. Bush) is arriving with two countermine vessels. Trump yesterday ordered the US Navy to destroy any Iranian boats caught laying mines. While CNN reports that the Pentagon is actively drawing up plans to strike Iranian SoH capabilities and individual Iranian military leaders if the ceasefire collapses. i.e., NOT a attitude consistent with an imminent deal!
Spot crude and product prices eased off the early-April highs on a combination of system rerouting and deal optimism. Both now weakening. Goldman estimates April Gulf output is reduced by 14.5 mbl/d, or 57% of pre-war supply, a number that keeps getting worse the longer this drags on.
Demand-side adaptation is ongoing: S. Korea has cut its Middle East crude dependence from 69% to 56% by pulling more from the Americas and Africa, and Japan is kicking off a second round of SPR releases from 1 May. But SPRs are finite.
Ref. to the negotiations, we should not bet on speed. The current Iranian leadership is dominated by genuine hardliners willing to absorb economic pain and run the clock to extract concessions. That is not a setup for a rapid resolution. US/Israeli media briefings keep framing the delay as ”internal Iranian divisions”, the reality is more complicated and points toward weeks and months, not days.
Our point is that the complexity is large, and higher prices have only just started (given a scenario where the negotiations drag out in time). The market spent April leaning on the USD 90/bl rest-of-year assumption; that case is diminishing by the hour. If ”early May reopening” is replaced by ”June, July or later” over the next week or two, both crude and products have meaningful room to reprice higher from here. There is a high risk being short energy and betting on any immediate political resolution(!).
Down on Friday. Up on Monday. The Brent June crude oil contract traded down 5.1% last week to a close of $90.38/b. It reached a high of $103.87/b last Monday and a low of $86.09/b on Friday as Iran announced that the Strait of Hormuz was fully open for transit. That quickly changed over the weekend as the US upheld its blockade of Iranian oil exports while Iran naturally responded by closing the SoH again. The US blew a hole in the engine room of the Iranian ship TOUSKA and took custody of the ship on Sunday. Brent crude is up 5.6% this morning to $95.4/b.
The cease-fire is expiring tomorrow. The US has said it will send a delegation for a second round of negotiations in Islamabad in Pakistan. But Iran has for now rejected a second round of talks as it views US demands as unrealistic and excessive while the US is also blocking the Strait of Hormuz.
While Brent is up 5% this morning, the financial market is still very optimistic that progress will be made. That talks will continue and that the SoH will fully open by the start of May which is consistent with a rest-of-year average Brent crude oil price of around $90/b with the market now trading that balance at around $88/b.
Financial optimism vs. physical deterioration. We have a divergence where the financial market is trading negotiations, improvements and resolution while at the same time the physical market is deteriorating day by day. Physical oil flows remain constrained by disrupted flows, longer voyage times and elevated freight and insurance costs.
Financial markets are betting that a US/Iranian resolution will save us in time from violent shortages down the road. But every day that the SoH remains closed is bringing us closer to a potentially very painful point of shortages and much higher prices.
The US blockade is also a weapon of leverage against its European and Asian allies. When Iran closed the SoH it held the world economy as a hostage against the US. The US blockade of the SoH is of course blocking Iranian oil exports. But it is also an action of disruption directed towards Europe and Asia. The US has called for the rest of the world to engaged in the war with Iran: ”If you want oil from the Persian Gulf, then go and get it”. A risk is that the US plays brinkmanship with the global oil market directed towards its European and Asian allies and maybe even towards China to force them to engage and take part. Maybe unthinkable. But unthinkable has become the norm with Trump in the White House.


Oil product price pain is set to rise as the Strait of Hormuz stays closed into summer

Solkraften pressar elpriserna dagtid

Michel Gubel ger sin syn på oljemarknaden


