

Analys
EU sanctions on Russian alu will likely drive EU premiums higher

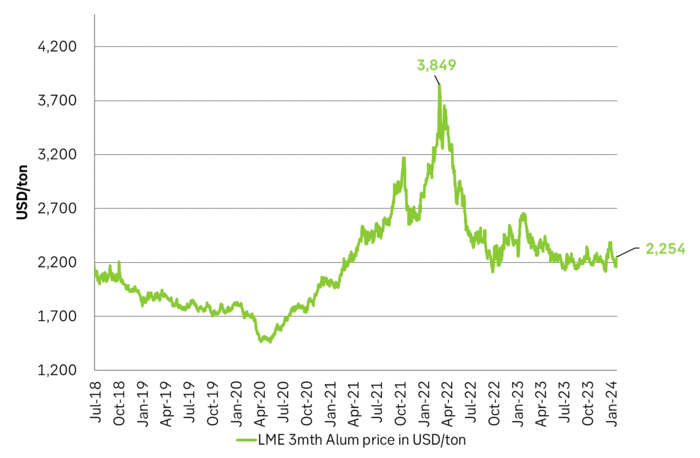
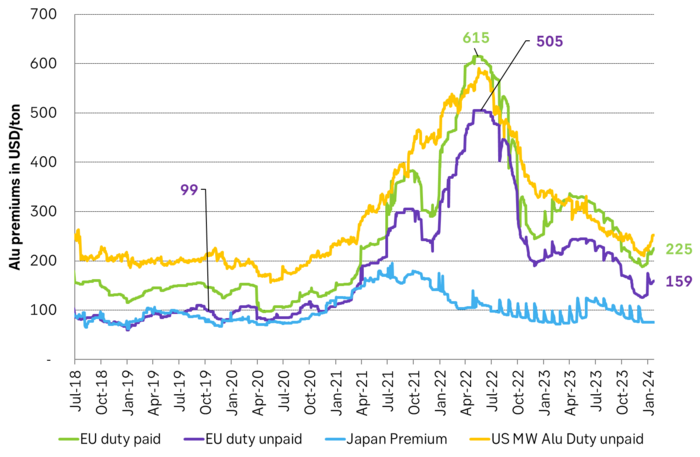
The LME 3mth alu price has bounced 4.5% past two days but its a far cry from 2022 impacts. The 3mth aluminum price has bounced 4.5% (+96 USD/ton) to USD 2256.5/ton on news that the EU is considering an embargo on Russian aluminum. It’s a notable gain amid an otherwise lukewarm and bearish energy complex where natural gas and coal prices have been trending steadily lower since October last year. But it is nothing compared to what happened in 2022 when Russia attacked Ukraine. The 3mth aluminum price then rallied to USD 3849/ton and the EU aluminum premium rallied to USD 505/ton versus a more normal USD 100/ton. Thus so far the the price action in aluminum is nothing like what we experienced in 2022.

It looks likely to us that the EU will indeed impose sanctions on Russian aluminium. We don’t know yet if the EU actually will implement sanctions on Russian aluminum. Personally I think its likely that they will do it as it is kind of a moral stand and the last large piece of the Russian energy complex which is possible to place under sanctions. But the actual effects both on the EU and Russia will likely be limited. Russia will not stop producing and exporting aluminium. Rather it will export it and send it elsewhere in the world. That is what happened to Russian crude and product exports. They weren’t lost in terms of global supply, but rerouted elsewhere.
New sanctions will have limited effect on Russia and dissipate over time. It’s a moral stand. Previously it was possible to enforce effective sanctions on one specific country. Those were the days when the US ruled the world and China chose to side with the US. For example with sanctions on Iran. These sanctions have not at all been lifted yet. But Iranian oil exports have rebounded from 1.9 m b/d at the low in 2019 to now 3.2 m b/d as China now is accepting to import Iranian crude oil and is placing less emphasis on the US.
The effect of sanctions have a tendency to deteriorate over time. Even when the US ruled the world and China played along. But sanctions today will leak massively if China isn’t playing along with what the EU and the US wants. And China isn’t playing along.
The goal is to hurt Russia’s income from aluminum exports. But the effect will be limited. The aim with the sanctions towards Russian oil, and now possibly also aluminum, isn’t to bar the supply from the global market. Rather the opposite. Neither the US nor the EU wants to put a stop to Russian raw materials exports as it could drive up the price of these globally which would hurt consumers and generate inflation. The aim is to keep exports flowing but to try to hurt Russian earnings from the exports. The same will likely be the case for the potentially upcoming EU sanctions on aluminum.
But even the ”hurt the income” strategy with a cap on the price of Russian crude and products has deteriorated over time. Russian Urals crude had a discount to Brent crude in 2022 of as much as USD 36/b and today it is only USD 12/b below Brent.
Russia has probably made contingency plans a long time ago. Russia has also probably made contingency plans for its aluminum exports as the risk has been there all along since 2022. Thus new EU sanctions towards Russian aluminium exports will likely be less of a shock today versus when all hell broke lose in 2022.
Europe has also already reduced its Russian imports of primary aluminium, to about 10% of its primary needs. A large proportion of imports are now increasingly coming from middle eastern producers.
EU alu premiums already rising along with Mid-East issues (Red Sea). Will rise further with sanctions. Issues in the region has pushed up freight costs, insurance costs and added transit delays and length of journey to Europe. A combination of these issues have already lifted the European premium. New sanctions on Russia will likely lift the regional premiums further.
The dirty details. How deeply is EU’s industrial supply chains embedded in Russian alu semies? The actual effects of new EU sanctions on Russian aluminum will be down to the dirty details. An important question is how deeply Russian semies, and prefabricated aluminum parts (which also looks to be sanctioned) are embedded and integrated in the European industrial system (supply chains). If the EU is deeply dependent of pre-fabricated aluminum parts from Russia, then it could be painful for EU to disentangle from these imports.
Sanctions = additional costs and frictions as global aluminum flows are rerouted. New sanctions will naturally lead to frictions and some added price due to that. Aluminum can of course be transported across the world. It is cheaper to transport it from Russia to Europe and that is why it historically has landed in the EU. But, if need be, due to possible EU sanctions towards Russia on aluminum, then Russia can and will send its aluminum to other global regions, maybe and possibly predominantly, to China. Then the EU can and must import more aluminum from other places instead. Probably the middle east and maybe from China
The Global LME 3mth price will likely rise only marginally as no supply is actually lost. Just rerouted. The price of aluminum across the world may increase a little bit due to such sanction-frictions but probably not all that much since there will not be any loss of supply and only added transportation frictions and costs.
EU aluminum premiums will naturally rise in order to attract non-Russian supply from further away. EU Alu-premiums should naturally increase in order to attract aluminum from further away. China will probably be able to import Russian aluminum on the cheap. So Russia will lose some income on its aluminum exports as it potentially has to cover transportation costs all the way to China and possibly an additional discount in order for China to take it. China may only import a lot of Russian aluminium if it can get it on the cheap. China can then export more as its country balance will improve and possibly export all the way back to Europe.
A weak macro-backdrop in Europe makes sanctions easier. The backdrop to all of this is very weak aluminum demand in Europe amid a bleak macro-picture. Disruption of Russian supply to the EU should thus be less painful than it otherwise would have been.
What to do with Russian alu stocks already in EU LME storage? Consume it or export it? A tricky question is what to do about all the Russian aluminum which currently is sitting at EU LME storage sites where it is constituting some 90% of aluminum stocks. If it has to leave EU LME storage sites due to sanctions then it may have to be sold at a discount in order to get it to flow elsewhere. Maybe it will create deep front-end contango is one speculation. A natural solution however would be that sanctions allows consumption of Russian aluminum currently in stock in the EU but bans new and further stocking of Russian aluminum. Then these Russian stocks would gradually be consumed and dissipate and instead gradually be replaced by non-Russian aluminum.
”Futures market can tighten quickly and spreads could rally.” The following is a comment from one of SEB’s metals traders: ”The futures market could get very tight very quickly following EU sanctions on Russian aluminum. Spreads could tighten aggressively until market reaches a new balance.”
The LME 3mth aluminum price rallied to USD 3,849/ton when Russia attacked Ukraine. Price has now gained a little (+4.5%) to USD 2,254/ton on possible EU sanctions.
Aluminum premiums across the world. EU premiums rallied to USD 505/ton and USD 615/ton (duty unpaid and paid resp.) in 2022 vs normal USD 100-150/ton. Now gained a little on Mid-East troubles and rerouting. Could rise much more on EU sanctions.
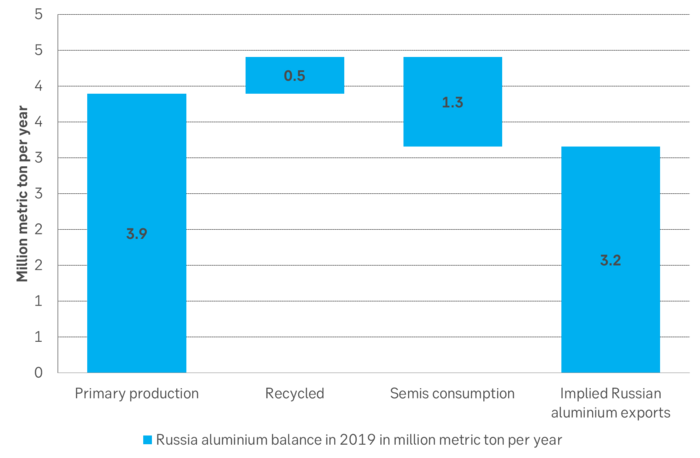
Russia probably has a normal, net export of alu semies and primary alu of around 3 m mtpa. This would normally be destined to Europe.
Market is starting to take US/Iran headlines with a pinch of salt. Brent crude rose $2.8/b yesterday to an official close of $112.1/b. But after that it traded as low as $108.05/b before ending late night at around $109.7/b. Through the day it traded in a range of $106.87 – 112.72/b amid a flurry of news or rumors from Iran and the US. ”US temporary sanctions during negotiations” (falls alarm). ”We will bomb Iran” (not anyhow),… etc. While the market is still fluctuating to this kind of news flow, it is starting to take such headlines with a pinch of salt.

We’ll see. Maybe, maybe not. The Brent M1 contract is trading at $110.2/b this morning which very close to the average ticks through yesterday of $110.4/b.
Trump with bearish, verbal intervention whenever Brent trades above $110/b it seems. What seems to be a pattern is that Trump states something like ”very good negotiations going on with Iran”, ”New leaders in Iran are great,..”, ”Great progress in negotiations,…”, ”Deal in sight,..” etc whenever the Brent M1 contract trades above $110/b. An effort to cool the market. These hot air verbal interventions from Trump used to have a heavy bearish impact on prices, but they now seems to have less and less effect unless they are backed by reality.
As far as we can see there has been no real progress in the negotiations between the US and Iran with both sides still standing by their previous demands.
Iran is getting stronger while the cease fire lasts making a return to war for Trump yet harder. Iran is naturally in constant preparation for a return to war given Trump’s steady threats of bombing Iran again. Iran is naturally doing what ever is possible to prepare for a return to war. And every day the cease fire lasts it is better prepared. This naturally makes it more and more difficult and dangerous for the US to return to warring activity versus Iran as the consequences for energy infrastructure in the Persian Gulf will be more and more severe the longer the cease fire lasts. Israel seems to see it this way as well. That the war is not won and that current frozen state of a cease fire gives Iran opportunity to rebuild military and politically.
Global inventories are drawing down day by day. How much? In the meantime the Strait of Hormuz stays closed. There is varying measures and estimates of how much global inventories are drawing down. Our rough estimate, back of the envelope, is that global inventories are drawing down by at least some 10 mb/d or about 300 mb/d in a balance between loss of supply versus demand destruction. Other estimates we see are a monthly draw of 250-270 mb/d. The IEA only ’measured’ a draw in global observable stocks of 117 mb in April with oil on water rising 53 mb while on shore stocks fell 170 mb. But global stocks are hard to measure with large invisible, unmeasured stocks. As such a back of the envelope approach may be better.
Oil products is what the world is consuming. Oil product prices likely to rise while product stocks fall. Strategic Petroleum Reserves (SPR) are predominantly crude oil. Discharging oil from OECD SPR stocks, a sharp reduction in Chinese crude imports and a reduction in global refinery throughput of 6-7 mb/d has helped to keep crude oil markets satisfactorily supplied. But global inventories are drawing down none the less. And oil products is really what the world is consuming. So if global refinery throughput stays subdued, then demand will eventually have to match the supply of oil products. The likely path forward this summer is a steady draw down in jet fuel, diesel and gasoline. Higher prices for these. Then, if possible, higher refinery throughput and higher usage of crude in response to very profitable refinery margins. And lastly sharper draw in crude stocks and higher prices for these. But some 6 mb/d of oil products used to be exported through the Strait of Hormuz. And it may not be so easy to ramp up refinery activity across the world to compensate. Especially as Ukraine continues to damage Russian refineries as well as Russian crude production and export facilities.
Watch oil product stocks and prices as well as Brent calendar 2027. What to watch for this summer is thus oil product inventories falling and oil product premiums to crude rising. Another measure to watch is the Brent crude 2027 contract as it rises steadily day by day as the Strait of Hormuz stays closed and global oil inventories decline. The latter is close to the highest level since the start of the war and keeps rising.
The Brent M1 contract and the Brent 2027 prices and current price of jet fuel in Europe (ARA). All in USD/b

Our back of the envelope calculation of the global shortage created by the closure of the Strait of Hormuz. Note that 3.5 mb/d of discharge from SPR is also a draw. Note also that ’Forced demand loss’ of 2.5 mb/d is probably temporary and will fall back towards zero as logistics are sorted out leaving ’Price demand loss’ to do the job of balancing the market. Thus a shortfall of at least 9 mb/d created by the closure. More if SPR discharge is included and more if Forced demand loss recedes.

Brent is climbing higher. Front-month is at USD 106.3/bl this morning, close to a weekly high and a USD 9/bl jump from Mondays open. This is the move we flagged as a risk earlier in the week: the market shifting from ”a deal is around the corner” to ”this is going to take longer than we thought”.

Analyst Commodities, SEB
During April, rest-of-year Brent remained remarkably stable around USD 90/bl. A stability which rested on one single assumption: the SoH reopens around 1 May. That assumption is now slowly falling apart.
As we highlighted yesterday: every week of delay beyond 1 May adds (theoretically) ish USD 5/bl to the rest-of-year average, as global inventories draw 100 million barrels per week. i.e., a mid-May reopening implies rest-of-year Brent closer to USD 100/bl, and anything pushing into June or July takes us meaningfully higher.
What’s changed in the last 48 hours:
#1: The US military has formally warned that clearing suspected sea mines from SoH could take up to six months. That is a completely different timescale from what the financial market is pricing. Even a political deal tomorrow does not immediately reopen the strait.
#2: Trump has shifted his tone from urgency to ”strategic patience”. In yesterday’s press conference: ”Don’t rush me… I want a great deal.” The market is reading this as a president no longer feeling pressured by timelines, with the naval blockade running in the background.
#3: So far, the military activity is escalating, not de-escalating. Axios reports Iran is laying more mines in SoH. The US 3rd carrier strike group (USS George H.W. Bush) is arriving with two countermine vessels. Trump yesterday ordered the US Navy to destroy any Iranian boats caught laying mines. While CNN reports that the Pentagon is actively drawing up plans to strike Iranian SoH capabilities and individual Iranian military leaders if the ceasefire collapses. i.e., NOT a attitude consistent with an imminent deal!
Spot crude and product prices eased off the early-April highs on a combination of system rerouting and deal optimism. Both now weakening. Goldman estimates April Gulf output is reduced by 14.5 mbl/d, or 57% of pre-war supply, a number that keeps getting worse the longer this drags on.
Demand-side adaptation is ongoing: S. Korea has cut its Middle East crude dependence from 69% to 56% by pulling more from the Americas and Africa, and Japan is kicking off a second round of SPR releases from 1 May. But SPRs are finite.
Ref. to the negotiations, we should not bet on speed. The current Iranian leadership is dominated by genuine hardliners willing to absorb economic pain and run the clock to extract concessions. That is not a setup for a rapid resolution. US/Israeli media briefings keep framing the delay as ”internal Iranian divisions”, the reality is more complicated and points toward weeks and months, not days.
Our point is that the complexity is large, and higher prices have only just started (given a scenario where the negotiations drag out in time). The market spent April leaning on the USD 90/bl rest-of-year assumption; that case is diminishing by the hour. If ”early May reopening” is replaced by ”June, July or later” over the next week or two, both crude and products have meaningful room to reprice higher from here. There is a high risk being short energy and betting on any immediate political resolution(!).
Down on Friday. Up on Monday. The Brent June crude oil contract traded down 5.1% last week to a close of $90.38/b. It reached a high of $103.87/b last Monday and a low of $86.09/b on Friday as Iran announced that the Strait of Hormuz was fully open for transit. That quickly changed over the weekend as the US upheld its blockade of Iranian oil exports while Iran naturally responded by closing the SoH again. The US blew a hole in the engine room of the Iranian ship TOUSKA and took custody of the ship on Sunday. Brent crude is up 5.6% this morning to $95.4/b.
The cease-fire is expiring tomorrow. The US has said it will send a delegation for a second round of negotiations in Islamabad in Pakistan. But Iran has for now rejected a second round of talks as it views US demands as unrealistic and excessive while the US is also blocking the Strait of Hormuz.
While Brent is up 5% this morning, the financial market is still very optimistic that progress will be made. That talks will continue and that the SoH will fully open by the start of May which is consistent with a rest-of-year average Brent crude oil price of around $90/b with the market now trading that balance at around $88/b.
Financial optimism vs. physical deterioration. We have a divergence where the financial market is trading negotiations, improvements and resolution while at the same time the physical market is deteriorating day by day. Physical oil flows remain constrained by disrupted flows, longer voyage times and elevated freight and insurance costs.
Financial markets are betting that a US/Iranian resolution will save us in time from violent shortages down the road. But every day that the SoH remains closed is bringing us closer to a potentially very painful point of shortages and much higher prices.
The US blockade is also a weapon of leverage against its European and Asian allies. When Iran closed the SoH it held the world economy as a hostage against the US. The US blockade of the SoH is of course blocking Iranian oil exports. But it is also an action of disruption directed towards Europe and Asia. The US has called for the rest of the world to engaged in the war with Iran: ”If you want oil from the Persian Gulf, then go and get it”. A risk is that the US plays brinkmanship with the global oil market directed towards its European and Asian allies and maybe even towards China to force them to engage and take part. Maybe unthinkable. But unthinkable has become the norm with Trump in the White House.


Sommarväder skapar prisrally på elbörsen
Oil product price pain is set to rise as the Strait of Hormuz stays closed into summer

Solkraften pressar elpriserna dagtid

Michel Gubel ger sin syn på oljemarknaden