

Analys
More from Venezuela and Iran means smaller pie for Saudi

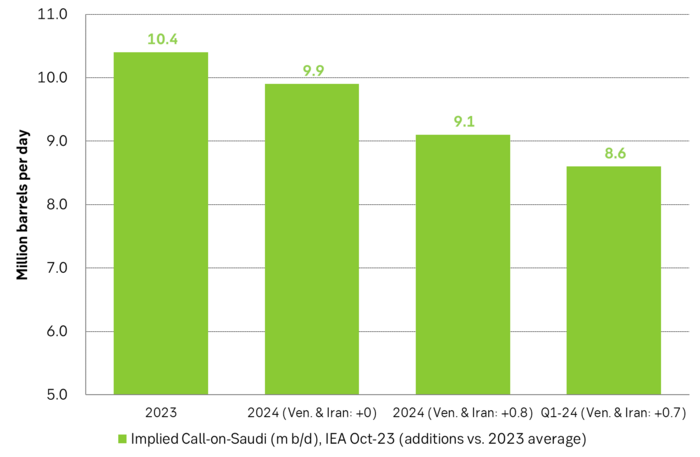
Production in Venezuela and Iran is on the rise and is set to rise further in the coming months and in 2024. Combined their production could grow by 0.8 m b/d YoY to 2024 (average year to average year). The IEA projected in its latest OMR (Oct-2023) that call-on-OPEC will fall to 28.3 m b/d in 2024, a decline of 0.5 m b/d. This combination would drive implied call-on-Saudi from 10.4 m b/d in 2023 to only 9.1 m b/d in 2024 and as low as 8.6 m b/d in Q1-24 if Saudi Arabia has to do all the heavy lifting alone. Wider core OPEC cooperation may be required.

The IEA is out in the news today projecting peak oil demand this decade with global demand standing at no more than 102 m b/d towards the end of this decade. If so it would imply a call-on-Non-OPEC of only 66.4 m b/d in 2028 assuming that OPEC in general will demand a market share of 30 m b/d + NGL of 5.6 m b/d. The IEA (Oct-23) projects non-OPEC production to average 68.8 m b/d in 2024. That’s already 2.4 m b/d more than what would be sustainable over time if global oil demand is set to peak later this decade. Oil producers in general cannot have a production growth strategy in a peak oil demand world.
The US has decided to lift sanctions towards Venezuela for six months (18 April) as a measure to tempt it to move towards more democratic processes. And if it does, then the lifting of sanctions could continue after the 6 months. A primary opposition election took place this weekend with lawmaker Maria Corina Machado currently holding 93% of the vote count. Venezuela will next year hold a presidential election but fair play seems unlikely with Maduro in charge. The lifting of sanctions allows Venezuela’s PdV to resume exports to all destinations. Bans on new, foreign investments in the oil and gas sector are also lifted though Russian entities and JV’s are still barred.
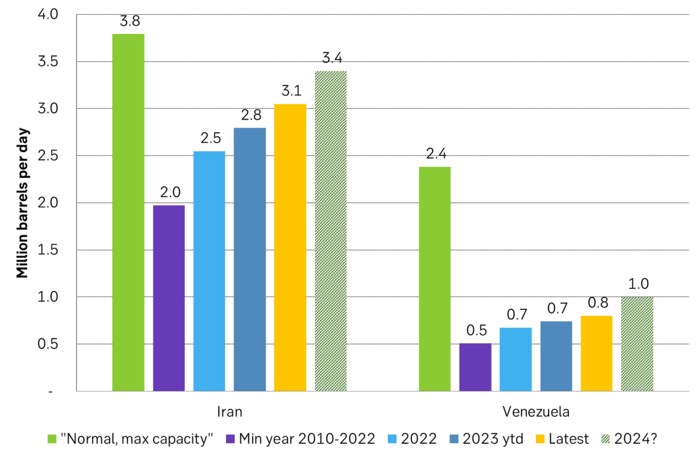
Venezuela produced 0.8 m b/d in September and indicates that it can lift production by 0.2 m b/d by year and with more rigs and wells by 0.5 m b/d to 1.3 m b/d in the medium term.
Oil production in Iran has been on a steady rise since its low-point of 2.0 m b/d in 2020. Last year it produced 2.5 m b/d. In September it produced 3.1 m b/d, but Iran’s oil minister says production now is at 3.3 m b/d. Iran’s rising production and exports is not about the US being more lenient in its enforcement of sanctions towards Iran. It is more about Iran finding better ways to circumvent them but even more importantly that China is importing more and more oil from Iran.
Production by Iran and Venezuela is recovering. YoY production from the two could rise by close to 0.8 m b/d in 2024. This will lead to a decline in call-on-Saudi oil.
The IEA estimated in its latest OMR report that call-on-OPEC will fall from 28.8 m b/d in 2023 to 28.3 m b/d in 2024. If all OPEC members except Saudi Arabia produces the same amount in 2024 as in 2023, then the need for Saudi Arabia’s oil (call-on-Saudi) will fall from a healthy 10.4 m b/d in 2023 to a still acceptable 9.9 m b/d in 2024. Its normal production is roughly 10 m b/d.
If however production by Iran and Venezuela rise by a combined 0.5 m b/d YoY in 2024, then call-on-Saudi will fall to 9.4 m b/d which is not so good but still manageable. But if Iran’s oil minister is correct when he says that its current production now is at 3.3 m b/d, then it is not far fetched to assume that Iran’s oil production may average maybe 3.4-3.5 m b/d in 2024. That would yield a YoY rise of 0.6 m b/d just for Iran. If we also assume that Venezuela manages to lift its production from 0.8 m b/d this year to 1.0 m b/d in 2024, then the combined growth from the two is closer to 0.8 m b/d. That would push call-on-Saudi down to only 9.1 m b/d which is not good at all. It would require Saudi Arabia to produce at its current production of 9.0 m b/d all through 2024.
The IEA further estimates that call-on-OPEC will average 27.7 m b/d in Q1-24. If we assume Iran @ 3.4 m b/d and Venezuela @ 1.0 m b/d then call-on-Saudi in Q1-24 will only be 8.6 m b/d. I.e. Saudi Arabia will have to cut production further to 8.6 m b/d in Q1-24. At that point Saudi Arabia will likely need or like other core OPEC members like Iraq, Kuwait and UAE as well as Russia to join in.
Implied call-on-Saudi. Call-on-OPEC is set to decline from 28.8 m b/d to 28.3 m b/d to 2024. If all OPEC members produced the same in 2024 as in 2023 then call-on-Saudi would fall by 0.5 m b/d to 9.9 m b/d. But if Venezuela and Iran increases their combined production by 0.8 m b/d YoY in 2024 then call-on-Saudi falls to 9.1 m b/d.
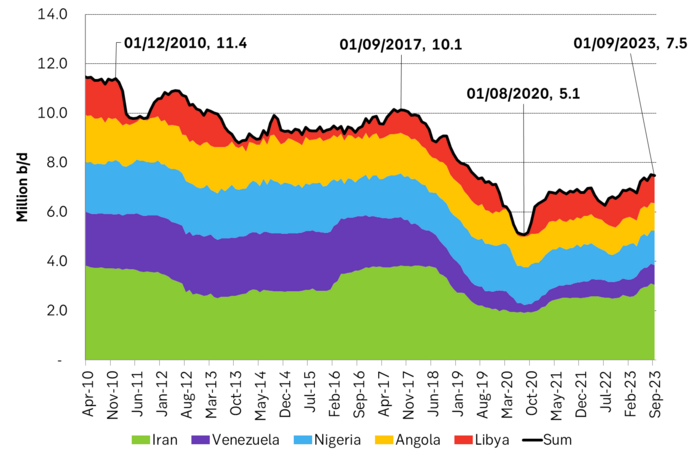
If we look a little broader on this topic and also include Libya, Nigeria and Angola we see that this group of OPEC members produced 11.4 m b/d in 2010, 10.1 m b/d in 2017 and only 5.1 m b/d at the low-point in August 2020. The decline by these OPEC members has of course the other OPEC and OPEC+ members to stem the rising flood of US shale oil production. The production from this unfortunate group of OPEC-laggards is however now on the rise reaching 7.5 m b/d in September. With more from Iran and Venezuela it could rise to 8.0 m b/d in 2024. Production from Nigeria and Angola though still looks to be in gradual decline while Libya looks more sideways. So for the time being it is all about the revival of Iran and Venezuela.
The unfortunate OPEC-laggards had a production of 11.4 m b/d in 2010. But production then fell to only 5.1 m b/d in August 2020. It helped the rest of OPEC’s members to manage the huge increase in US shale oil production. Production from these countries are now on the rebound. Though Nigeria and Angola still seems to be in gradual decline.
What everyone needs to be attentive to is that call-on-OPEC and even more importantly call-on-Saudi can only erode to a limit before Saudi/OPEC/Russia will have to take action. Especially if the forecast for needed oil from OPEC/Saudi for the nearest 2-3 years is in significant decline. Then they will have to take action in the sense that they stop defending the price and allows the price to fall sharply along with higher production. And yet again it is US shale oil producers who will have to take the brunt of the pain. They are the only oil producers in the world who can naturally and significantly reduce their production rather quickly. I.e. the US shale oil players will have to be punished into obedience, if possible, yet one more time.
We don’t think that it is any immediate risk for this to happen as US shale oil activity is slowing while global oil demand has rebounded following Covid-lockdowns. But one needs to keep a watch on projections for call-on-OPEC and call-on-Saudi stretching 1-2-3 years forward on a continuous basis.
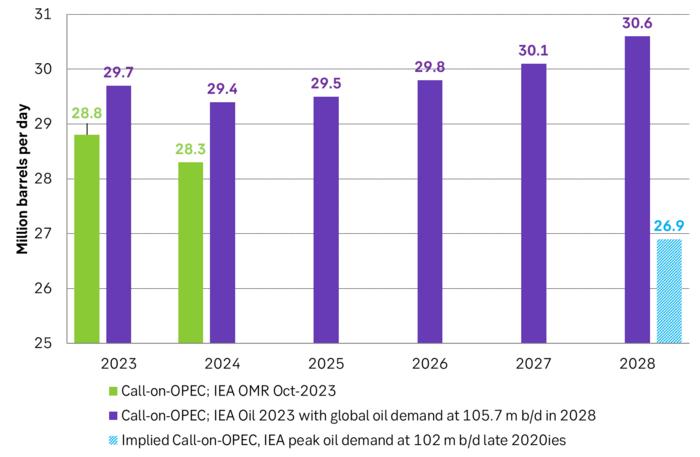
In its medium term oil market outlook, Oil2023, the IEA projected a fairly healthy development for call-on-OPEC to 2028. First bottoming out at 29.4 m b/d in 2024 before rising gradually to 30.6 m b/d in 2028. The basis for this was a slowing though steady rise in global oil demand to 105.7 m b/d in 2028 together with stagnant non-OPEC production due to muted capex spending over the past decade. But this projection has already been significantly dented and reduced in IEA’s latest OMR from October where call-on-OPEC for 2024 is projected at only 28.3 m b/d.
In a statement today the IEA projects that global oil demand will peak this decade and consume no more than 102 m b/d in the late 2020ies due to (in large part) rapid growth in EV sales. This would imply a call-on-OPEC of only 26.9 m b/d in 2028. It is not a viable path for OPEC to produce only 26.9 m b/d in 2028. Especially if production by Iran and Venezuela is set to revive. I.e. OPEC’s pie is shrinking while at the same time Iran and Venezuela is producing more. In this outlook something will have to give and it is not OPEC.
One should here turn this on its head and assume that OPEC will produce 30 m b/d in 2028. Add OPEC NGLs of 5.6 m b/d and we get 35.6 m b/d. If global oil demand in 2028 stands at only 102 m b/d then call-on-Non-OPEC equates to 66.4 m b/d. That is 3.1 m b/d less than IEA’s non-OPEC production projection for 2028 of 69.5 m b/d but also higher than non-OPEC production projection of 68.8 m b/d (IEA, Oct-23) is already 2.4 m b/d too high versus what is a sustainable level.
What this of course naturally means is that oil producers in general cannot have production growth as a strategy in a peak-oil-demand-world with non-OPEC in 2024 already at 2.4 m b/d above its sustainable level.
The US is set to growth its hydrocarbon liquids by 0.5 m b/d YoY in 2024. But in a zero oil demand growth world that is way, way too much.
Hesitant today. Brent jumped to an intraday high of $66.36/b yesterday after having touched an intraday low of $60.07/b on Monday as Indian and Chinese buyers cancelled some Russian oil purchases and instead redirected their purchases towards the Middle East due to the news US sanctions. Brent is falling back 0.4% this morning to $65.8/b.

It’s our strong view that the only sensible thing is to sell this rally. In all Trump’s unpredictability he has become increasingly predictable. Again and again he has rumbled about how he is going to be tough on Putin. Punish Putin if he won’t agree to peace in Ukraine. Recent rumbling was about the Tomahawk rockets which Trump threatened on 10 October and 12 October to sell/send to Ukraine. Then on 17 October he said that ”the U.S. didn’t want to give away weapons (Tomahawks) it needs”.
All of Trump’s threats towards Putin have been hot air. So far Trump’s threats have been all hot air and threats which later have evaporated after ”great talks with Putin”. After all these repetitions it is very hard to believe that this time will be any different. The new sanctions won’t take effect before 21. November. Trump has already said that: ”he was hoping that these new sanctions would be very short-lived in any case”. Come 21. November these new sanctions will either evaporate like all the other threats Trump has thrown at Putin before fading them. Or the sanctions will be postponed by another 4 weeks or 8 weeks with the appearance that Trump is even more angry with Putin. But so far Trump has done nothing that hurt Putin/Russia. We can’t imagine that this will be different. The only way forward in our view for a propre lasting peace in Ukraine is to turn Ukraine into defensive porcupine equipped with a stinging tail if need be.
China will likely stand up to Trump if new sanctions really materialize on 21 Nov. Just one country has really stood up to Trump in his tariff trade war this year: China. China has come of age and strength. I will no longer be bullied. Trump upped tariffs. China responded in kind. Trump cut China off from high-end computer chips. China put on the breaks on rare earth metals. China won’t be bullied any more and it has the power to stand up. Some Chinese state-owned companies like Sinopec have cancelled some of their Russian purchases. But China’s Foreign Ministry spokesperson Guo Jiakun has stated that China “oppose unilateral sanctions which lack a basis in international law and authorization of the UN Security Council”. Thus no one, not even the US shall unilaterally dictate China from whom they can buy oil or not. This is yet another opportunity for China to show its new strength and stand up to Trump in a show of force. Exactly how China choses to play this remains to be seen. But China won’t be bullied by over something as important as its oil purchases. So best guess here is that China will defy Trump on this. But probably China won’t need to make a bid deal over this. Firstly because these new sanctions will either evaporate as all the other threats or be postponed once we get to 21 November. Secondly because the sanctions are explicit towards US persons and companies but only ”may” be enforced versus non-US entities.
Sanctions is not a reduction in global supply of oil. Just some added layer of friction. Anyhow, the new sanctions won’t reduce the supply of Russian crude oil to the market. It will only increase the friction in the market with yet more need for the shadow fleet and ship to ship transfer of Russian oil to dodge the sanctions. If they materialize at all.
The jump in crude oil prices is probably due to redirections of crude purchases to the Mid-East and not because all speculators are now turned bullish. Has oil rallied because all speculators now suddenly have turned bullish? We don’t think so. Brent crude has probably jumped because some Indian and Chinese oil purchasers of have redirected their purchases from Russia towards the Mid-East just in case the sanctions really materializes on 21 November.
Parts of the Brent crude curve dipping into the high $50ies/b. Brent crude fell 2.3% over the week to Friday. It closed the week at $61.29/b, a slight gain on the day, but also traded to a low of $60.14/b that same day and just barely avoided trading into the $50ies/b. This morning it is risk-on in equities which seems to help industrial metals a little higher. But no such luck for oil. It is down 0.8% at $60.8/b. This week looks set for Brent crude to dip its feet in the $50ies/b. The Brent 3mth contract actually traded into the high $50ies/b on Friday.
The front-end backwardation has been on a weakening foot and is now about to fully disappear. The lowest point of the crude oil curve has also moved steadily lower and lower and its discount to the 5yr contract is now $6.8/b. A solid contango. The Brent 3mth contract did actually dip into the $50ies/b intraday on Friday when it traded to a low point of $59.93/b.
More weakness to come as lots of oil at sea comes to ports. Mid-East OPEC countries have boosted exports along with lower post summer consumption and higher production. The result is highly visibly in oil at sea which increased by 17 mb to 1,311 mb over the week to Sunday. Up 185 mb since mid-August. On its way to discharge at a port somewhere over the coming month or two.
Don’t forget that the oil market path ahead is all down to OPEC+. Remember that what is playing out in the oil market now is all by design by OPEC+. The group has decided that the unwind of the voluntary cuts is what it wants to do. In a combination of meeting demand from consumers as well as taking back market share. But we need to remember that how this plays out going forward is all at the mercy of what OPEC+ decides to do. It will halt the unwinding at some point. It will revert to cuts instead of unwind at some point.
A few months with Brent at $55/b and 40-50 US shale oil rigs kicked out may be what is needed. We think OPEC+ needs to see the exit of another 40-50 drilling rigs in the US shale oil patches to set US shale oil production on a path to of a 1 mb/d year on year decline Dec-25 to Dec-26. We are not there yet. But a 2-3 months period with Brent crude averaging $55/b would probably do it.
Oil on water increased 17 mb over the week to Sunday while oil in transit increased by 23 mb. So less oil was standing still. More was moving.

Crude oil floating storage (stationary more than 7 days). Down 11 mb over week to Sunday

The lowest point of the Brent crude oil curve versus the 5yr contract. Weakest so far this year.

Crude oil 1mth to 3mth time-spreads. Dubai held out strongly through summer, but then that center of strength fell apart in late September and has been leading weakness in crude curves lower since then.

Rebounding along with most markets. But concerns over solidity of Gaza peace may also contribute. Brent crude fell 0.8% yesterday to $61.91/b and its lowest close since May this year. This morning it is bouncing up 0.9% to $62.5/b along with a softer USD amid positive sentiment with both equities and industrial metals moving higher. Concerns that the peace in Gaza may be less solid than what one might hope for also yields some support to Brent. Bets on tech stocks are rebounding, defying fears of trade war. Money moving back into markets. Gold continues upwards its strong trend and a softer dollar helps it higher today as well.
US crude & products probably rose 5.6 mb last week (API) versus a normal seasonal decline of 2.4 mb. The US API last night partial and thus indicative data for US oil inventories. Their data indicates that US crude stocks rose 7.4 mb last week, gasoline stocks rose 3.0 mb while Distillate stocks fell 4.8 mb. Altogether an increase in commercial crude and product stocks of 5.6 mb. Commercial US crude and product stocks normally decline by 2.4 mb this time of year. So seasonally adjusted the US inventories rose 8 mb last week according to the indicative numbers by the API. That is a lot. Also, the counter seasonal trend of rising stocks versus normally declining stocks this time of year looks on a solid pace of continuation. If the API is correct then total US crude and product stocks would stand 41 mb higher than one year ago and 6 mb higher than the 2015-19 average. And if we combine this with our knowledge of a sharp increase in production and exports by OPEC(+) and a large increase in oil at sea, then the current trend in US oil inventories looks set to continue. So higher stocks and lower crude oil prices until OPEC(+) switch to cuts. Actual US oil inventory data today at 18:00 CET.
US commercial crude and product stocks rising to 1293 mb in week 41 if last nights indicative numbers from API are correct.

Crude oil soon coming to a port near you. OPEC has lifted production sharply higher this autumn. At the same time demand for oil in the Middle-East has fallen as we have moved out of summer heat and crude oil burn for power for air-conditioning. The Middle-East oil producers have thus been able to lift exports higher on both accounts. Crude oil and condensates on water has shot up by 177 mb since mid-August. This oil is now on its way to ports around the world. And when they arrive, it will likely help to lift stocks onshore higher. That is probably when we will lose the last bit of front-end backwardation the the crude oil curves. That will help to drive the front-month Brent crude oil price down to the $60/b line and revisit the high $50ies/b. Then the eyes will be all back on OPEC+ when they meet in early November and then again in early December.
Crude oil and condensates at sea have moved straight up by 177 mb since mid-August as OPEC(+) has produced more, consumed less and exported more.


Sell the rally. Trump has become predictable in his unpredictability

Gruvbolaget Boliden överträffade analytikernas förväntningar

Australien och USA investerar 8,5 miljarder USD för försörjningskedja av kritiska mineraler
Brent crude set to dip its feet into the high $50ies/b this week

Vad guldets uppgång egentligen betyder för världen

OPEC+ missar produktionsmål, stöder oljepriserna

Goldman Sachs höjer prognosen för guld, tror priset når 4900 USD

Blykalla och amerikanska Oklo inleder ett samarbete

Guld nära 4000 USD och silver 50 USD, därför kan de fortsätta stiga

Leading Edge Materials är på rätt plats i rätt tid
-
 Nyheter4 veckor sedan
OPEC+ missar produktionsmål, stöder oljepriserna
-
 Nyheter3 veckor sedan
Goldman Sachs höjer prognosen för guld, tror priset når 4900 USD
-
 Nyheter3 veckor sedan
Blykalla och amerikanska Oklo inleder ett samarbete
-
 Nyheter3 veckor sedan
Guld nära 4000 USD och silver 50 USD, därför kan de fortsätta stiga
-
 Nyheter2 veckor sedan
Leading Edge Materials är på rätt plats i rätt tid
-

 Nyheter3 veckor sedan
Nytt prisrekord, guld stiger över 4000 USD
-

 Nyheter3 veckor sedan
Ett samtal om guld, olja, koppar och stål
-
Analys3 veckor sedan
OPEC+ will likely unwind 500 kb/d of voluntary quotas in October. But a full unwind of 1.5 mb/d in one go could be in the cards