

Analys
[If demand] ”comes around as forecast, Hallelujah, we can produce more”

Saudi Arabia’s oil minister, Prince Abdulaziz bin Salman, last week stated at a conference in Calgary: ”I believe it when I see it. When reality comes around as it’s been forecast, Hallelujah, we can produce more” (Reuters, John Kemp). So Saudi Arabia wants to and will produce more once it is confident that there really is demand for additional crude. Saudi Arabia has good reason to be concerned for global oil demand. It is not the only one struggling to predict global demand amid the haze and turmoil in the global oil market following the Russian invasion of Ukraine and sanctions towards Russian crude and product stocks. Add a shaky Chinese housing market and the highest US rates since 2001. Estimates for global oil demand in Q4-23 are ranging from 100.6 m b/d to 104.7 m b/d with many estimates in between. Current crude and mid-dist inventories are low. Supply/demand is balanced to tight and clearly very tight for mid-dists (diesel, jet fuel, gasoil). But amid current speculative bullishness it is important to note that Saudi Arabia can undo the current upwards price journey just as quickly as it created the current bull-market as it drop in production from 10.5 m b/d in April to only 9.0 m b/d since July. Quickly resolving the current mid-dist crisis is beyond the powers of Saudi Arabia. But China could come to the rescue if increased oil product export quotas as it holds spare refining capacity.

The oil market is well aware that the main reasons for why oil has rallied 25% over the past months is reduced production by Saudi Arabia and Russia, global oil demand holding up better than feared together with still declining US shale oil activity. US oil drilling rig count fell by 8 rigs last week to 507 rigs which is the lowest since Feb 2022.
The big question is how strong is global oil demand and how will it hold up or even maybe increase in the coming quarters? And here the spread of estimates are still all over the place. For Q4-23 we have the following range of estimates for global oil demand in m b/d: 100.6; 101.8; 103.1; 103.2 and 104.7 from main oil market research providers. This wide spread of estimates is mindbogglingly and head-scratching both for analysts and for oil producers. It leads to a wide spread in estimates for Call-on-OPEC. Some say the current market is in a 2-3 m b/d deficit while others calculate that the global oil market today is nicely balanced.
The sanctions towards Russian crude and oil product exports with a ban on imports to the EU and UK has led to a large reshuffling of the global oil market flows which again has created a haze through which it is hard to gauge the correct state of the global oil market.
We have previously argued that there may be a significant amount of ”pent-up-demand” following the Covid-years with potential for global oil demand to surprise on the upside versus most demand forecasts. But there are also good reasons to be cautious to demand given Chinese property market woes and the highest US interest rates since 2001!
The uncertainty in global oil demand is clearly at the heart of Saudi Arabia’s production cuts since April this year. Saudi Arabia’s Energy Minister, Prince Abulaziz bin Salman, last week stated at a conference in Calgary: ”I believe it when I see it. When reality comes around as it’s been forecast, Hallelujah, we can produce more” (Reuters, John Kemp).
So if it turns out that demand is indeed stronger than Saudi Arabia fears, then we should see increased production from Saudi Arabia. Saudi could of course then argue that yes, it is stronger than expected right now, but tomorrow may be worse. Also, the continued decline in US oil drilling rig count is a home-free card for continued low production from Saudi Arabia.
Both crude stocks and mid-dist stocks (diesel, jet fuel, gasoil) are still significantly below normal and the global oil market is somewhere between balanced, mild deficit or large deficit (-2-3 m b/d). The global oil market is as such stressed due to low inventories and potentially in either mild or large deficit on top. The latter though can be undone by higher production from Saudi Arabia whenever it chooses to do so.
What is again getting center stage are the low mid-dist stocks ahead of winter. The war in Ukraine and the sanctions towards Russian crude and product stocks created chaos in the global oil product market. Refining margins went crazy last year. But they are still crazy. The global refining system got reduced maintenance in 2020 and 2021 due to Covid-19 and low staffing. Following decades of mediocre margins and losses, a lot of older refineries finally decided to close down for good during Covid as refining margins collapsed as the world stopped driving and flying. The global refining capacity contracted in 2021 for the first time in 30 years as a result. Then in 2022 refining margins exploded along with reviving global oil demand and the invasion of Ukraine. Refineries globally then ran as hard as they could, eager to make money, and reduced maintenance to a minimum for a third year in a row. Many refineries are now prone for technical failures following three years of low maintenance. This is part of the reason why mid-dist stocks struggle to rebuild. The refineries which can run however are running as hard as they can. With current refining margins they are pure money machines.
Amid all of this, Russia last week imposed an export ban for gasoline and diesel products to support domestic consumers with lower oil product prices. Russia normally exports 1.1 m b/d of diesel products and 0.2 m b/d of gasoline. The message is that it is temporary and this is also what the market expects. Russia has little oil product export storage capacity. The export ban will likely fill these up within a couple of weeks. Russia will then either have to close down refineries or restart its oil product exports.
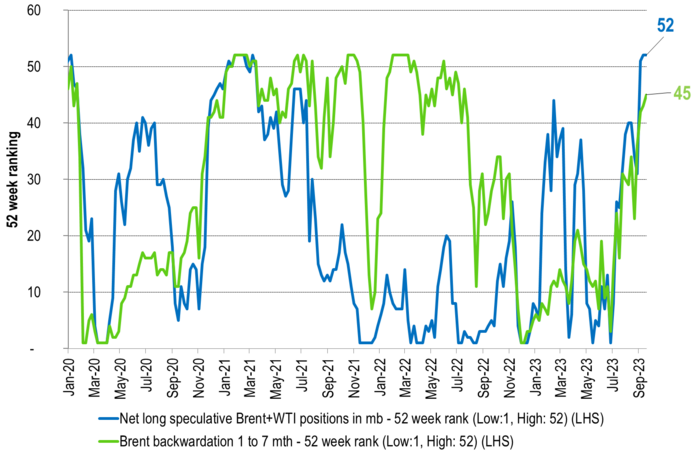
The oil market continues in a very bullish state with stress both in crude and mid-dists. Speculators continues to roll into the market with net long positions in Brent crude and WTI increasing by 29 m b over the week to last Tuesday. Since the end of June it has increased from 330 m b to now 637 m b. Net-long speculative positions are now at the highest level in 52 weeks.
The market didn’t believe Saudi Arabia this spring when it warned speculators about being too bearish on oil and that they would burn their fingers. And so they did. After having held production at 9 m b/d since July, the market finally believes in Saudi Arabia. But the market still doesn’t quite listen when Saudi says that its current production is not about driving the oil price to the sky (and beyond). It’s about concerns for global oil demand amid many macro economic challenges. It’s about being preemptive versus weakening demand. The current oil rally can thus be undone by Saudi Arabia just as it was created by Saudi Arabia. The current refinery stress is however beyond the powers of Saudi Arabia. But China could come to the rescue as it holds spare refining capacity. It could increase export quotas for oil products and thus alleviate global mid-dist shortages. The first round effect of this would however be yet stronger Chinese crude oil imports.
Brent crude and ARA diesel refining premiums/margins. It is easy to see when Russia invaded Ukraine. Diesel margins then exploded. The market is not taking the latest Russian export ban on diesel and gasoline too seriously. Not very big moves last week.
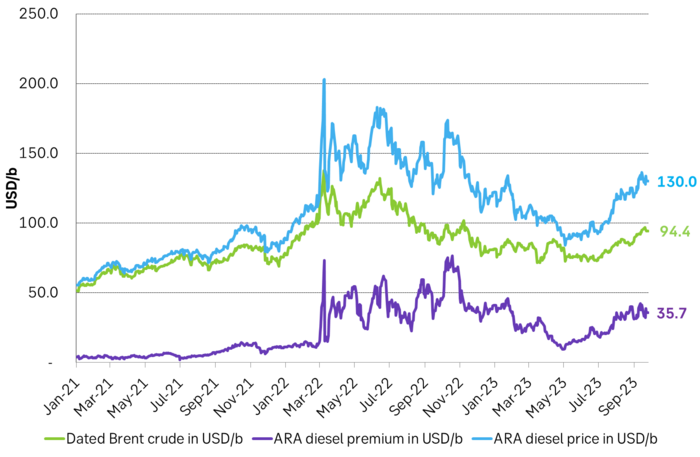
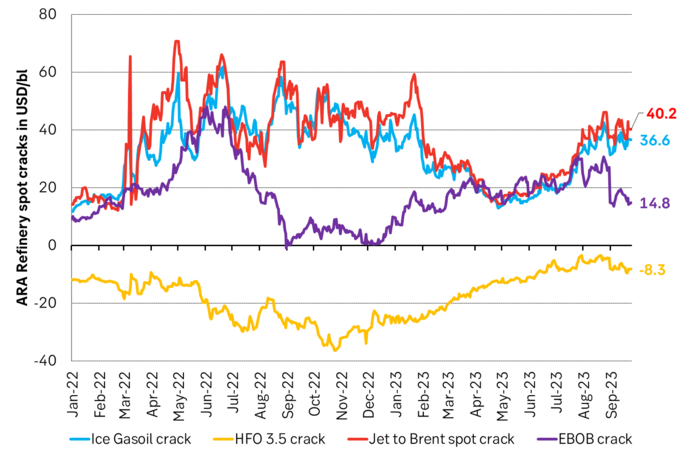
ARA mid-dist margins still exceptionally high at USD 35-40/b versus a more normal USD 12-15/b. We are now heading into the heating season, but the summer driving season is fading and so are gasoline margins.
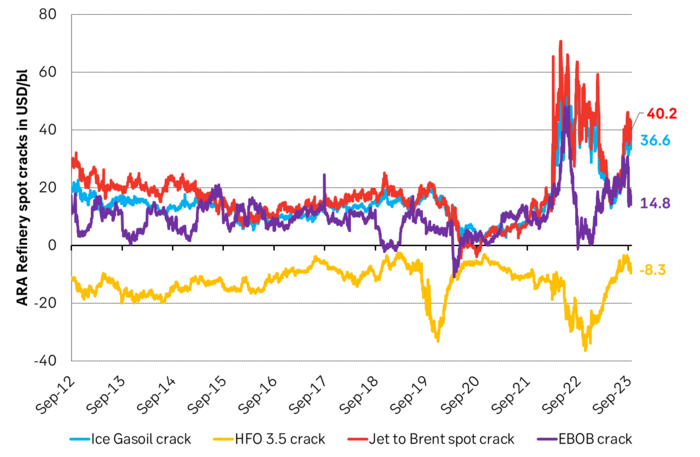
ARA mid-dist margins still exceptionally high at USD 35-40/b versus a more normal USD 12-15/b. Here same graph as above but with longer perspective to show how extreme the situation is.
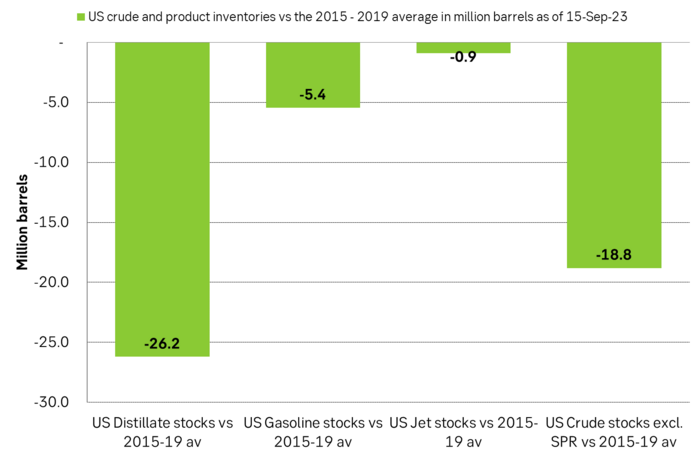
US crude and product stocks vs. the 2015-19 average. Very low mid-dist stocks.
Speculators are rolling into long positions. Now highest net long spec in 52 weeks.
Down on Friday. Up on Monday. The Brent June crude oil contract traded down 5.1% last week to a close of $90.38/b. It reached a high of $103.87/b last Monday and a low of $86.09/b on Friday as Iran announced that the Strait of Hormuz was fully open for transit. That quickly changed over the weekend as the US upheld its blockade of Iranian oil exports while Iran naturally responded by closing the SoH again. The US blew a hole in the engine room of the Iranian ship TOUSKA and took custody of the ship on Sunday. Brent crude is up 5.6% this morning to $95.4/b.

The cease-fire is expiring tomorrow. The US has said it will send a delegation for a second round of negotiations in Islamabad in Pakistan. But Iran has for now rejected a second round of talks as it views US demands as unrealistic and excessive while the US is also blocking the Strait of Hormuz.
While Brent is up 5% this morning, the financial market is still very optimistic that progress will be made. That talks will continue and that the SoH will fully open by the start of May which is consistent with a rest-of-year average Brent crude oil price of around $90/b with the market now trading that balance at around $88/b.
Financial optimism vs. physical deterioration. We have a divergence where the financial market is trading negotiations, improvements and resolution while at the same time the physical market is deteriorating day by day. Physical oil flows remain constrained by disrupted flows, longer voyage times and elevated freight and insurance costs.
Financial markets are betting that a US/Iranian resolution will save us in time from violent shortages down the road. But every day that the SoH remains closed is bringing us closer to a potentially very painful point of shortages and much higher prices.
The US blockade is also a weapon of leverage against its European and Asian allies. When Iran closed the SoH it held the world economy as a hostage against the US. The US blockade of the SoH is of course blocking Iranian oil exports. But it is also an action of disruption directed towards Europe and Asia. The US has called for the rest of the world to engaged in the war with Iran: ”If you want oil from the Persian Gulf, then go and get it”. A risk is that the US plays brinkmanship with the global oil market directed towards its European and Asian allies and maybe even towards China to force them to engage and take part. Maybe unthinkable. But unthinkable has become the norm with Trump in the White House.
Wild moves yesterday. Brent crude traded to a high of $114.43/b and a low of $96.0/b and closed at $99.94/b yesterday.
US – Iran negotiations ongoing or not? What a day. Donald Trump announced that good talks were ongoing between Iran and the US and that the 48 hour deadline before bombing Iranian power plants and energy infrastructure was postponed by five days subject to success of ongoing meetings. Iranian media meanwhile stated that no meetings were ongoing at all.
Today we are scratching our heads trying to figure out what yesterday was all about.
Friends and family playing the market? Was it just Trump and his friends and family who were playing with oil and equity markets with $580m and $1.46bn in bets being placed by someone in oil and equity markets just 15 minutes before Trump’s announcement?
Was Trump pulling a TACO as he reached his political and economic pain point: Brent at $112/b, US Gas at $4/gal, SPX below 200dma and US 10yr above 4.4%?
Different Iranian factions with Trump talking with one of them? Are there real negotiations going on but with the US talking to one faction in Iran while another, the hardliners, are not involved and are denying any such negotiations going on?
Extending the ultimatum to attack and invade Kharg island next weekend? Or, is the five day delay of the deadline a tactical decision to allow US amphibious assault ships and marines to arrive in the Gulf in the upcoming weekend while US and Israeli continues to degrade Iranian military targets till then. And then next weekend a move by the US/Israel to attack and conquer for example the Kharg island?
We do not really know which it is or maybe a combination of these.
We did get some kind of TACO ydy. But markets have been waiting for some kind of TACO to happen and yesterday we got some kind of TACO. And Brent crude is now trading at $101.5/b as a result rather than at $112-114/b as it did no the high yesterday.
But what really matters in our view is the political situation on the ground in Iran. Will hardliners continue to hold power or will a more pragmatic faction gain power?
If the hardliners remain in power then oil pain should extend all the way to US midterm elections. The hardliners were apparently still in charge as of last week. Iran immediately retaliated and damaged LNG infrastructure in Qatar after Israel hit Iranian South Pars. The SoH was still closed and all messages coming out of Iran indicated defiance. Hardliners continues in power has a huge consequence for oil prices going forward. The regime has played its ’oil-weapon’ (closing or chocking the Strait of Hormuz). It is using it to achieve political goals. Deterrence: it needs to be so politically and economically expensive to attack Iran that it won’t happen again in the future. Or at least that the US/Israel thinks 10-times over before they attack again. The highest Brent crude oil closing price since the start of the war is $112.19/b last Friday. In comparison the 20-year inflation adjusted Brent price is $103/b. So Brent crude last Friday at $112.19/b isn’t a shockingly high price. And it is still far below the nominal high of $148/b from 2008 which is $220/b if inflation adjusted. So once in a lifetime Iran activates its most powerful weapon. The oil weapon. It needs to show the power of this weapon and it needs to reap political gains. Getting Brent to $112/b and intraday high of $119.5/b (9 March) isn’t a display of the power of that weapon. And it is not a deterrence against future attacks.
So if the hardliners remain in power in Iran, then the SoH will likely remain chocked all the way to US midterm elections and Brent crude will at a minimum go above the historical nominal high of $148/b from 2008.
Thus the outlook for the oil price for the rest of the year doesn’t depend all that much of whether Trump pulls a TACO or not. Stops bombing or not. It depends more on who is in charge in Iran. If it is the hardliners, then deterrence against future attacks via chocking of the SoH and high oil prices is the likely line of action. It is impacting the world but the Iranian ’oil-weapon’ is directed towards the US president and the the US midterm elections.
If a pragmatic faction gets to power in Iran, then a very prosperous future is possible. However, if power is shifting towards a more pragmatic faction in Iran then a completely different direction could evolve. Such a faction could possibly be open for cooperation with the US and the GCC and possibly put its issues versus Israel aside. Then the prosperity we have seen evolving in Dubai could be a possible future also for Iran.
So far it looks like the hardliners are fully in charge. As far as we can see, the hardliners are still fully in control in Iran. That points towards continued chocking of the SoH and oil prices ticking higher as global inventories (the oil market buffers) are drawn lower. And not just for a few more weeks, but possibly all the way to the US midterm elections.
A brief sigh of relief yesterday as oil infra at Kharg wasn’t damaged. But higher today. Brent crude dabbled around a bit yesterday in relief that oil infrastructure at Iran’s Kharg island wasn’t damaged. It traded briefly below the 100-line and in a range of $99.54 – 106.5/b. Its close was near the low at $100.21/b.
No easy victorious way out for Trump. So no end in sight yet. Brent is up 3.2% today to $103.4/b with no signs that the war will end anytime soon. Trump has no easy way to declare victory and mission accomplished as long as Iran is in full control of the Strait of Hormuz while also holding some 440 kg of uranium enriched to 60% and not far from weapons grade at 90%. As long as these two factors are unresolved it is difficult for Trump to pull out of the Middle East. Naturally he gets increasingly frustrated over the situation as the oil price and US retail gas prices keeps ticking higher while the US is tied into the mess in the Middle East. Trying to drag NATO members into his mess but not much luck there.
When commodity prices spike they spike 2x, 3x, 4x or 5x. Supply and demand for commodities are notoriously inflexible. When either of them shifts sharply, the the price can easily go to zero (April 2022) or multiply 2x, 3x, or even 5x of normal. Examples in case cobalt in 2025 where Kongo restricted supply and the price doubled. Global LNG in 2022 where the price went 5x normal for the full year average. Demand for tungsten in ammunition is up strongly along with full war in the middle east. And its price? Up 537%.
Why hasn’t the Brent crude oil price gone 2x, 3x, 4x or 5x versus its normal of $68/b given close to full stop in the flow of oil of the Strait of Hormuz? We are after all talking about close to 20% of global supply being disrupted. The reason is the buffers. It is fairly easy to store oil. Commercial operators only hold stocks for logistical variations. It is a lot of oil in commercial stocks, but that is predominantly because the whole oil system is so huge. In addition we have Strategic Petroleum Reserves (SPRs) of close to 2500 mb of crude and 1000 mb of oil products. The IEA last week decided to release 400 mb from global SPR. Equal to 20 days of full closure of the Strait of Hormuz. Thus oil in commercial stocks on land, commercial oil in transit at sea and release of oil from SPRs is currently buffering the situation.
But we are running the buffers down day by day. As a result we see gradually increasing stress here and there in the global oil market. Asia is feeling the pinch the most. It has very low self sufficiency of oil and most of the exports from the Gulf normally head to Asia. Availability of propane and butane many places in India (LPG) has dried up very quickly. Local prices have tripled as a result. Local availability of crude, bunker oil, fuel oil, jet fuel, naphtha and other oil products is quickly running down to critical levels many places in Asia with prices shooting up. Oman crude oil is marked at $153/b. Jet fuel in Singapore is marked at $191/b.
Oil at sea originating from Strait of Hormuz from before 28 Feb is rapidly emptied. Oil at sea is a large pool of commercial oil. An inventory of oil in constant move. If we assume that the average journey from the Persian Gulf to its destinations has a volume weighted average of 13.5 days then the amount of oil at sea originating from the Persian Gulf when the the US/Israel attacked on 28 Feb was 13.5 days * 20 mb/d = 269 mb. Since the strait closed, this oil has increasingly been delivered at its destinations. Those closest to the Strait, like Pakistan, felt the emptying of this supply chain the fastest. Propane prices shooting to 3x normal there already last week and restaurants serving cold food this week is a result of that. Some 50-60% of Asia’s imports of Naphtha normally originates from the Persian Gulf. So naphtha is a natural pain point for Asia. The Gulf also a large and important exporter of Jet fuel. That shut in has lifted jet prices above $200/b.
To simplify our calculations we assume that no oil has left the Strait since that date and that there is no increase in Saudi exports from Yanbu. Then the draining of this inventory at sea originated from the Persian Gulf will essentially look like this:
The supply chain of oil at sea originating from the Strait of Hormuz is soon empty. Except for oil allowed through the Strait of Hormuz by Iran and increased exports from Yanbu in the Red Sea. Not included here.

Oil at sea is falling fast as oil is delivered without any new refill in the Persian Gulf. Waivers for Russian crude is also shifting Russian crude to consumers. Brent crude will likely start to feel the pinch much more forcefully when oil at sea is drawn down another 200 mb to around 1000 mb. That is not much more than 10 days from here.

Oil and oil products are starting to become very pricy many places. Brent crude has still been shielded from spiking like the others.


Market Still Betting on Timely Resolution, But Each Day Raises Shortage Risk

Christian Kopfer om läget för oljan

Marknaden måste börja betrakta de höga kopparpriserna som det nya normala

Det fysiska spotpriset på brentolja har slagit nytt rekord

40 minuter med Javier Blas om hur världen verkligen påverkas av energikrisen
40 minuter med Javier Blas om hur världen verkligen påverkas av energikrisen

Elpriserna fördubblas, stor osäkerhet inför sommaren

MP Materials, USA:s svar på Kinas dominans över sällsynta jordartsmetaller
Det fysiska spotpriset på brentolja har slagit nytt rekord

Studsvik har idag ansökt om att få bygga 1200-1600 MW kärnkraft i Valdemarsvik
-
 Nyheter3 veckor sedan
40 minuter med Javier Blas om hur världen verkligen påverkas av energikrisen
-
 Nyheter4 veckor sedan
Elpriserna fördubblas, stor osäkerhet inför sommaren
-
 Nyheter4 veckor sedan
MP Materials, USA:s svar på Kinas dominans över sällsynta jordartsmetaller
-
 Nyheter2 veckor sedan
Det fysiska spotpriset på brentolja har slagit nytt rekord
-
 Nyheter4 veckor sedan
Studsvik har idag ansökt om att få bygga 1200-1600 MW kärnkraft i Valdemarsvik
-
 Nyheter2 veckor sedan
Marknaden måste börja betrakta de höga kopparpriserna som det nya normala
-
Analys4 veckor sedan
TACO (or Whatever It Was) Sends Oil Lower — Iran Keeps Choking Hormuz
-

 Nyheter4 veckor sedan
Matproduktion är beroende av gödsel, Gulfkriget skapar brist