

Analys
The ”normal” oil price is USD 97/b

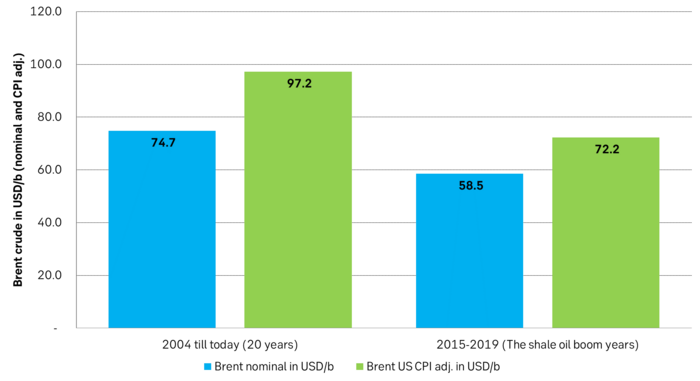
The Dated Brent crude oil price ydy closed at USD 96/b. Wow, that’s a high price! This sensation however depends on what you think is ”normal”. And normal in the eyes of most market participants today is USD 60/b. But this perception is probably largely based on the recent experience of the market. The average Brent crude oil price from 2015-2019 was USD 58.5/b. But that was a period of booming non-OPEC supply, mostly shale oil. But booming shale oil supply is now increasingly coming towards an end. Looking more broadly at the last 20 years the nominal average price was USD 75/b. But in inflation adjusted terms it was actually USD 97/b.

Saudi Arabia’s oil minister, Abdulaziz bin Salman, yesterday stated that its production cuts was not about driving the price up but instead it was preemptive versus the highly uncertain global economic development. In that respect it has a very good point. The US 2yr government bond rate has rallied to 5.06% which is the highest since 2006 and just a fraction away of being the highest since December 2000. The Chinese property market is struggling and global PMIs have been downhill since mid-2021 with many countries now at contractive, sub-50 level. Thus a deep concern for the health of the global economy and thus oil demand going forward is absolutely warranted. And thus the preemptive production cuts by Saudi Arabia. But killing the global economy off while it is wobbling with an oil price of USD 110-120/b or higher is of course not a smart thing to do either.
At the same conference in Canada yesterday the CEO of Aramco, Amin H. Nasser, said that he expected global oil demand to reach 110 m b/d in 2030 and that talk about a near term peak in global oil demand was ”driven by policies, rather than the proven combination of markets, competitive economics and technology” (Reuters).
With a demand outlook of 110 m b/d in 2030 the responsible thing to do is of course to make sure that the oil price stays at a level where investments are sufficient to cover both decline in existing production as well as future demand growth.
In terms of oil prices we tend to think about recent history and also in nominal terms. Most market participants are still mentally thinking of the oil prices we have experienced during the shale oil boom years from 2015-2019. The average nominal Brent crude price during that period was USD 58.5/b. This is today often perceived as ”the normal price”. But it was a very special period with booming non-OPEC supply whenever the WTI price moved above USD 45/b. But that period is increasingly behind us. While we could enjoy fairly low oil prices during this period it also left the world with a legacy: Subdued capex spending in upstream oil and gas all through these years. Then came the Covid-years which led to yet another trough in capex spending. We are soon talking close to 9 years of subdued capex spending.
If Amin H. Nasser is ballpark correct in his prediction that global oil demand will reach 110 m b/d in 2030 then the world should better get capex spending rolling. There is only one way to make that happen: a higher oil price. If the global economy now runs into an economic setback or recession and OPEC allows the oil price to drop to say USD 50/b, then we’d get yet another couple of years with subdued capex spending on top of the close to 9 years with subdued spending we already have behind us. So in the eyes of Saudi Arabia, Amin H. Nasser and Abdulaziz bin Salman, the responsible thing to do is to make sure that the oil price stays up at a sufficient level to ensure that capex spending stays up even during an economic downturn.
This brings us back to the question of what is a high oil price. We remember the shale oil boom years with an average nominal price of USD 58.5/b. We tend to think of it as the per definition ”normal” price. But we should instead think of it as the price depression period. A low-price period during which non-OPEC production boomed. Also, adjusting it for inflation, the real average price during this period was actually USD 72.2/b and not USD 58.5/b. If we however zoom out a little and look at the last 20 years then we get a nominal average of USD 75/b. The real, average inflation adjusted price over the past 20 years is however USD 97/b. The Dated Brent crude oil price yesterday closed at USD 96/b.
Worth noting however is that for such inflation adjustment to make sense then the assumed cost of production should actually rise along with inflation and as such create a ”rising floor price” to oil based on rising real costs. If costs in real terms instead are falling due to productivity improvements, then such inflation adjusted prices will have limited bearing for future prices. What matters more specifically is the development of real production costs for non-OPEC producers and the possibility to ramp up such production. Environmental politics in OECD countries is of course a clear limiting factor for non-OPEC oil production growth and possibly a much more important factor than the production cost it self.
But one last note on the fact that Saudi Arabia’s energy minister, Abdulaziz bin Salman, is emphasizing that the cuts are preemptive rather then an effort to drive the oil price to the sky while Amin H. Nasser is emphasizing that we need to be responsible. It means that if it turns out that the current cuts have indeed made the global oil market too tight with an oil price spiraling towards USD 110-120/b then we’ll highly likely see added supply from Saudi Arabia in November and December rather than Saudi sticking to 9.0 m b/d. This limits the risk for a continued unchecked price rally to such levels.
Oil price perspectives. We tend to think that the nominal average Brent crude oil price of USD 58.5/b during the shale oil boom years from 2015-19 is per definition the ”normal” price. But that period is now increasingly behind us. Zoom out a little to the real, average, inflation adjusted price of the past 20 years and we get USD 97/b. In mathematical terms it is much more ”normal” than the nominal price during the shale oil boom years
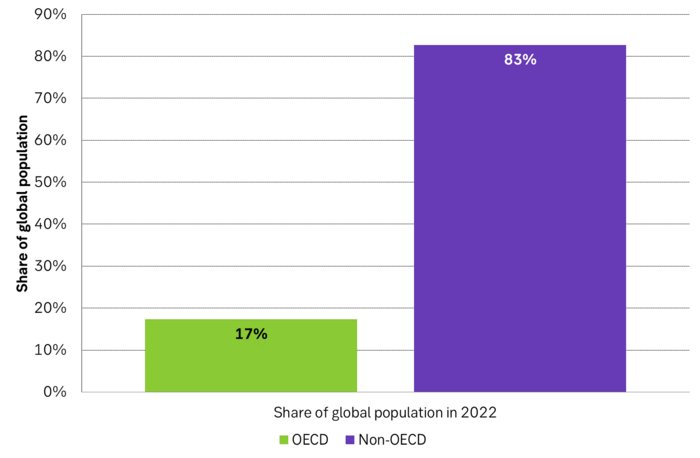
Is global oil demand about to peak 1: OECD and non-OECD share of global population
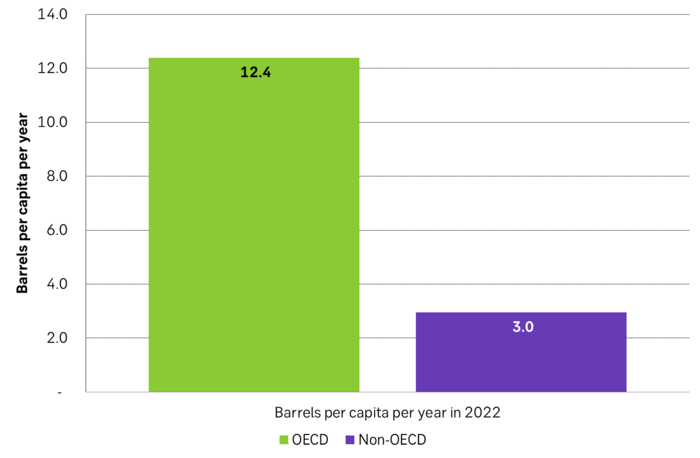
Is global oil demand about to peak 2: Oil demand per capita per year
Market is starting to take US/Iran headlines with a pinch of salt. Brent crude rose $2.8/b yesterday to an official close of $112.1/b. But after that it traded as low as $108.05/b before ending late night at around $109.7/b. Through the day it traded in a range of $106.87 – 112.72/b amid a flurry of news or rumors from Iran and the US. ”US temporary sanctions during negotiations” (falls alarm). ”We will bomb Iran” (not anyhow),… etc. While the market is still fluctuating to this kind of news flow, it is starting to take such headlines with a pinch of salt.

We’ll see. Maybe, maybe not. The Brent M1 contract is trading at $110.2/b this morning which very close to the average ticks through yesterday of $110.4/b.
Trump with bearish, verbal intervention whenever Brent trades above $110/b it seems. What seems to be a pattern is that Trump states something like ”very good negotiations going on with Iran”, ”New leaders in Iran are great,..”, ”Great progress in negotiations,…”, ”Deal in sight,..” etc whenever the Brent M1 contract trades above $110/b. An effort to cool the market. These hot air verbal interventions from Trump used to have a heavy bearish impact on prices, but they now seems to have less and less effect unless they are backed by reality.
As far as we can see there has been no real progress in the negotiations between the US and Iran with both sides still standing by their previous demands.
Iran is getting stronger while the cease fire lasts making a return to war for Trump yet harder. Iran is naturally in constant preparation for a return to war given Trump’s steady threats of bombing Iran again. Iran is naturally doing what ever is possible to prepare for a return to war. And every day the cease fire lasts it is better prepared. This naturally makes it more and more difficult and dangerous for the US to return to warring activity versus Iran as the consequences for energy infrastructure in the Persian Gulf will be more and more severe the longer the cease fire lasts. Israel seems to see it this way as well. That the war is not won and that current frozen state of a cease fire gives Iran opportunity to rebuild military and politically.
Global inventories are drawing down day by day. How much? In the meantime the Strait of Hormuz stays closed. There is varying measures and estimates of how much global inventories are drawing down. Our rough estimate, back of the envelope, is that global inventories are drawing down by at least some 10 mb/d or about 300 mb/d in a balance between loss of supply versus demand destruction. Other estimates we see are a monthly draw of 250-270 mb/d. The IEA only ’measured’ a draw in global observable stocks of 117 mb in April with oil on water rising 53 mb while on shore stocks fell 170 mb. But global stocks are hard to measure with large invisible, unmeasured stocks. As such a back of the envelope approach may be better.
Oil products is what the world is consuming. Oil product prices likely to rise while product stocks fall. Strategic Petroleum Reserves (SPR) are predominantly crude oil. Discharging oil from OECD SPR stocks, a sharp reduction in Chinese crude imports and a reduction in global refinery throughput of 6-7 mb/d has helped to keep crude oil markets satisfactorily supplied. But global inventories are drawing down none the less. And oil products is really what the world is consuming. So if global refinery throughput stays subdued, then demand will eventually have to match the supply of oil products. The likely path forward this summer is a steady draw down in jet fuel, diesel and gasoline. Higher prices for these. Then, if possible, higher refinery throughput and higher usage of crude in response to very profitable refinery margins. And lastly sharper draw in crude stocks and higher prices for these. But some 6 mb/d of oil products used to be exported through the Strait of Hormuz. And it may not be so easy to ramp up refinery activity across the world to compensate. Especially as Ukraine continues to damage Russian refineries as well as Russian crude production and export facilities.
Watch oil product stocks and prices as well as Brent calendar 2027. What to watch for this summer is thus oil product inventories falling and oil product premiums to crude rising. Another measure to watch is the Brent crude 2027 contract as it rises steadily day by day as the Strait of Hormuz stays closed and global oil inventories decline. The latter is close to the highest level since the start of the war and keeps rising.
The Brent M1 contract and the Brent 2027 prices and current price of jet fuel in Europe (ARA). All in USD/b

Our back of the envelope calculation of the global shortage created by the closure of the Strait of Hormuz. Note that 3.5 mb/d of discharge from SPR is also a draw. Note also that ’Forced demand loss’ of 2.5 mb/d is probably temporary and will fall back towards zero as logistics are sorted out leaving ’Price demand loss’ to do the job of balancing the market. Thus a shortfall of at least 9 mb/d created by the closure. More if SPR discharge is included and more if Forced demand loss recedes.

Brent is climbing higher. Front-month is at USD 106.3/bl this morning, close to a weekly high and a USD 9/bl jump from Mondays open. This is the move we flagged as a risk earlier in the week: the market shifting from ”a deal is around the corner” to ”this is going to take longer than we thought”.

Analyst Commodities, SEB
During April, rest-of-year Brent remained remarkably stable around USD 90/bl. A stability which rested on one single assumption: the SoH reopens around 1 May. That assumption is now slowly falling apart.
As we highlighted yesterday: every week of delay beyond 1 May adds (theoretically) ish USD 5/bl to the rest-of-year average, as global inventories draw 100 million barrels per week. i.e., a mid-May reopening implies rest-of-year Brent closer to USD 100/bl, and anything pushing into June or July takes us meaningfully higher.
What’s changed in the last 48 hours:
#1: The US military has formally warned that clearing suspected sea mines from SoH could take up to six months. That is a completely different timescale from what the financial market is pricing. Even a political deal tomorrow does not immediately reopen the strait.
#2: Trump has shifted his tone from urgency to ”strategic patience”. In yesterday’s press conference: ”Don’t rush me… I want a great deal.” The market is reading this as a president no longer feeling pressured by timelines, with the naval blockade running in the background.
#3: So far, the military activity is escalating, not de-escalating. Axios reports Iran is laying more mines in SoH. The US 3rd carrier strike group (USS George H.W. Bush) is arriving with two countermine vessels. Trump yesterday ordered the US Navy to destroy any Iranian boats caught laying mines. While CNN reports that the Pentagon is actively drawing up plans to strike Iranian SoH capabilities and individual Iranian military leaders if the ceasefire collapses. i.e., NOT a attitude consistent with an imminent deal!
Spot crude and product prices eased off the early-April highs on a combination of system rerouting and deal optimism. Both now weakening. Goldman estimates April Gulf output is reduced by 14.5 mbl/d, or 57% of pre-war supply, a number that keeps getting worse the longer this drags on.
Demand-side adaptation is ongoing: S. Korea has cut its Middle East crude dependence from 69% to 56% by pulling more from the Americas and Africa, and Japan is kicking off a second round of SPR releases from 1 May. But SPRs are finite.
Ref. to the negotiations, we should not bet on speed. The current Iranian leadership is dominated by genuine hardliners willing to absorb economic pain and run the clock to extract concessions. That is not a setup for a rapid resolution. US/Israeli media briefings keep framing the delay as ”internal Iranian divisions”, the reality is more complicated and points toward weeks and months, not days.
Our point is that the complexity is large, and higher prices have only just started (given a scenario where the negotiations drag out in time). The market spent April leaning on the USD 90/bl rest-of-year assumption; that case is diminishing by the hour. If ”early May reopening” is replaced by ”June, July or later” over the next week or two, both crude and products have meaningful room to reprice higher from here. There is a high risk being short energy and betting on any immediate political resolution(!).
Down on Friday. Up on Monday. The Brent June crude oil contract traded down 5.1% last week to a close of $90.38/b. It reached a high of $103.87/b last Monday and a low of $86.09/b on Friday as Iran announced that the Strait of Hormuz was fully open for transit. That quickly changed over the weekend as the US upheld its blockade of Iranian oil exports while Iran naturally responded by closing the SoH again. The US blew a hole in the engine room of the Iranian ship TOUSKA and took custody of the ship on Sunday. Brent crude is up 5.6% this morning to $95.4/b.
The cease-fire is expiring tomorrow. The US has said it will send a delegation for a second round of negotiations in Islamabad in Pakistan. But Iran has for now rejected a second round of talks as it views US demands as unrealistic and excessive while the US is also blocking the Strait of Hormuz.
While Brent is up 5% this morning, the financial market is still very optimistic that progress will be made. That talks will continue and that the SoH will fully open by the start of May which is consistent with a rest-of-year average Brent crude oil price of around $90/b with the market now trading that balance at around $88/b.
Financial optimism vs. physical deterioration. We have a divergence where the financial market is trading negotiations, improvements and resolution while at the same time the physical market is deteriorating day by day. Physical oil flows remain constrained by disrupted flows, longer voyage times and elevated freight and insurance costs.
Financial markets are betting that a US/Iranian resolution will save us in time from violent shortages down the road. But every day that the SoH remains closed is bringing us closer to a potentially very painful point of shortages and much higher prices.
The US blockade is also a weapon of leverage against its European and Asian allies. When Iran closed the SoH it held the world economy as a hostage against the US. The US blockade of the SoH is of course blocking Iranian oil exports. But it is also an action of disruption directed towards Europe and Asia. The US has called for the rest of the world to engaged in the war with Iran: ”If you want oil from the Persian Gulf, then go and get it”. A risk is that the US plays brinkmanship with the global oil market directed towards its European and Asian allies and maybe even towards China to force them to engage and take part. Maybe unthinkable. But unthinkable has become the norm with Trump in the White House.


Sommarväder skapar prisrally på elbörsen
Oil product price pain is set to rise as the Strait of Hormuz stays closed into summer

Solkraften pressar elpriserna dagtid

Michel Gubel ger sin syn på oljemarknaden