

Analys
We can confidently say yet again that Saudi Arabia is the boss

Crude oil prices are pulling back this morning on China concerns. But Saudi Arabia is probably very happy with the overall situation. It has showed the oil market yet again who’s the boss and the world will also need more of its oil in the coming months. The global market is set to run a deficit of 1.7 m b/d in Q4-23 according to the latest IEA report if Russia and Saudi Arabia sticks to their current production. After now having put the market strait there is no reason for Saudi Arabia to let such a deep deficit and inventory draw actually play out. It would lead to much higher prices but Saudi would also receive a lot of political pain from the US, China, India, Europe. Why ruin the party with oil rallying above USD 100/b and drive up an ugly political debacle when oil at USD 85/b is such a beautiful place. Tapering of Saudi Arabia’s cuts in Q4-23 would be the natural thing to expect. But all through September at least there should be a very sharp and tight market.

Through most of the first half of this year all up until late June there was deep disagreement with respect to global oil demand. In its June oil market report (STEO), the US EIA projected an oil demand in Q4-23 of 101.8 m b/d while the IEA in its OMR report the same month projected a Q4-23 demand of 103.5 m b/d. Such magnitudes of diverging views with respect to global oil demand is very rare. Markets didn’t really know what to believe with deep fear of deteriorating economic outlook on top due to sky rocketing interest rates around the world and a sluggish Chinese economy. The actual level of global oil demand is usually something we only really know in hindsight. With lots of facts in hand the IEA now estimates that global demand was 103 m b/d in June and expects it to be 103.1 m b/d in Q4-23.
The world did indeed get a strong rebound in global oil demand as the world increasingly and fully emerged from Covid-19 restrictions. Increased flying, driving and strong demand for petrochemicals. But it took a little longer to materialize than expected and it was shrouded in fears over the direction of the global economy. Global demand at 103 m b/d is not about a vigorously growing global economy but mostly about normalization post Covid-19. The IEA now estimates that global demand this year will average 102.2 m b/d versus 99.9 m b/d in 2022 giving a rebound of 2.2 m b/d YoY. But if it hadn’t been for Covid-19 then global oil demand would probably have been averaging close to 106 m b/d this year and 106.5 m b/d in H2-23 if we assume the normal 1.3% oil demand growth since 2019 had taken place. Much of this normal oil demand growth is due to population growth which is relentlessly rising higher. There is thus still a potentially huge, pent up demand for oil which may have built up during the Covid-19 years. Whether that potential pent up demand will actually emerge or not remains to be seen. But for now we are at a solid 103 m b/d demand. This is what the market can see and believe in. But significant pent up demand may be lurking behind the curtains.
Saudi Arabia was probably very frustrated with financial oil markets as they sold oil heavily in H1-23 and drove prices lower even as Saudi Arabia could see in its physical oil books that demand was robust. Saudi Arabia made deep cuts to production from 10.5 m b/d in April and all the way down to almost 9.0 m b/d in July with same level also in August and September. This isn’t Saudi Arabia’s first rodeo and it has really showed the market yet again who’s the boss.
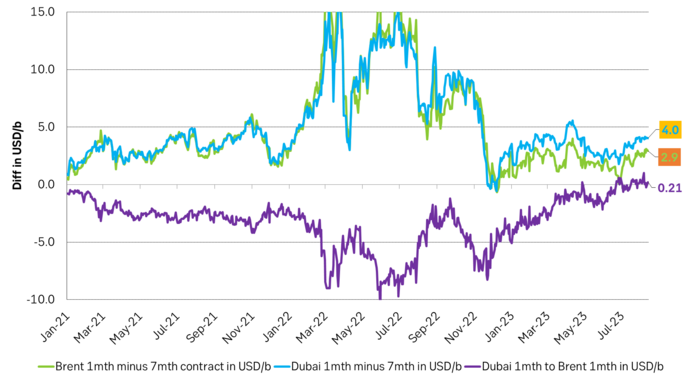
Global oil demand normally rises by 1.3 m b/d from H1 to H2. Production from OPEC+ has however declined by 1.6 m b/d from April to August. And market is now very tight. If Saudi Arabia and Russia sticks to their current production levels throughout H2-23 then the IEA projects a draw in global oil inventories of 1.7 m b/d. That is a big, big draw which would drive oil prices yet higher. The price of sour crude (Dubai) which normally trades at at discount to sweet crudes is now instead trading at a premium. That is how tight the sour crude market has gotten.
But Saudi Arabia now has plenty of spare capacity at hand and it can easily lift production by 1.5 m b/d again back up to 10.5 m b/d. While they may chose to keep production at around 9.0 m b/d for a little while longer they have no good reason to drive the oil price up to USD 100-110/b. That will only give them large political problems with their main consumers. For sure neither the US nor China or India will be very happy.
Saudi Arabia should be fully content for the moment. It has shown the market yet again who’s the boss. It has driven the oil price back up to a very satisfying level of USD 85/b (ish). The world needs more of its oil and Saudi has spare capacity to provide it. Could it be better? Hardly.
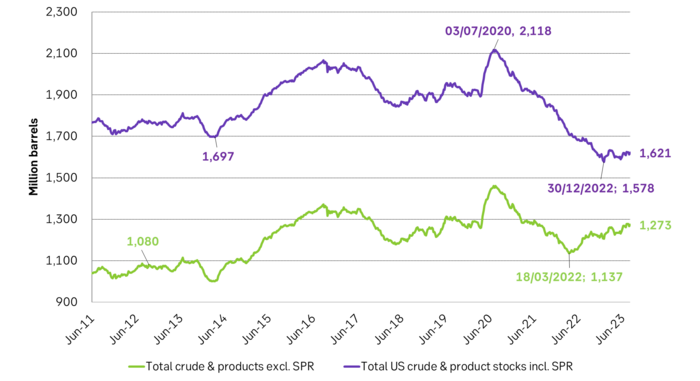
US oil inventories with and without SPR. We still haven’t seen a decline in US crude and product stocks excluding SPR. But that will be the proof of the pudding. A running global deficit of 1.7 m b/d will eventually show up in declining US crude and product stocks.
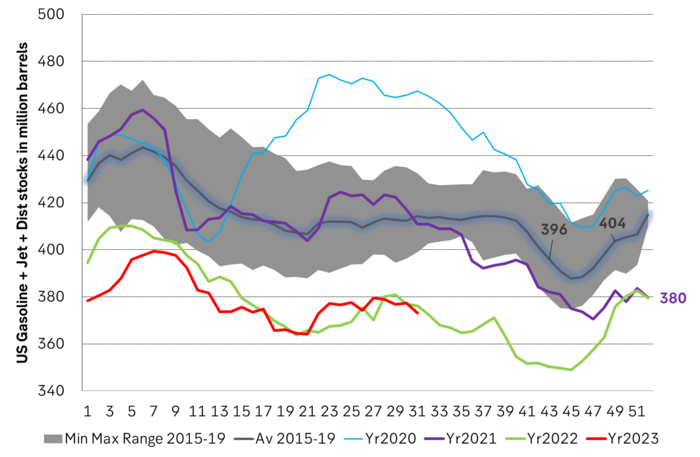
Main oil product stocks in the US are lower this year than last year. At least a little. Refining margins are very strong as a result of reviving global demand for gasoline and jet fuel. When refining margins are strong then refineries make a lot of money and then they buy a lot of crude oil to make more.
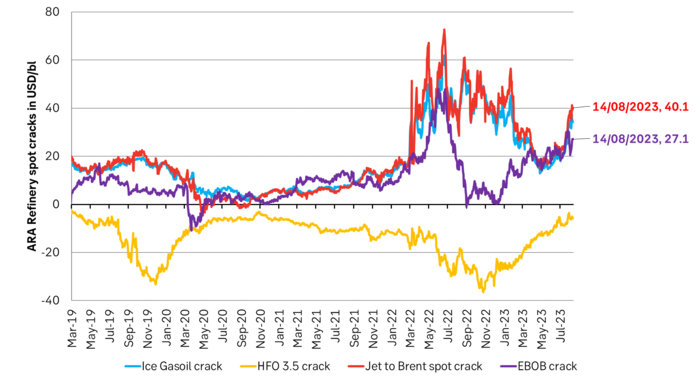
Refining margins ticked lower following crazy levels in 2022 but have now shot back up again as demand for gasoline and jet fuel has revived post Covid-19.
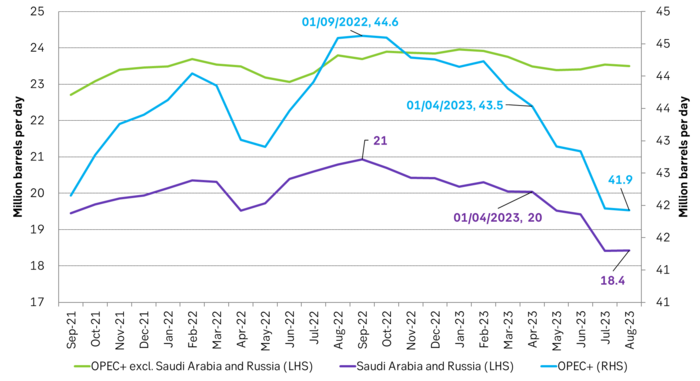
Significant cuts from Saudi Arabia and some cuts by Russia has made total OPEC+ production fall like a rock (blue line). But that also means there is more spare capacity at hand.
The sharp decline in production from OPEC+ has led to a rebound in the time spreads for both Brent crude and Dubai crude. The tightening by OPEC+ is so large that Dubai sour crude now trades at a premium to Brent crude which is highly unusual (lilac graph).

Wild moves yesterday. Brent crude traded to a high of $114.43/b and a low of $96.0/b and closed at $99.94/b yesterday.

US – Iran negotiations ongoing or not? What a day. Donald Trump announced that good talks were ongoing between Iran and the US and that the 48 hour deadline before bombing Iranian power plants and energy infrastructure was postponed by five days subject to success of ongoing meetings. Iranian media meanwhile stated that no meetings were ongoing at all.
Today we are scratching our heads trying to figure out what yesterday was all about.
Friends and family playing the market? Was it just Trump and his friends and family who were playing with oil and equity markets with $580m and $1.46bn in bets being placed by someone in oil and equity markets just 15 minutes before Trump’s announcement?
Was Trump pulling a TACO as he reached his political and economic pain point: Brent at $112/b, US Gas at $4/gal, SPX below 200dma and US 10yr above 4.4%?
Different Iranian factions with Trump talking with one of them? Are there real negotiations going on but with the US talking to one faction in Iran while another, the hardliners, are not involved and are denying any such negotiations going on?
Extending the ultimatum to attack and invade Kharg island next weekend? Or, is the five day delay of the deadline a tactical decision to allow US amphibious assault ships and marines to arrive in the Gulf in the upcoming weekend while US and Israeli continues to degrade Iranian military targets till then. And then next weekend a move by the US/Israel to attack and conquer for example the Kharg island?
We do not really know which it is or maybe a combination of these.
We did get some kind of TACO ydy. But markets have been waiting for some kind of TACO to happen and yesterday we got some kind of TACO. And Brent crude is now trading at $101.5/b as a result rather than at $112-114/b as it did no the high yesterday.
But what really matters in our view is the political situation on the ground in Iran. Will hardliners continue to hold power or will a more pragmatic faction gain power?
If the hardliners remain in power then oil pain should extend all the way to US midterm elections. The hardliners were apparently still in charge as of last week. Iran immediately retaliated and damaged LNG infrastructure in Qatar after Israel hit Iranian South Pars. The SoH was still closed and all messages coming out of Iran indicated defiance. Hardliners continues in power has a huge consequence for oil prices going forward. The regime has played its ’oil-weapon’ (closing or chocking the Strait of Hormuz). It is using it to achieve political goals. Deterrence: it needs to be so politically and economically expensive to attack Iran that it won’t happen again in the future. Or at least that the US/Israel thinks 10-times over before they attack again. The highest Brent crude oil closing price since the start of the war is $112.19/b last Friday. In comparison the 20-year inflation adjusted Brent price is $103/b. So Brent crude last Friday at $112.19/b isn’t a shockingly high price. And it is still far below the nominal high of $148/b from 2008 which is $220/b if inflation adjusted. So once in a lifetime Iran activates its most powerful weapon. The oil weapon. It needs to show the power of this weapon and it needs to reap political gains. Getting Brent to $112/b and intraday high of $119.5/b (9 March) isn’t a display of the power of that weapon. And it is not a deterrence against future attacks.
So if the hardliners remain in power in Iran, then the SoH will likely remain chocked all the way to US midterm elections and Brent crude will at a minimum go above the historical nominal high of $148/b from 2008.
Thus the outlook for the oil price for the rest of the year doesn’t depend all that much of whether Trump pulls a TACO or not. Stops bombing or not. It depends more on who is in charge in Iran. If it is the hardliners, then deterrence against future attacks via chocking of the SoH and high oil prices is the likely line of action. It is impacting the world but the Iranian ’oil-weapon’ is directed towards the US president and the the US midterm elections.
If a pragmatic faction gets to power in Iran, then a very prosperous future is possible. However, if power is shifting towards a more pragmatic faction in Iran then a completely different direction could evolve. Such a faction could possibly be open for cooperation with the US and the GCC and possibly put its issues versus Israel aside. Then the prosperity we have seen evolving in Dubai could be a possible future also for Iran.
So far it looks like the hardliners are fully in charge. As far as we can see, the hardliners are still fully in control in Iran. That points towards continued chocking of the SoH and oil prices ticking higher as global inventories (the oil market buffers) are drawn lower. And not just for a few more weeks, but possibly all the way to the US midterm elections.
A brief sigh of relief yesterday as oil infra at Kharg wasn’t damaged. But higher today. Brent crude dabbled around a bit yesterday in relief that oil infrastructure at Iran’s Kharg island wasn’t damaged. It traded briefly below the 100-line and in a range of $99.54 – 106.5/b. Its close was near the low at $100.21/b.
No easy victorious way out for Trump. So no end in sight yet. Brent is up 3.2% today to $103.4/b with no signs that the war will end anytime soon. Trump has no easy way to declare victory and mission accomplished as long as Iran is in full control of the Strait of Hormuz while also holding some 440 kg of uranium enriched to 60% and not far from weapons grade at 90%. As long as these two factors are unresolved it is difficult for Trump to pull out of the Middle East. Naturally he gets increasingly frustrated over the situation as the oil price and US retail gas prices keeps ticking higher while the US is tied into the mess in the Middle East. Trying to drag NATO members into his mess but not much luck there.
When commodity prices spike they spike 2x, 3x, 4x or 5x. Supply and demand for commodities are notoriously inflexible. When either of them shifts sharply, the the price can easily go to zero (April 2022) or multiply 2x, 3x, or even 5x of normal. Examples in case cobalt in 2025 where Kongo restricted supply and the price doubled. Global LNG in 2022 where the price went 5x normal for the full year average. Demand for tungsten in ammunition is up strongly along with full war in the middle east. And its price? Up 537%.
Why hasn’t the Brent crude oil price gone 2x, 3x, 4x or 5x versus its normal of $68/b given close to full stop in the flow of oil of the Strait of Hormuz? We are after all talking about close to 20% of global supply being disrupted. The reason is the buffers. It is fairly easy to store oil. Commercial operators only hold stocks for logistical variations. It is a lot of oil in commercial stocks, but that is predominantly because the whole oil system is so huge. In addition we have Strategic Petroleum Reserves (SPRs) of close to 2500 mb of crude and 1000 mb of oil products. The IEA last week decided to release 400 mb from global SPR. Equal to 20 days of full closure of the Strait of Hormuz. Thus oil in commercial stocks on land, commercial oil in transit at sea and release of oil from SPRs is currently buffering the situation.
But we are running the buffers down day by day. As a result we see gradually increasing stress here and there in the global oil market. Asia is feeling the pinch the most. It has very low self sufficiency of oil and most of the exports from the Gulf normally head to Asia. Availability of propane and butane many places in India (LPG) has dried up very quickly. Local prices have tripled as a result. Local availability of crude, bunker oil, fuel oil, jet fuel, naphtha and other oil products is quickly running down to critical levels many places in Asia with prices shooting up. Oman crude oil is marked at $153/b. Jet fuel in Singapore is marked at $191/b.
Oil at sea originating from Strait of Hormuz from before 28 Feb is rapidly emptied. Oil at sea is a large pool of commercial oil. An inventory of oil in constant move. If we assume that the average journey from the Persian Gulf to its destinations has a volume weighted average of 13.5 days then the amount of oil at sea originating from the Persian Gulf when the the US/Israel attacked on 28 Feb was 13.5 days * 20 mb/d = 269 mb. Since the strait closed, this oil has increasingly been delivered at its destinations. Those closest to the Strait, like Pakistan, felt the emptying of this supply chain the fastest. Propane prices shooting to 3x normal there already last week and restaurants serving cold food this week is a result of that. Some 50-60% of Asia’s imports of Naphtha normally originates from the Persian Gulf. So naphtha is a natural pain point for Asia. The Gulf also a large and important exporter of Jet fuel. That shut in has lifted jet prices above $200/b.
To simplify our calculations we assume that no oil has left the Strait since that date and that there is no increase in Saudi exports from Yanbu. Then the draining of this inventory at sea originated from the Persian Gulf will essentially look like this:
The supply chain of oil at sea originating from the Strait of Hormuz is soon empty. Except for oil allowed through the Strait of Hormuz by Iran and increased exports from Yanbu in the Red Sea. Not included here.

Oil at sea is falling fast as oil is delivered without any new refill in the Persian Gulf. Waivers for Russian crude is also shifting Russian crude to consumers. Brent crude will likely start to feel the pinch much more forcefully when oil at sea is drawn down another 200 mb to around 1000 mb. That is not much more than 10 days from here.

Oil and oil products are starting to become very pricy many places. Brent crude has still been shielded from spiking like the others.

Closing at highest since Aug 2022. Brent crude gained 9.2% yesterday. The trading range was limited to $95.2 – 101.85/b with a close at $100.46/b and higher than the Monday close of $98.96/b. Ydy close was the highest close since August 2022. This morning Brent is up 2% to $102.4/b and is trading at the highest intraday level since Monday when it high an intraday high of $119.5/b.
A military hit at Iran’s Kharg island would be a big, big bang for the oil price. The big, big risk for the weekend is that oil infrastructure could be damaged. For example Iran’s Kharg island which is Iran’s major oil export hub. If damaged we would have a longer lasting loss of supply stretching way beyond Trump’s announced ”two more weeks”. It will make the spot price spike higher and it will lift the curve. Brent crude 2027 swap would jump above $80/b immediately. An attack on Kharg island would naturally lead Iran to strike back at other oil infrastructures in the Gulf. Especially those belonging to countries who harbor US military bases. I.e. countries who essentially are supporting the attack by US and Israel towards Iran. Though if not in spirit, then in practical operational terms. An attack on Kharg island would not just lead to a lasting outage of supply from Iran until it would be repaired. It would immediately endanger other oil infrastructure in the region as well and additional lasting loss of supply.
No one in their right mind would dare to sit short oil over the coming weekend. Oil is thus set to close the week at a very strong note today.
Prepare for another 400 mb SPR release next week. This week’s announcement of a 400 mb release from Strategic Oil Reserves totally underwhelmed the market with the oil price going higher rather than lower following the announcement. For one it means that the market expects the war and the closure of the Strait of Hormuz to last longer than Trump’s recent announced ”two more weeks”. 400 mb only amounts to 20 days of lost supply to the world through Hormuz and we are already at day 14. So next week when we are getting close to the 20 day mark, we are likely to see another announcement of another 400 mb release of SPR stocks to the market. Preparing for the next 20 days of war.
Global oil logistics in total disarray. We have previously addressed the issue of the huge logistical web of the global oil market which is now in total disarray. The logistical disruption started to fry the oil market at the end of last week. Helped to spike the oil market on Monday. What we hear from our shipping clients is that the problems with supply of fuels locally in Korea, Singapore, India and Africa are getting worse with physical availability of fuels there drying up. It is getting increasingly difficult to find physical supply of bunker oil with local, physical prices shooting way higher than financial benchmarks. To the point that biofuels have become the cheap option many places. Availability of fuels in the US is still good. Not so surprising as the US is self-sufficient with crude and refineries.
The disruption in global oil logistics doesn’t seem to improve. Rather the opposite. If you cannot get fuel to run your ships, then how can you distribute fuels to where it is needed.
Buy Brent Dec-2026 calls with strike $150/b!! As the days goes by the oil price is ticking higher while Trump is getting one day closer to US midterm elections. Trump was betting that he could put this war to bead well before November. But that will probably not be up to him to decide. It will be up to Iran to decide when to reopen the Strait of Hormuz. It is very hard to imagine that Iran will let Trump easily off the hock after he has killed its Supreme Leader. This will likely go all the way to November. Buy Brent Dec-2026 calls with strike $150/b!!
Brent closed at highest since 2022 ydy. Will end this Friday at a very strong note! Consumers still dreaming of $60/b oil


Christian Kopfer om läget för oljan

Marknaden måste börja betrakta de höga kopparpriserna som det nya normala

Det fysiska spotpriset på brentolja har slagit nytt rekord

40 minuter med Javier Blas om hur världen verkligen påverkas av energikrisen

Efter tillväxten: Guldbrev satsar på expansion i Europa
40 minuter med Javier Blas om hur världen verkligen påverkas av energikrisen

Elpriserna fördubblas, stor osäkerhet inför sommaren

MP Materials, USA:s svar på Kinas dominans över sällsynta jordartsmetaller
Det fysiska spotpriset på brentolja har slagit nytt rekord

Studsvik har idag ansökt om att få bygga 1200-1600 MW kärnkraft i Valdemarsvik
-
 Nyheter2 veckor sedan
40 minuter med Javier Blas om hur världen verkligen påverkas av energikrisen
-
 Nyheter4 veckor sedan
Elpriserna fördubblas, stor osäkerhet inför sommaren
-
 Nyheter4 veckor sedan
MP Materials, USA:s svar på Kinas dominans över sällsynta jordartsmetaller
-
 Nyheter2 veckor sedan
Det fysiska spotpriset på brentolja har slagit nytt rekord
-
 Nyheter4 veckor sedan
Studsvik har idag ansökt om att få bygga 1200-1600 MW kärnkraft i Valdemarsvik
-
 Nyheter2 veckor sedan
Marknaden måste börja betrakta de höga kopparpriserna som det nya normala
-

 Nyheter4 veckor sedan
Matproduktion är beroende av gödsel, Gulfkriget skapar brist
-
Analys4 veckor sedan
TACO (or Whatever It Was) Sends Oil Lower — Iran Keeps Choking Hormuz