

Analys
Dollar Weakness Helps Gold To All-Time Highs
Gold Passes Two Important Sign-Posts

The gold bull market passed two important sign-posts in July. The strength of the market is impressive as it blew through $1,800 and the all-time high of $1,921. These prices had been major technical resistance points set a decade ago.
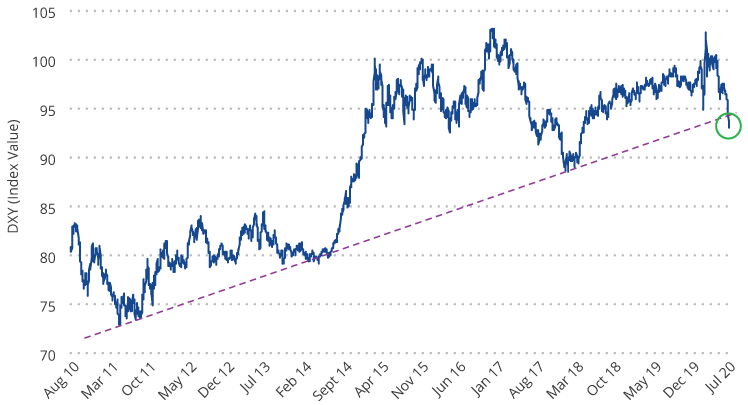
The second significant signpost in July was the new U.S. dollar weakness. U.S. dollar weakness is a hallmark of most gold bull markets, but in this cycle gold had so far been rising in a flat dollar environment. The chart below shows the U.S. dollar index (DXY)1 has been in a bull market since 2011. However, the dollar declined through July, then fell precipitously at the end of the month, appearing to have broken its long-term trend. We may be seeing the beginnings of a bear market for the dollar. This enabled gold to test the $2,000 per ounce milestone as it reached an intraday high of $1,983 on July 31. Gold closed out July at $1,975.86 per ounce for a $194.90 (10.9%) monthly gain.
U.S. Dollar Index Breaking Its Near 10-Year Support Trend (2011 to 2020)?
Gold Miners Remain Well Positioned (Especially Junior Developers)
Gold stocks moved higher as the vast majority of companies reporting second quarter results met or exceeded expectations. COVID-related costs were also reported, showing the industry has done an excellent job of dealing with operational issues in our view. For example, 1.7 million ounce producer Agnico-Eagle (approximately net assets of 4.7% as of end-July) was among those hardest hit by pandemic lock downs. Its costs for temporary mine suspensions totaled $22 million, whereas the cash provided from operations totaled $162 million. Going forward, per the company’s second quarter 2020 financial results, Agnico-Eagle expects COVID protocols to cost $6 per ounce, which raises their cash costs by less than 1%. For the month, the NYSE Gold Miners Index (GDMNTR)2 gained 14.4%, while the MVIS Global Junior Gold Miners Index (MVGDXJTR)3 advanced 19.8%.
Junior developers are a class of company that you won’t find much of in passive index funds. These are companies with properties that are in various stages of development, but not yet producing gold. Our active gold equity strategy invests across the spectrum of companies and currently carries 22 junior developers that total approximately 26% of the strategy’s net assets as of end-July. These companies had been underperforming since the gold price broke out in June 2019. This is a sharp contrast from past bull markets, when the juniors began outperforming the larger companies much earlier. Through the second quarter and into July, the junior developers have finally kicked into gear. Seven of our juniors have now gained over 100% year to date. We don’t expect to give back these gains because the stocks had been extremely undervalued and many of our companies have announced encouraging drill results and new discoveries that create lasting value. In addition, investors have returned to the junior sector, enabling companies to raise $1.5 billion this year, and the second quarter was their strongest for equity raises since 2012, according to RBC Capital Markets.
$2,000 Gold Is About More Than Just The Pandemic
Gold has tested the $2,000 per ounce level sooner than we had anticipated and we believe there is more than the pandemic to overcome at this point.
- Slower Recovery – During July, two Federal Reserve (Fed) presidents, a Fed governor, and its Chairman all warned of a long, slow road to economic recovery. Initial jobless claims have stagnated for eight weeks at around 1.4 to 1.5 million. Contrast this with the Global Financial Crisis (GFC), where initial jobless claims declined steadily to 587,000 in the same time frame, seventeen weeks after the recession peak. JPMorgan said it was preparing for an unemployment rate that remains in double digits well into next year and a slower recovery in gross domestic product (GDP) than the bank’s economists assumed three months ago.
- Deficits, Debt & Defaults – The U.S. budget deficit totaled $863 billion in June, as much as the entire gap in 2019. With the new stimulus bill now being considered in Congress, the annual deficit could exceed $4.7 trillion. This is on top of record peace-time deficits before the pandemic.
Corporate debt is also at record levels and many households are feeling financial stress. Ultra low interest rates over the past two decades have encouraged the accumulation of unproductive government and private debt. It fuels the rise of giant firms, while “zombie” companies (companies with earnings less than their debt service costs) have proliferated. This is at the expense of start-ups, innovation and creative destruction. The result is low levels of productivity, causing recoveries to become weaker and weaker. The Wall Street Journal reports the largest U.S. banks have set aside $28 billion to cover losses as consumers and businesses start to default on their loans.
What Could Drive Gold Prices Even Higher?
The pandemic created a deflationary shock to the economy and the massive accumulation of debt since the GFC creates a drag on productivity that could guarantee a low growth economy for decades to come. Negative real rates, persistent risks to economic well-being, and the weak dollar are drivers that we believe could enable gold to trend to $3,400 per ounce in the coming years. This might be a conservative forecast considering the 180% rise gold experienced from the depths of the GFC. Several scenarios could see gold prices moving higher from there:
- Systemic collapse as debt issuance overwhelms the financial markets.
- An inflationary cycle brought on by either: a) trillions of U.S. dollars, euros, yen and yuan being pumped into the global financial system, b) governments enabling inflation to ease the debt burden, c) implementation of modern monetary theory or other forms of money printing to fund government spending without issuing debt.
- U.S. Dollar Crisis – America is dealing with deficits, divisive politics, social unrest and deteriorating international relations on a scale rarely seen in history. While other countries may have similar problems, they do not oversee the world’s reserve currency. The U.S. is held to a higher standard and a crisis of confidence could weigh heavily on the dollar.
Some might balk at such bold forecasts, however, we believe the various drivers of gold are rarely aligned as they are today. We also consider gold’s relative size in the financial markets. There have been 200,000 tonnes of gold mined in the history of the world and virtually all of it is potentially available to the market. A gold price of $2,000 per ounce yields a market value of $12.9 trillion. Compare this with global stock, bond and currency markets, each of which totals roughly $100 trillion or more. A relatively small shift in funds from these markets may fuel the gold price for a long time.
In addition, the market value of the global gold industry as of end-July is approximately $530 billion. The market value of Alphabet Inc. as of the same time, alone, is $1.0 trillion. Gold mining is a relatively tiny sector that, in addition to carrying earnings leverage to the gold price, carries a scarcity factor when market demand is high.
1U.S. Dollar Index (DXY) indicates the general international value of the U.S. dollar by averaging the exchange rates between the U.S. dollar and six major world currencies.
2NYSE Arca Gold Miners Index (GDMNTR) is a modified market capitalization-weighted index comprised of publicly traded companies involved primarily in the mining for gold.
3MVIS Global Junior Gold Miners Index (MVGDXJTR) is a rules-based, modified market capitalization-weighted, float-adjusted index comprised of a global universe of publicly traded small- and medium-capitalization companies that generate at least 50% of their revenues from gold and/or silver mining, hold real property that has the potential to produce at least 50% of the company’s revenue from gold or silver mining when developed, or primarily invest in gold or silver.
Joe Foster, Portfolio Manager/Strategist, VanEck
This commentary originates from VanEck Investments Ltd, a UCITS Management Company under Irish law regulated by the Central Bank of Ireland and VanEck Asset Management B.V., a UCITS Management Company under Dutch law regulated by the Netherlands Authority for the Financial Markets. It is intended only to provide general and preliminary information to investors and shall not be construed as investment, legal or tax advice. VanEck Investments Ltd, VanEck Asset Management B.V. and its associated and affiliated companies (together “VanEck”) assume no liability with regards to any investment, divestment or retention decision taken by the investor on the basis of this commentary. The views and opinions expressed are those of the author(s) but not necessarily those of VanEck. Opinions are current as of the commentary’s publication date and are subject to change with market conditions. Certain statements contained herein may constitute projections, forecasts and other forward looking statements, which do not reflect actual results. Information provided by third party sources are believed to be reliable and have not been independently verified for accuracy or completeness and cannot be guaranteed. All indices mentioned are measures of common market sectors and performance. It is not possible to invest directly in an index.
All performance information is historical and is no guarantee of future results. Investing is subject to risk, including the possible loss of principal. You must read the Prospectus and KIID before investing in a fund.
No part of this material may be reproduced in any form, or referred to in any other publication, without express written permission of VanEck.


Down on Friday. Up on Monday. The Brent June crude oil contract traded down 5.1% last week to a close of $90.38/b. It reached a high of $103.87/b last Monday and a low of $86.09/b on Friday as Iran announced that the Strait of Hormuz was fully open for transit. That quickly changed over the weekend as the US upheld its blockade of Iranian oil exports while Iran naturally responded by closing the SoH again. The US blew a hole in the engine room of the Iranian ship TOUSKA and took custody of the ship on Sunday. Brent crude is up 5.6% this morning to $95.4/b.

The cease-fire is expiring tomorrow. The US has said it will send a delegation for a second round of negotiations in Islamabad in Pakistan. But Iran has for now rejected a second round of talks as it views US demands as unrealistic and excessive while the US is also blocking the Strait of Hormuz.
While Brent is up 5% this morning, the financial market is still very optimistic that progress will be made. That talks will continue and that the SoH will fully open by the start of May which is consistent with a rest-of-year average Brent crude oil price of around $90/b with the market now trading that balance at around $88/b.
Financial optimism vs. physical deterioration. We have a divergence where the financial market is trading negotiations, improvements and resolution while at the same time the physical market is deteriorating day by day. Physical oil flows remain constrained by disrupted flows, longer voyage times and elevated freight and insurance costs.
Financial markets are betting that a US/Iranian resolution will save us in time from violent shortages down the road. But every day that the SoH remains closed is bringing us closer to a potentially very painful point of shortages and much higher prices.
The US blockade is also a weapon of leverage against its European and Asian allies. When Iran closed the SoH it held the world economy as a hostage against the US. The US blockade of the SoH is of course blocking Iranian oil exports. But it is also an action of disruption directed towards Europe and Asia. The US has called for the rest of the world to engaged in the war with Iran: ”If you want oil from the Persian Gulf, then go and get it”. A risk is that the US plays brinkmanship with the global oil market directed towards its European and Asian allies and maybe even towards China to force them to engage and take part. Maybe unthinkable. But unthinkable has become the norm with Trump in the White House.
Wild moves yesterday. Brent crude traded to a high of $114.43/b and a low of $96.0/b and closed at $99.94/b yesterday.
US – Iran negotiations ongoing or not? What a day. Donald Trump announced that good talks were ongoing between Iran and the US and that the 48 hour deadline before bombing Iranian power plants and energy infrastructure was postponed by five days subject to success of ongoing meetings. Iranian media meanwhile stated that no meetings were ongoing at all.
Today we are scratching our heads trying to figure out what yesterday was all about.
Friends and family playing the market? Was it just Trump and his friends and family who were playing with oil and equity markets with $580m and $1.46bn in bets being placed by someone in oil and equity markets just 15 minutes before Trump’s announcement?
Was Trump pulling a TACO as he reached his political and economic pain point: Brent at $112/b, US Gas at $4/gal, SPX below 200dma and US 10yr above 4.4%?
Different Iranian factions with Trump talking with one of them? Are there real negotiations going on but with the US talking to one faction in Iran while another, the hardliners, are not involved and are denying any such negotiations going on?
Extending the ultimatum to attack and invade Kharg island next weekend? Or, is the five day delay of the deadline a tactical decision to allow US amphibious assault ships and marines to arrive in the Gulf in the upcoming weekend while US and Israeli continues to degrade Iranian military targets till then. And then next weekend a move by the US/Israel to attack and conquer for example the Kharg island?
We do not really know which it is or maybe a combination of these.
We did get some kind of TACO ydy. But markets have been waiting for some kind of TACO to happen and yesterday we got some kind of TACO. And Brent crude is now trading at $101.5/b as a result rather than at $112-114/b as it did no the high yesterday.
But what really matters in our view is the political situation on the ground in Iran. Will hardliners continue to hold power or will a more pragmatic faction gain power?
If the hardliners remain in power then oil pain should extend all the way to US midterm elections. The hardliners were apparently still in charge as of last week. Iran immediately retaliated and damaged LNG infrastructure in Qatar after Israel hit Iranian South Pars. The SoH was still closed and all messages coming out of Iran indicated defiance. Hardliners continues in power has a huge consequence for oil prices going forward. The regime has played its ’oil-weapon’ (closing or chocking the Strait of Hormuz). It is using it to achieve political goals. Deterrence: it needs to be so politically and economically expensive to attack Iran that it won’t happen again in the future. Or at least that the US/Israel thinks 10-times over before they attack again. The highest Brent crude oil closing price since the start of the war is $112.19/b last Friday. In comparison the 20-year inflation adjusted Brent price is $103/b. So Brent crude last Friday at $112.19/b isn’t a shockingly high price. And it is still far below the nominal high of $148/b from 2008 which is $220/b if inflation adjusted. So once in a lifetime Iran activates its most powerful weapon. The oil weapon. It needs to show the power of this weapon and it needs to reap political gains. Getting Brent to $112/b and intraday high of $119.5/b (9 March) isn’t a display of the power of that weapon. And it is not a deterrence against future attacks.
So if the hardliners remain in power in Iran, then the SoH will likely remain chocked all the way to US midterm elections and Brent crude will at a minimum go above the historical nominal high of $148/b from 2008.
Thus the outlook for the oil price for the rest of the year doesn’t depend all that much of whether Trump pulls a TACO or not. Stops bombing or not. It depends more on who is in charge in Iran. If it is the hardliners, then deterrence against future attacks via chocking of the SoH and high oil prices is the likely line of action. It is impacting the world but the Iranian ’oil-weapon’ is directed towards the US president and the the US midterm elections.
If a pragmatic faction gets to power in Iran, then a very prosperous future is possible. However, if power is shifting towards a more pragmatic faction in Iran then a completely different direction could evolve. Such a faction could possibly be open for cooperation with the US and the GCC and possibly put its issues versus Israel aside. Then the prosperity we have seen evolving in Dubai could be a possible future also for Iran.
So far it looks like the hardliners are fully in charge. As far as we can see, the hardliners are still fully in control in Iran. That points towards continued chocking of the SoH and oil prices ticking higher as global inventories (the oil market buffers) are drawn lower. And not just for a few more weeks, but possibly all the way to the US midterm elections.
A brief sigh of relief yesterday as oil infra at Kharg wasn’t damaged. But higher today. Brent crude dabbled around a bit yesterday in relief that oil infrastructure at Iran’s Kharg island wasn’t damaged. It traded briefly below the 100-line and in a range of $99.54 – 106.5/b. Its close was near the low at $100.21/b.
No easy victorious way out for Trump. So no end in sight yet. Brent is up 3.2% today to $103.4/b with no signs that the war will end anytime soon. Trump has no easy way to declare victory and mission accomplished as long as Iran is in full control of the Strait of Hormuz while also holding some 440 kg of uranium enriched to 60% and not far from weapons grade at 90%. As long as these two factors are unresolved it is difficult for Trump to pull out of the Middle East. Naturally he gets increasingly frustrated over the situation as the oil price and US retail gas prices keeps ticking higher while the US is tied into the mess in the Middle East. Trying to drag NATO members into his mess but not much luck there.
When commodity prices spike they spike 2x, 3x, 4x or 5x. Supply and demand for commodities are notoriously inflexible. When either of them shifts sharply, the the price can easily go to zero (April 2022) or multiply 2x, 3x, or even 5x of normal. Examples in case cobalt in 2025 where Kongo restricted supply and the price doubled. Global LNG in 2022 where the price went 5x normal for the full year average. Demand for tungsten in ammunition is up strongly along with full war in the middle east. And its price? Up 537%.
Why hasn’t the Brent crude oil price gone 2x, 3x, 4x or 5x versus its normal of $68/b given close to full stop in the flow of oil of the Strait of Hormuz? We are after all talking about close to 20% of global supply being disrupted. The reason is the buffers. It is fairly easy to store oil. Commercial operators only hold stocks for logistical variations. It is a lot of oil in commercial stocks, but that is predominantly because the whole oil system is so huge. In addition we have Strategic Petroleum Reserves (SPRs) of close to 2500 mb of crude and 1000 mb of oil products. The IEA last week decided to release 400 mb from global SPR. Equal to 20 days of full closure of the Strait of Hormuz. Thus oil in commercial stocks on land, commercial oil in transit at sea and release of oil from SPRs is currently buffering the situation.
But we are running the buffers down day by day. As a result we see gradually increasing stress here and there in the global oil market. Asia is feeling the pinch the most. It has very low self sufficiency of oil and most of the exports from the Gulf normally head to Asia. Availability of propane and butane many places in India (LPG) has dried up very quickly. Local prices have tripled as a result. Local availability of crude, bunker oil, fuel oil, jet fuel, naphtha and other oil products is quickly running down to critical levels many places in Asia with prices shooting up. Oman crude oil is marked at $153/b. Jet fuel in Singapore is marked at $191/b.
Oil at sea originating from Strait of Hormuz from before 28 Feb is rapidly emptied. Oil at sea is a large pool of commercial oil. An inventory of oil in constant move. If we assume that the average journey from the Persian Gulf to its destinations has a volume weighted average of 13.5 days then the amount of oil at sea originating from the Persian Gulf when the the US/Israel attacked on 28 Feb was 13.5 days * 20 mb/d = 269 mb. Since the strait closed, this oil has increasingly been delivered at its destinations. Those closest to the Strait, like Pakistan, felt the emptying of this supply chain the fastest. Propane prices shooting to 3x normal there already last week and restaurants serving cold food this week is a result of that. Some 50-60% of Asia’s imports of Naphtha normally originates from the Persian Gulf. So naphtha is a natural pain point for Asia. The Gulf also a large and important exporter of Jet fuel. That shut in has lifted jet prices above $200/b.
To simplify our calculations we assume that no oil has left the Strait since that date and that there is no increase in Saudi exports from Yanbu. Then the draining of this inventory at sea originated from the Persian Gulf will essentially look like this:
The supply chain of oil at sea originating from the Strait of Hormuz is soon empty. Except for oil allowed through the Strait of Hormuz by Iran and increased exports from Yanbu in the Red Sea. Not included here.

Oil at sea is falling fast as oil is delivered without any new refill in the Persian Gulf. Waivers for Russian crude is also shifting Russian crude to consumers. Brent crude will likely start to feel the pinch much more forcefully when oil at sea is drawn down another 200 mb to around 1000 mb. That is not much more than 10 days from here.

Oil and oil products are starting to become very pricy many places. Brent crude has still been shielded from spiking like the others.


Market Still Betting on Timely Resolution, But Each Day Raises Shortage Risk

Christian Kopfer om läget för oljan

Marknaden måste börja betrakta de höga kopparpriserna som det nya normala

Det fysiska spotpriset på brentolja har slagit nytt rekord

40 minuter med Javier Blas om hur världen verkligen påverkas av energikrisen
40 minuter med Javier Blas om hur världen verkligen påverkas av energikrisen

Elpriserna fördubblas, stor osäkerhet inför sommaren

MP Materials, USA:s svar på Kinas dominans över sällsynta jordartsmetaller
Det fysiska spotpriset på brentolja har slagit nytt rekord

Studsvik har idag ansökt om att få bygga 1200-1600 MW kärnkraft i Valdemarsvik
-
 Nyheter3 veckor sedan
40 minuter med Javier Blas om hur världen verkligen påverkas av energikrisen
-
 Nyheter4 veckor sedan
Elpriserna fördubblas, stor osäkerhet inför sommaren
-
 Nyheter4 veckor sedan
MP Materials, USA:s svar på Kinas dominans över sällsynta jordartsmetaller
-
 Nyheter3 veckor sedan
Det fysiska spotpriset på brentolja har slagit nytt rekord
-
 Nyheter4 veckor sedan
Studsvik har idag ansökt om att få bygga 1200-1600 MW kärnkraft i Valdemarsvik
-
 Nyheter2 veckor sedan
Marknaden måste börja betrakta de höga kopparpriserna som det nya normala
-
Analys4 veckor sedan
TACO (or Whatever It Was) Sends Oil Lower — Iran Keeps Choking Hormuz
-

 Nyheter4 veckor sedan
Matproduktion är beroende av gödsel, Gulfkriget skapar brist