

Analys
Market at unease over high Brent specs and OPEC+ 2018 decision but Brent backwardation should attract yet more long Brent specs

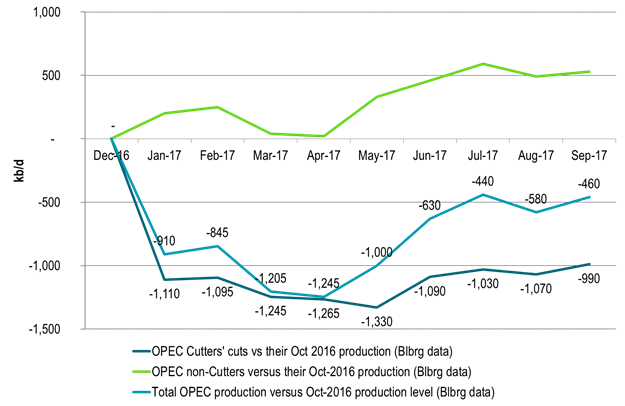
 OPEC compliance is back in focus as compliance fell in September to 990 kb/d of cust versus a pledge of 1200 kb/d for the cutters. OPEC’s meeting on November 30th in Vienna thus coming into focus. Market is concernd for oil market balance in 2018 and is starting to feel at unease over whether OPEC+ will cut all through 2018 or not. We think they need to but we also think they will.
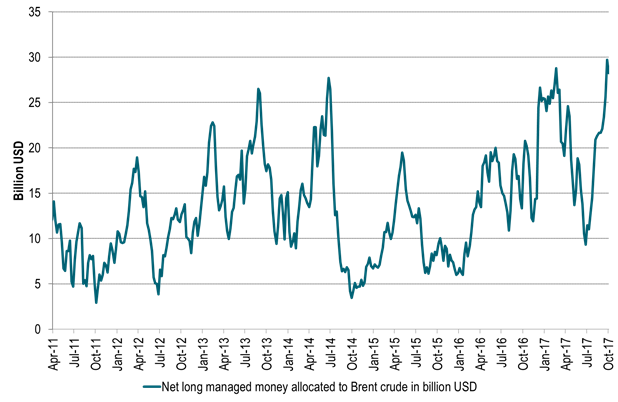
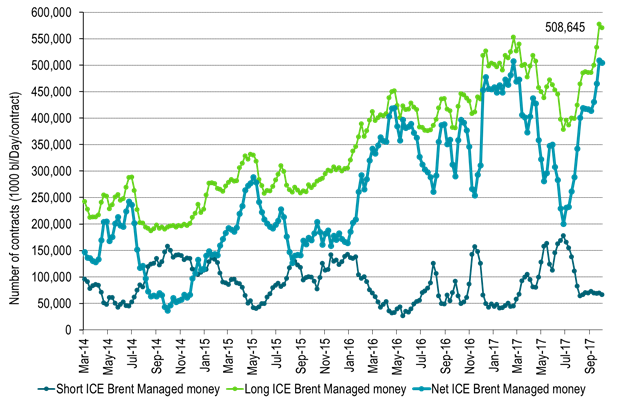
Brent net long managed money reached a record high level the week before last. It fell back only marginally last week. Brent crude is thus at risk to the downside if speculators/investors decides to take yet more money off the table. Thus correction since Brent 1mth reached a new ytd high the week before last may not be over. The general backdrop for Brent does however continue to be positive. The global financial and economic backdrop is positive. Oil inventories continues to decline on the back of strong oil demand growth and cuts by OPEC+ with the result that Brent backwardation should continue to strengthen. Thus even if we see a correction in Brent now driven by speculative money we should see more money heading for Brent long specs going forward. Not less.
From Friday to Friday the Brent Dec-17 contract lost 2.9% closing the week at $55.62/b. The longer dated contract Brent Dec-2020 lost 1.7% with a close of $54.06/b.
Last week’s sell-off was clearly a continuation of the sell-off that kicked in when Brent crude front month reached a new year to date high the week before last when it printed $59.49/b.
To us the sell-off seems technically driven as a counter reaction to Brent crude front month reaching a new year to date high. Net long Brent speculative positions reached its highest historical level in the week before last (records back to 2011) while it fell back marginally last week. With such high levels it does not take much for a correction to take place.
The general back-drop last week was positive with global equities gaining 1%, industrial metals gaining 2.4% while natural gas and coal gaining 3.8% (ARA coal Dec-18) and 1% (EU gas Q4-18).
On oil specifics we saw US crude, distillates and gasoline stocks declining 7 mb while global floating storage of crude and products fell 16 mb. In sum there were a lot of supportive winds last week but Brent crude countered it with a continued to sell off as record high specs took money off the table in a technical reaction to the high print of the year in the week before last.
This morning Brent crude has been trading in positive and negative territory but clos to unchanged and undecided.
In focus this morning is OPEC compliance for September which fell back slightly from August. The members with pledges delivered a cut of 990 kb/d of in September versus pledges of 1.2 mb/d. The OPEC producers with no obligations to cut have increased production by 530 kb/d (versus their October production). In effect OPEC’s total cuts versus its 2017 October level only amounted to 460 kb/d in September.
This is negative since it not a lot. It is positive since inventories are falling rapidly despite the fact that OPEC in total is not cutting a lot. However, the 990 kb/d held back by the cutters in OPEC in September will move back into the market at some point in time in the future again.
Some concern now is that OPEC’s exports will rise since the peak domestic oil demand in OPEC is behind us. In addition refineries will move off-line for autumn maintenance also reducing off-take for crude. OPEC’s upcoming meeting on Nov 30th is putting the spot light back on the 2018 balance. Will they or won’t they roll cuts beyond 1Q18? In our view it is needed and that view is shared by many. Our view is also that they will roll cuts forward since the magnitude of needed cuts is manageable. However the issue creates unease in the market as we run towards the Nov 30th meeting and proper decision by OPEC (+ Russia etc) some time in 1Q18.
Have we now come to the end of the correction we have seen the last two weeks? Brent speculative positions are still close to record high with room to pull more money off the table. However, the backdrop is still fairly positive as inventories continue to draw down which should be supportive for further strengthening of the backwardation of the Brent crude forward curve which is attractive for long positions.
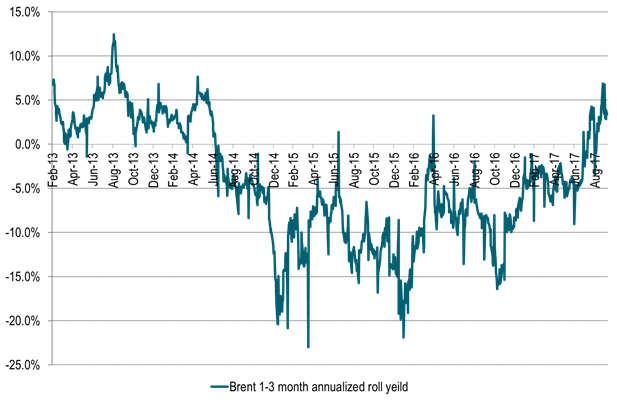
In our view the Backwardation of the Brent crude forward curve is likely to continue to attract yet more money into additional net long speculative positions. This is because the backwardation hands investors/speculators a positive roll yield even if the Brent front month only trades sideways. And as we see in the rest of financial markets there is lots of money chasing yield in a low yield world. Over the past 20 trading days the Brent backwardation measured on the back of the 1-3 mth Brent time spread has averaged an annualized positive roll yield of +3.9%.
Thus despite the fact that net long Brent spec is close to record high we should see more passive money being allocated to Brent long positions. As long as inventories continue to draw down as they currently do with further strengthening of the Brent backwardation. As long as alternative yields around the world is very low as they are. As long as the general global growth outlook looks positive as it does with strong oil demand growth. Yes then we should see more long specs heading to Brent.
The current sell-off may thus not be too deep. The general backdrop is positive. Inventories are declining. Brent backwardation is likely to strengthen further and yet more passive money is likely going to head the Brent long positions.
Ch1: Brent 1-3 mth annualized roll-yield in the positive – Attracting long specs
Passive money likely to continue to roll into long front end Brent positions with a positive roll yield
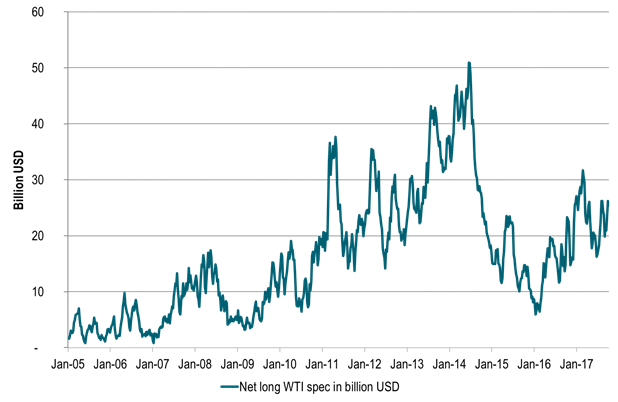
Ch2: WTI oil in dollar allocation still well below prior highs
But the WTI curve is in contango so no rush to enter additional longs there
Ch3: Brent net long allocation recently reached record high of close to USD 30 billion
Thus plenty of room for a pull-back as we have seen the last two weeks
But Brent backwardation is likely to lure yet more passive long allocations to Brent front end contracts
Ch4: Brent net long managed money allocations at uncomfortable high levels
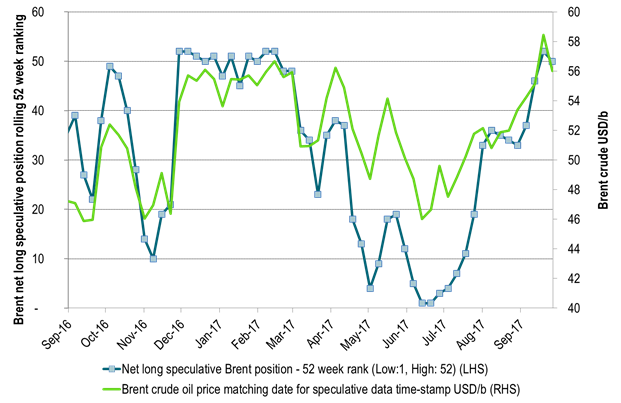
Ch5: Brent net long managed money allocations at uncomfortable high levels
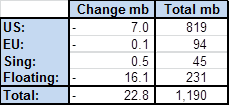
Ch6: OPEC cutters delivered close to promissed cuts even though they inched slightly higher in Sep
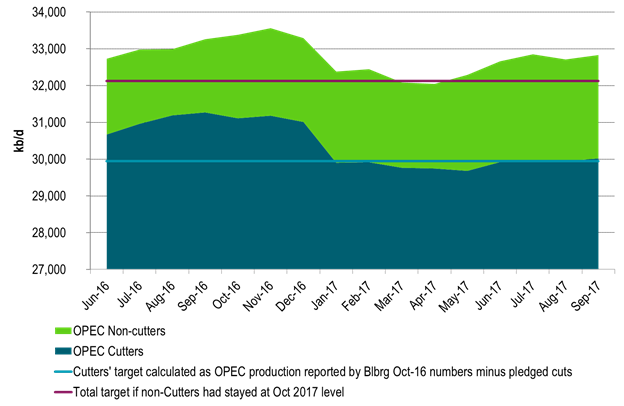
Ch7: OPEC cutters and no-cutters. Net cuts of only 460 kb/d. But cutters deliver close to target
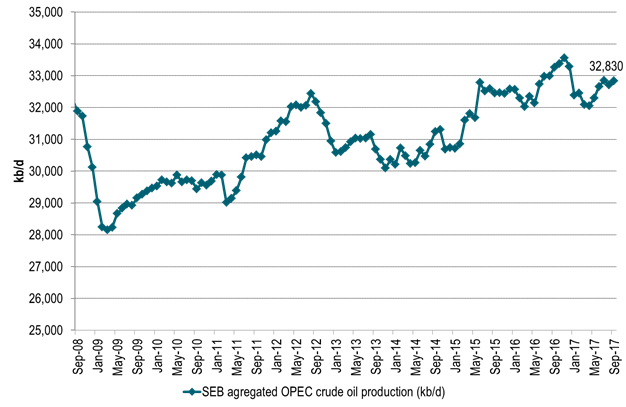
Ch8: OPEC total production. Not cutting all that much. Ytd YoY OPEC’s production is down only 115 kb/d
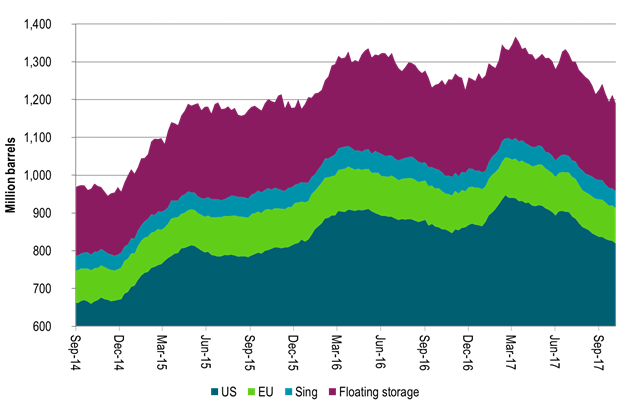
Ch9: Inventories continue to fall in weekly data
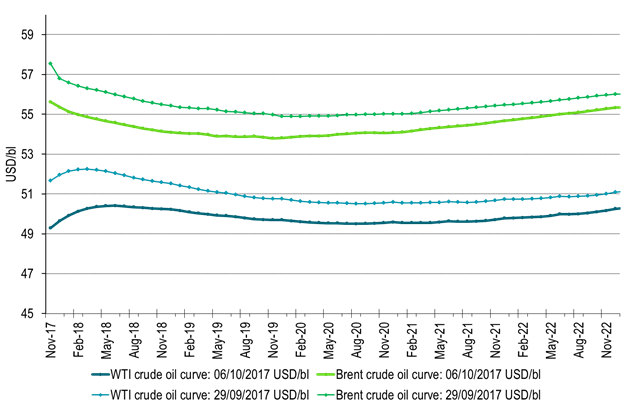
Ch10: Crude forward curves. Sell-off along the curve but Brent still in backwardation
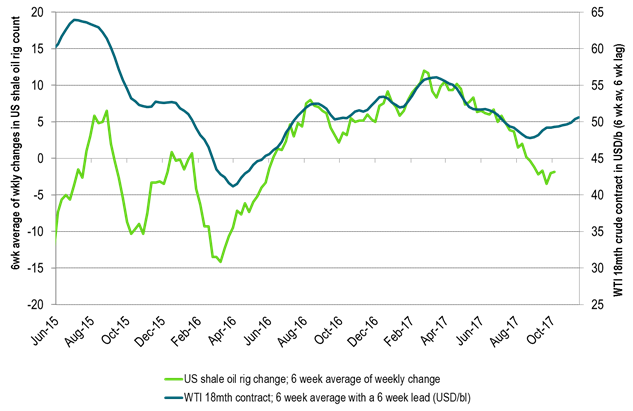
Ch11: US oil rig count down by 2 last week
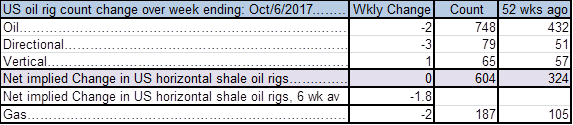
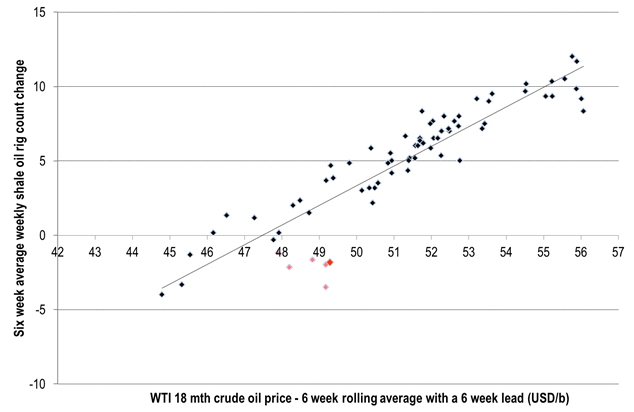
Ch12: US shale oil rigs count change. Price – rig relationship not what it used to be
Kind regards
Bjarne Schieldrop
Chief analyst, Commodities
SEB Markets
Merchant Banking
Market is starting to take US/Iran headlines with a pinch of salt. Brent crude rose $2.8/b yesterday to an official close of $112.1/b. But after that it traded as low as $108.05/b before ending late night at around $109.7/b. Through the day it traded in a range of $106.87 – 112.72/b amid a flurry of news or rumors from Iran and the US. ”US temporary sanctions during negotiations” (falls alarm). ”We will bomb Iran” (not anyhow),… etc. While the market is still fluctuating to this kind of news flow, it is starting to take such headlines with a pinch of salt.

We’ll see. Maybe, maybe not. The Brent M1 contract is trading at $110.2/b this morning which very close to the average ticks through yesterday of $110.4/b.
Trump with bearish, verbal intervention whenever Brent trades above $110/b it seems. What seems to be a pattern is that Trump states something like ”very good negotiations going on with Iran”, ”New leaders in Iran are great,..”, ”Great progress in negotiations,…”, ”Deal in sight,..” etc whenever the Brent M1 contract trades above $110/b. An effort to cool the market. These hot air verbal interventions from Trump used to have a heavy bearish impact on prices, but they now seems to have less and less effect unless they are backed by reality.
As far as we can see there has been no real progress in the negotiations between the US and Iran with both sides still standing by their previous demands.
Iran is getting stronger while the cease fire lasts making a return to war for Trump yet harder. Iran is naturally in constant preparation for a return to war given Trump’s steady threats of bombing Iran again. Iran is naturally doing what ever is possible to prepare for a return to war. And every day the cease fire lasts it is better prepared. This naturally makes it more and more difficult and dangerous for the US to return to warring activity versus Iran as the consequences for energy infrastructure in the Persian Gulf will be more and more severe the longer the cease fire lasts. Israel seems to see it this way as well. That the war is not won and that current frozen state of a cease fire gives Iran opportunity to rebuild military and politically.
Global inventories are drawing down day by day. How much? In the meantime the Strait of Hormuz stays closed. There is varying measures and estimates of how much global inventories are drawing down. Our rough estimate, back of the envelope, is that global inventories are drawing down by at least some 10 mb/d or about 300 mb/d in a balance between loss of supply versus demand destruction. Other estimates we see are a monthly draw of 250-270 mb/d. The IEA only ’measured’ a draw in global observable stocks of 117 mb in April with oil on water rising 53 mb while on shore stocks fell 170 mb. But global stocks are hard to measure with large invisible, unmeasured stocks. As such a back of the envelope approach may be better.
Oil products is what the world is consuming. Oil product prices likely to rise while product stocks fall. Strategic Petroleum Reserves (SPR) are predominantly crude oil. Discharging oil from OECD SPR stocks, a sharp reduction in Chinese crude imports and a reduction in global refinery throughput of 6-7 mb/d has helped to keep crude oil markets satisfactorily supplied. But global inventories are drawing down none the less. And oil products is really what the world is consuming. So if global refinery throughput stays subdued, then demand will eventually have to match the supply of oil products. The likely path forward this summer is a steady draw down in jet fuel, diesel and gasoline. Higher prices for these. Then, if possible, higher refinery throughput and higher usage of crude in response to very profitable refinery margins. And lastly sharper draw in crude stocks and higher prices for these. But some 6 mb/d of oil products used to be exported through the Strait of Hormuz. And it may not be so easy to ramp up refinery activity across the world to compensate. Especially as Ukraine continues to damage Russian refineries as well as Russian crude production and export facilities.
Watch oil product stocks and prices as well as Brent calendar 2027. What to watch for this summer is thus oil product inventories falling and oil product premiums to crude rising. Another measure to watch is the Brent crude 2027 contract as it rises steadily day by day as the Strait of Hormuz stays closed and global oil inventories decline. The latter is close to the highest level since the start of the war and keeps rising.
The Brent M1 contract and the Brent 2027 prices and current price of jet fuel in Europe (ARA). All in USD/b

Our back of the envelope calculation of the global shortage created by the closure of the Strait of Hormuz. Note that 3.5 mb/d of discharge from SPR is also a draw. Note also that ’Forced demand loss’ of 2.5 mb/d is probably temporary and will fall back towards zero as logistics are sorted out leaving ’Price demand loss’ to do the job of balancing the market. Thus a shortfall of at least 9 mb/d created by the closure. More if SPR discharge is included and more if Forced demand loss recedes.

Brent is climbing higher. Front-month is at USD 106.3/bl this morning, close to a weekly high and a USD 9/bl jump from Mondays open. This is the move we flagged as a risk earlier in the week: the market shifting from ”a deal is around the corner” to ”this is going to take longer than we thought”.

Analyst Commodities, SEB
During April, rest-of-year Brent remained remarkably stable around USD 90/bl. A stability which rested on one single assumption: the SoH reopens around 1 May. That assumption is now slowly falling apart.
As we highlighted yesterday: every week of delay beyond 1 May adds (theoretically) ish USD 5/bl to the rest-of-year average, as global inventories draw 100 million barrels per week. i.e., a mid-May reopening implies rest-of-year Brent closer to USD 100/bl, and anything pushing into June or July takes us meaningfully higher.
What’s changed in the last 48 hours:
#1: The US military has formally warned that clearing suspected sea mines from SoH could take up to six months. That is a completely different timescale from what the financial market is pricing. Even a political deal tomorrow does not immediately reopen the strait.
#2: Trump has shifted his tone from urgency to ”strategic patience”. In yesterday’s press conference: ”Don’t rush me… I want a great deal.” The market is reading this as a president no longer feeling pressured by timelines, with the naval blockade running in the background.
#3: So far, the military activity is escalating, not de-escalating. Axios reports Iran is laying more mines in SoH. The US 3rd carrier strike group (USS George H.W. Bush) is arriving with two countermine vessels. Trump yesterday ordered the US Navy to destroy any Iranian boats caught laying mines. While CNN reports that the Pentagon is actively drawing up plans to strike Iranian SoH capabilities and individual Iranian military leaders if the ceasefire collapses. i.e., NOT a attitude consistent with an imminent deal!
Spot crude and product prices eased off the early-April highs on a combination of system rerouting and deal optimism. Both now weakening. Goldman estimates April Gulf output is reduced by 14.5 mbl/d, or 57% of pre-war supply, a number that keeps getting worse the longer this drags on.
Demand-side adaptation is ongoing: S. Korea has cut its Middle East crude dependence from 69% to 56% by pulling more from the Americas and Africa, and Japan is kicking off a second round of SPR releases from 1 May. But SPRs are finite.
Ref. to the negotiations, we should not bet on speed. The current Iranian leadership is dominated by genuine hardliners willing to absorb economic pain and run the clock to extract concessions. That is not a setup for a rapid resolution. US/Israeli media briefings keep framing the delay as ”internal Iranian divisions”, the reality is more complicated and points toward weeks and months, not days.
Our point is that the complexity is large, and higher prices have only just started (given a scenario where the negotiations drag out in time). The market spent April leaning on the USD 90/bl rest-of-year assumption; that case is diminishing by the hour. If ”early May reopening” is replaced by ”June, July or later” over the next week or two, both crude and products have meaningful room to reprice higher from here. There is a high risk being short energy and betting on any immediate political resolution(!).
Down on Friday. Up on Monday. The Brent June crude oil contract traded down 5.1% last week to a close of $90.38/b. It reached a high of $103.87/b last Monday and a low of $86.09/b on Friday as Iran announced that the Strait of Hormuz was fully open for transit. That quickly changed over the weekend as the US upheld its blockade of Iranian oil exports while Iran naturally responded by closing the SoH again. The US blew a hole in the engine room of the Iranian ship TOUSKA and took custody of the ship on Sunday. Brent crude is up 5.6% this morning to $95.4/b.
The cease-fire is expiring tomorrow. The US has said it will send a delegation for a second round of negotiations in Islamabad in Pakistan. But Iran has for now rejected a second round of talks as it views US demands as unrealistic and excessive while the US is also blocking the Strait of Hormuz.
While Brent is up 5% this morning, the financial market is still very optimistic that progress will be made. That talks will continue and that the SoH will fully open by the start of May which is consistent with a rest-of-year average Brent crude oil price of around $90/b with the market now trading that balance at around $88/b.
Financial optimism vs. physical deterioration. We have a divergence where the financial market is trading negotiations, improvements and resolution while at the same time the physical market is deteriorating day by day. Physical oil flows remain constrained by disrupted flows, longer voyage times and elevated freight and insurance costs.
Financial markets are betting that a US/Iranian resolution will save us in time from violent shortages down the road. But every day that the SoH remains closed is bringing us closer to a potentially very painful point of shortages and much higher prices.
The US blockade is also a weapon of leverage against its European and Asian allies. When Iran closed the SoH it held the world economy as a hostage against the US. The US blockade of the SoH is of course blocking Iranian oil exports. But it is also an action of disruption directed towards Europe and Asia. The US has called for the rest of the world to engaged in the war with Iran: ”If you want oil from the Persian Gulf, then go and get it”. A risk is that the US plays brinkmanship with the global oil market directed towards its European and Asian allies and maybe even towards China to force them to engage and take part. Maybe unthinkable. But unthinkable has become the norm with Trump in the White House.


Sommarväder skapar prisrally på elbörsen
Oil product price pain is set to rise as the Strait of Hormuz stays closed into summer

Solkraften pressar elpriserna dagtid

Michel Gubel ger sin syn på oljemarknaden