

Analys
SEB – Råvarukommentarer, 17 november 2014

Veckans rekommendationer
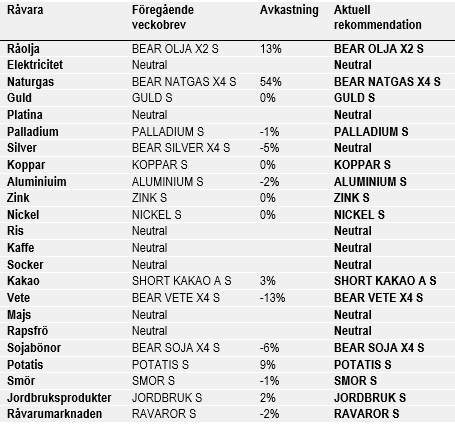
Råolja – Brent
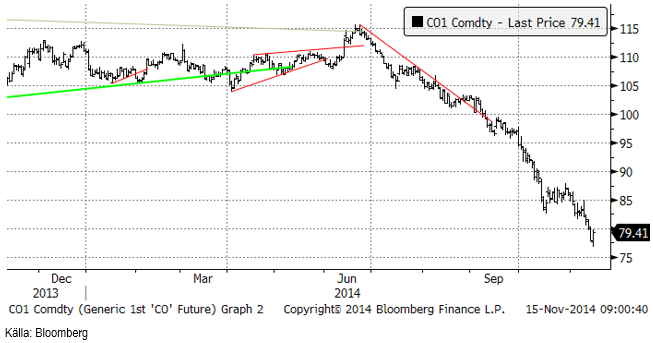
Råoljepriset sjönk återigen och gick för första gången på flera år under 80 dollar per fat. Det skedde en rask återhämtning i fredags.
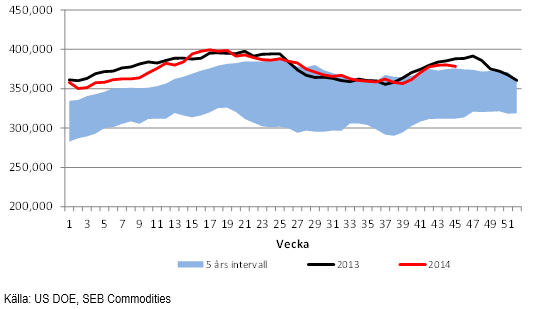
Lagren i USA minskade med 1.8 miljoner fat från förra veckan. Det är ovanligt att se lagerminskningar vid den här tiden på året. Lagret på 378.4 miljoner fat är 10 miljoner fat lägre än vid samma vecka förra året.
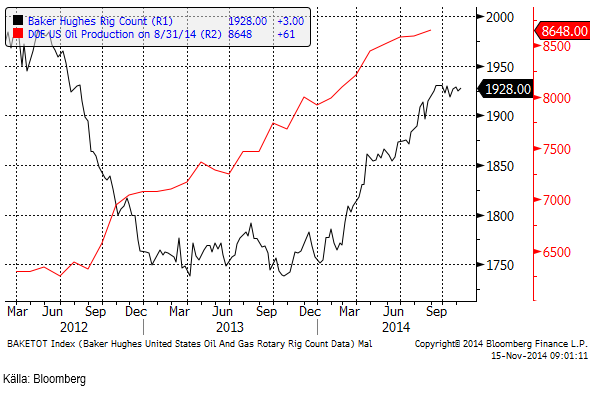
US Energy Information Administration (EIA), rapporterade i sin Short-Term Energy Outlook i onsdags att produktionen av råolja nådde 8.9 mbpd i oktober och väntas överstiga 9 mbpd i december. De sänkte prognosen för helåret 2015 med 0.1 mbpd till en genomsnittlig produktion på 9.4 mbpd. Även det blir den högsta produktionstakten sedan 1972.
International Energy Agency (IEA), som är OPEC:s motsvarighet för de oljekonsumerande länderna, publicerade en rapport i fredags, där de säger att global oljekonsumtion minskar med 1% till 92.6 mbpd under det första kvartalet nästa år. Om det inte blir nya produktionsstörningar kommer detta att pressa priset nedåt, skriver IEA. IEA tror att konsumtionen för helåret 2015 stiger till 93.6 mbpd, från 92.4 i år. Den prognosen är samma som de hade i oktober. Däremot sänktes behovet av olja från OPEC från 29.6 mbpd till 29.2 mbpd. Man skrev vidare att medan ett lägre oljepris kan minska investeringarna i amerikansk skifferolja, så skriver de att detta mer än väl balanseras av ökningen i produktivitet; ”pale in comparison” är uttrycket de använder.
IEA skriver också att globala oljelager ligger över medelvärdet för de senaste fem åren för första gången på ett och ett halvt år. Lagren uppgick till 2.72 miljarder fat i september, och ökade när lagren normalt sett sjunker.
OPEC:s sammanträde i Wien den 27 november rycker allt närmare. Algeriet och Venezuela sade i torsdags att de är redo att försvara oljepriset; förmodligen dock bara om de får sällskap.
Nedan ser vi ett diagram på antalet oljeriggar i USA, enligt Baker Hughes statistik (svart). Antalet riggar i drift ökade med tre från förra veckan till 1928 stycken enligt fredagskvällens statistik.
Vi rekommenderar en kort position, t ex med BEAR OLJA X2 S.
Elektricitet
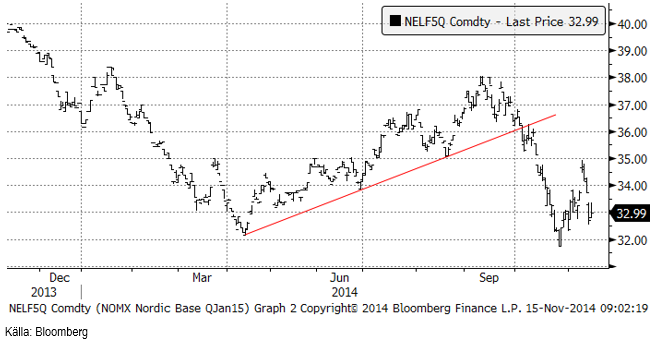
Priset på första kvartalets terminskontrakt på det nordiska elpriset har fallit ganska kraftigt den här veckan och det beror på väderleksprognosen som pekar på 60-70% av normal nederbörd. I prognosen ser vi också milt väder, 2-3 grader över normal temperatur. Fyra-veckors prognosen från SMHI anger att det blir milt väder i fyra veckor till. Den brukar dock ha lite lägre tillförlitlighet, men det påverkar naturligtvis priserna.
Kärnkraften går på 88% av full kapacitet i de nordiska länderna. Det sista blocket kommer tillbaka om några veckor.
CO2 har däremot handlat starkt. Den senaste överenskommelsen mellan Kina och USA om utsläpp kan också tolkas som positiv för priset på utsläppsrätter i EU. Däremot föll priset ganska kraftigt i fredags, från 6.80 euro per ton till 6.62, vilket gjorde att det blev en nedgång på veckan. Det finns också alternativa tolkningar av Kina/USA-överenskommelsen, som inte är så bullish CO2. Den republikanska majoriteten kommer knappast att godkänna Obamas utfästelser och Kina gjorde inga alls, utan sade att de kommer att öka utsläppen av CO2 åtminstone till år 2030.
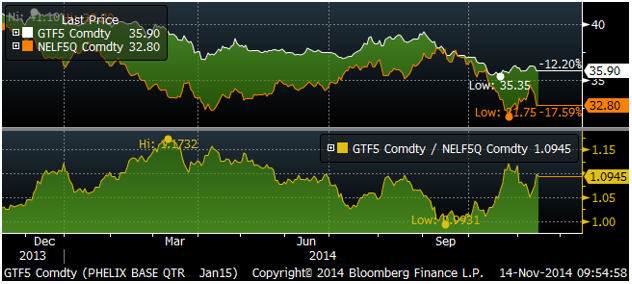
Nedan ser vi kvoten mellan priset på terminen för tysk el under första kvartalet och terminen för nordisk el för samma kvartal. Tysk el har inte fallit i pris på samma sätt under hösten som nordisk el har gjort, utan snarare gått upp något lite. Sedan september har skillnaden minskat från noll till 9.45%.
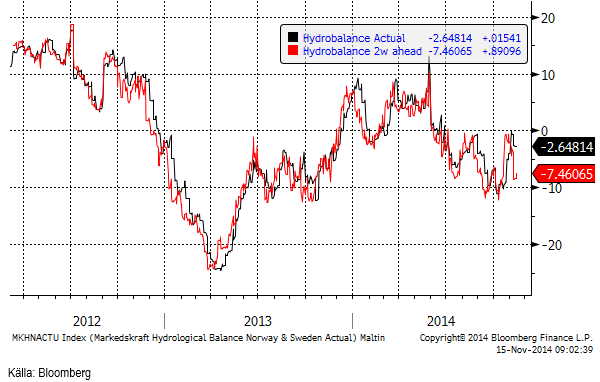
Hydrologisk balans har enligt 2-veckors prognosen fallit tillbaka ytterligare. Förra veckan prognosticerades ett underskott på 4 TWh och nu har underskottet ökat till -7.5 TWh.
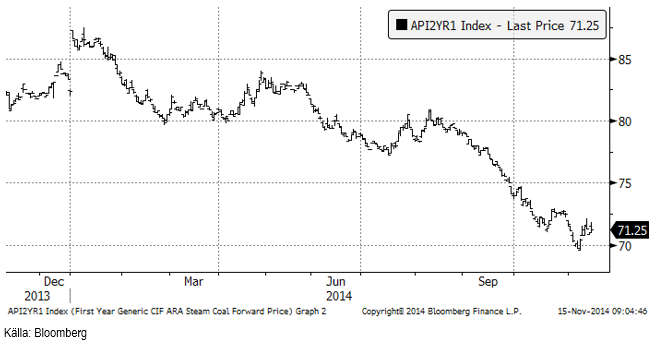
Nedan ser vi terminskontraktet för leverans av kol under 2015, som stigit lite den senaste veckan.
Naturgas
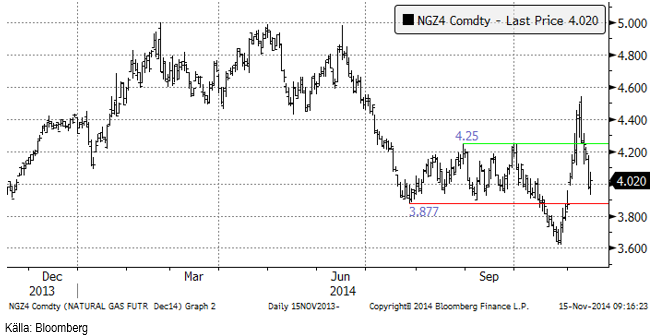
Naturgaspriset (decemberkontraktet) tvärvände ner till 4.20 nivån först och efter EIA:s rapport rasade priset vidare ner mot botten på den tidigare ’tradingrangen’ vid 3.88, där den jämna siffran 4 dollar också fungerar som ett tekniskt stöd.
US Energy Information Administration (EIA), rapporterade i sin Short-Term Energy Outlook i onsdags att lagren av naturgas i USA var 6% lägre än samma tid förra året och 7% under genomsnittet för de senaste fem åren (2009 – 2013). Trots detta anser EIA att Henry Hub-priset kommer att handlas till i genomsnitt 3.97 dollar per MMBtu i vinter, vilket är under såväl förra årets genomsnittspris på 4.53 dollar och lägre än priset förra veckan. Orsaken är att produktionen av naturgas är mycket högre nu än förra året.
Koppar
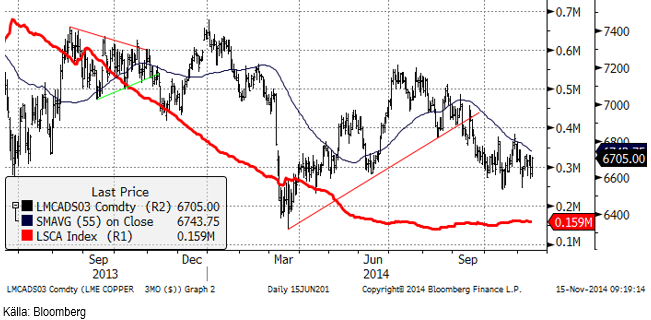
Priset på koppar pendlade med stora svängar inom intervallet 6600 – 6700 dollar förra veckan och stängde nära toppen. Cash till tremånader handlade på 70 dollar i backwardation. Metal Bulletin uppmärksammade att det kan förekomma köp till kinas strategiska reserv (SRB). Lagret i kinesiska lagerhus har enligt de flesta källorna halverats från 1 mt till 0.5 mt efter Qingdao-skandalen. Folk har väntat på att det här materialet skulle dyka upp i LME:s lagerhus, men så har inte skett. En teori är att SRB har tagit hand om materialet. Det skulle kunna vara en rimlig förklaring till varför metallen inte har dykt upp någon annanstans. Tekniskt trendar priset fortfarande nedåt, men det finns tecken på att botten i trenden är nådd. Vi tror att kopparpriset kommer att följa resten av basmetallerna (snarare än att leda uppgången) mot slutet av året.
Koppar är den enda metallen som handlas på en amerikansk terminsbörs och är därför den enda vi får någon information om vad spekulanterna gör. Som vi ser nedan är de fortfarande rätt sålda (-25561 kontrakt) koppar, men köpte 302 kontrakt netto i veckan som gick.
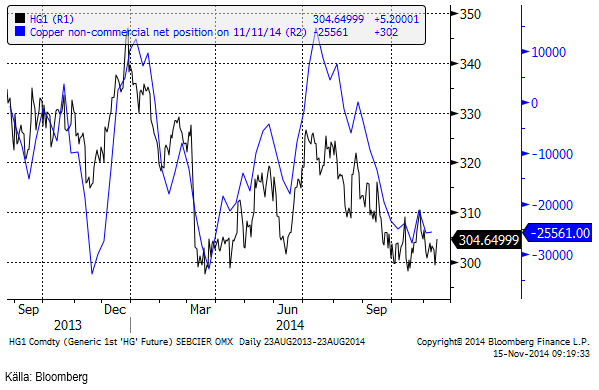
Vi håller fast vid vår rekommendation av KOPPAR S.
Aluminium
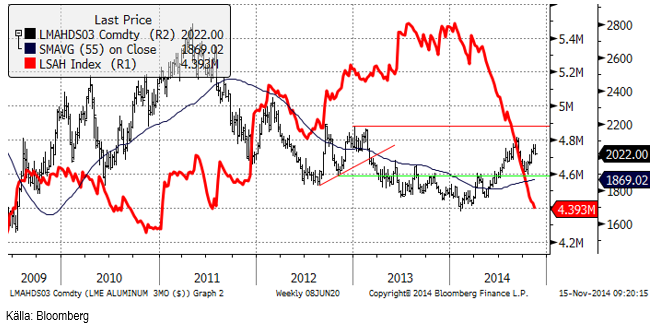
Aluminium skiljer ut sig från de andra i basmetallgruppen. Den senaste tiden har aluminiumpriset utvecklats mest positivt, men i veckan som gick var det den enda metallen som gick ner i pris. Investerarna tar från tid till annan kommandot i marknaden. Marknadskommentarerna i veckan löd ”CTAs köper” och nästa dag ”CTAs tar hem vinster”. Det behöver inte vara sant, förstås. Det är få personer, för att inte säga, ingen, som vet vem som gör alla köp och försäljningar och det kan vara lockande att säga att det var några rika och hemlighetsfulla fonder som orsakade prisrörelserna. Vi tror att aluminium har några månader med stark efterfrågan framför sig. Det stämmer överens med den tekniska bilden också. De längre kontrakten fortsätter att vara under prispress. Skillnaden mellan tremånaders terminspris och femtonmånaders är nu bara 15 dollar i contango, ner från 30-50 dollar tidigare i november. Det kan tyda på att producenter har börjat prissäkra sin produktion.
Vi fortsätter att rekommendera köp av ALUMINIUM S.
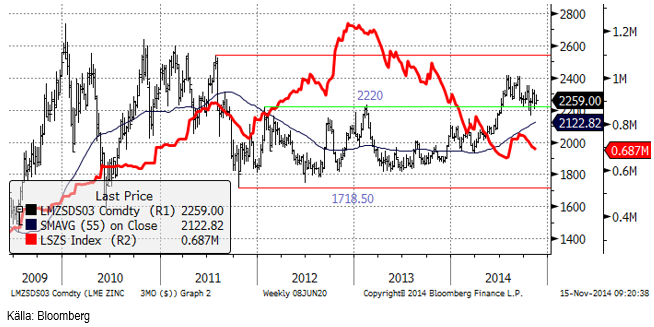
Zink
Kursdiagrammet för zink ser ut på ungefär samma sätt som koppar. Det verkar som om marknaden vill testa den övre gränsen för den fallande pristrenden. Det fundamentala underskottet i marknaden har ännu inte blivit kännbart och investerare som har köpt in sig i metallen, har gått i och ur marknaden och därmed skapat en volatil marknad i svag trend nedåt. Ett orosmoment som diskuteras i marknaden är att 93% av LME-lagret finns i USA. Med så begränsad del i EU och i Asien, kan det lätt bli en brist när underskottet letar sig ner genom systemet. Vi tror att marknaden kommer att stärkas till slutet på året. Däremot tror vi att en större prisuppgång kan ske först någon gång under nästa år.
Vi rekommenderar köp av ZINK S.
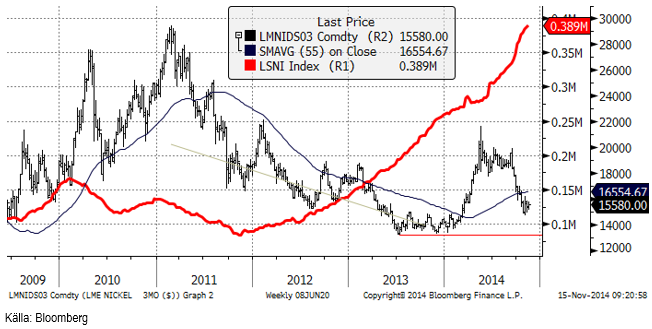
Nickel
LME-lagret steg inte i veckan och prisraset ser ut att bottna ut. Industrins orderingång och PMI-statistiken indikerar att industriproduktionen kan vara på väg att växa och i det läget kan man förvänta sig lageruppbyggnad hos företagen. Kommentarer från tillverkarna av rostfritt stål i veckan, antyder just att kunder fyller på sina lager och drar nytta av det låga nickelpriset. Det här brukar normalt rassla ner genom systemet och bli köp på terminsmarknaden på LME. Håller något avgörande på att ske i marknaden? Det är svårt att svara på, naturligtvis, men i linje med vår uppfattning, skulle det kunna vara dags för priset att byta riktning.
Vi rekommenderar köp av NICKEL S.
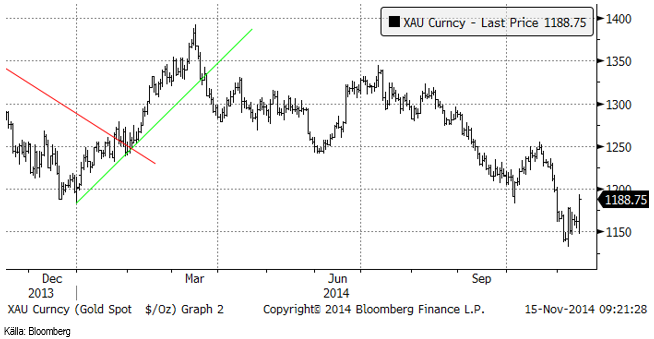
Guld
Guldpriset steg mycket kraftigt i fredags, men är tekniskt begränsat på uppsidan.
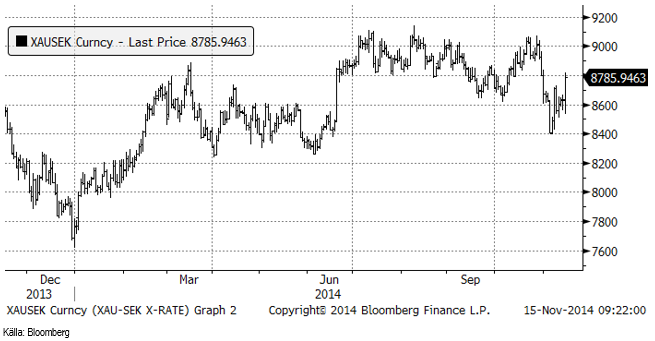
Chartet för guld i kronor steg likaså.
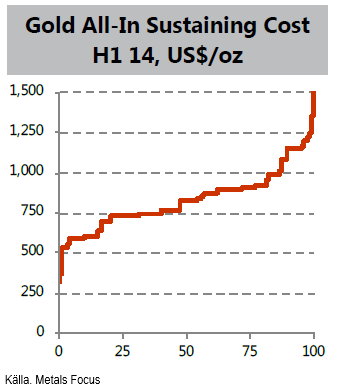
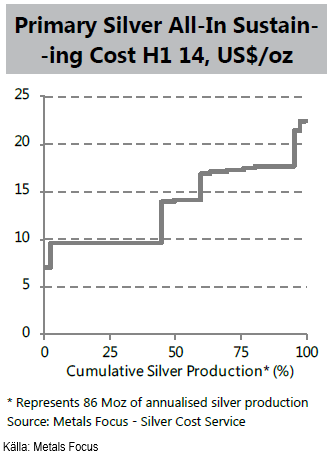
Metals Focus publicerade en kostnadskurva (totala kostnader) för ett större urval guldproducenter. I kurvan, som vi ser nedan, ser vi att vid ett pris på 1200 dollar är det nästan all gruvkapacitet som visar vinst.
World Gold Councils rapport ’Gold Demand Trends Third Quarter 2014’ som publicerades i torsdags visade 23.5 ton lägre efterfrågan totalt sett jämfört med det tredje kvartalet förra året. Den största förändringen är en minskning av smyckesefterfrågan på 22 ton till 534.2 ton för det tredje kvartalet i år.
Centralbanker köpte nästan 9 ton mindre guld det tredje kvartalet i år jämfört med förra året, från 101.5 ton till 92.8 ton i år. Störst köp har Russland gjort, 55 ton, därefter Kazakstan, 28 ton och Azerbaijan, 7 ton, alla medlemmar av CIS. Reuters rapporterade att Rysslands köp beror på att de ryska bankerna som normalt sett förmedlar de ryska gruvbolagens export av metallen, har svårt att göra detta efter ovilja i väst att göra affärer med Ryssland och att det istället säljs till den ryska centralbanken.
Investeringsefterfrågan ökade med 12.4 ton, men inom den kategorin skedde stora förändringar. Efterfrågan på tackor och mynt minskade med 66.7 ton till 245.6 ton. Utflödet från börshandlade värdepapper som representerar guld minskade dock med 78.9 ton från ett utflöde på 120.2 ton under det tredje kvartalet förra året till ett utflöde på 41.3 ton samma kvartal i år.
WGC sade också i rapporten att efterfrågan på guld i alla former sjönk för det tredje kvartalet i rad till 182.7 ton. Det är 37% mindre än samma kvartal förra året.
Som vi skrev förra veckan, verkat det som om efterfrågan på fysisk metall i investeringssyfte i USA och EU har tagit mer fart under början av det fjärde kvartalet, efter att guld blivit ännu lite billigare.
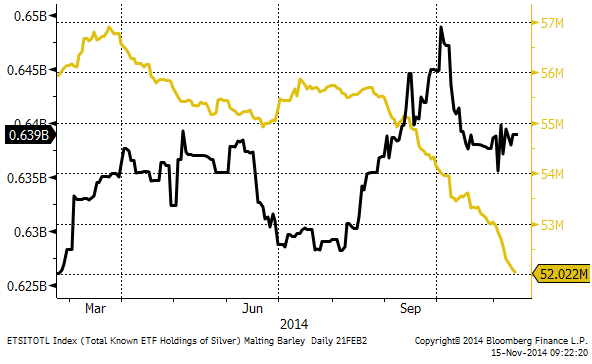
Institutionella investerare har sålt 0.54 miljoner uns i ETF/ETC-er sedan förra veckan. Det är 17.4 ton, vilket är en siffra som man kan jämföra med t ex centralbankernas köp ovan. Flödet i ETF/ETC betyder alltså väldigt mycket.
Vi håller fast vid positionen i GULD S.
Silver
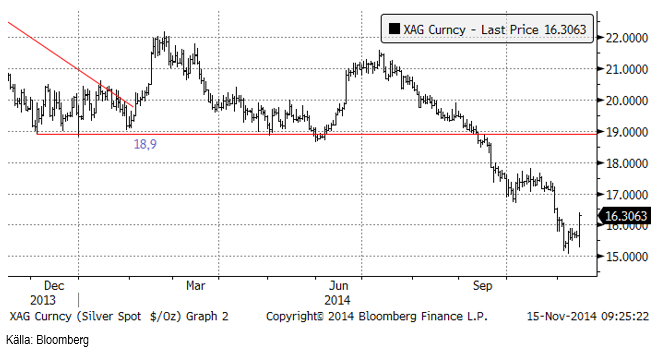
Silverpriset hängde på guldet upp i fredags, men det finns ännu inte någon trendförändring. Trenden är fortfarande nedåtriktad.
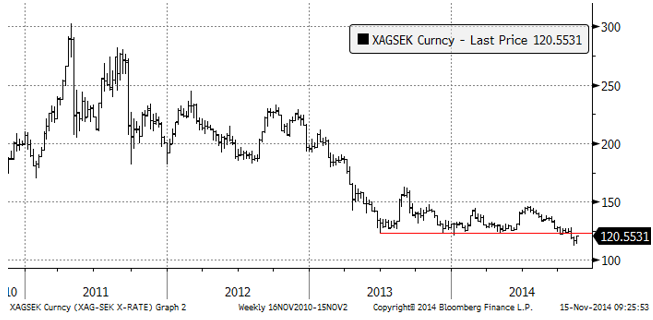
Silverpriset i kronor, nedan visat i ett veckochart, ser fortfarande väldigt negativt ut. Visst kan en rekyl upp mot 125 kronor per uns (31 gram) komma, men en sådan skulle enligt handboken i teknisk analys bara vara ett säljtillfälle.
Metals Focus publicerade även en kostnadskurva för producenter av silver. Notera att vid ett pris på 16 dollar går en stor del av producenterna med förlust.
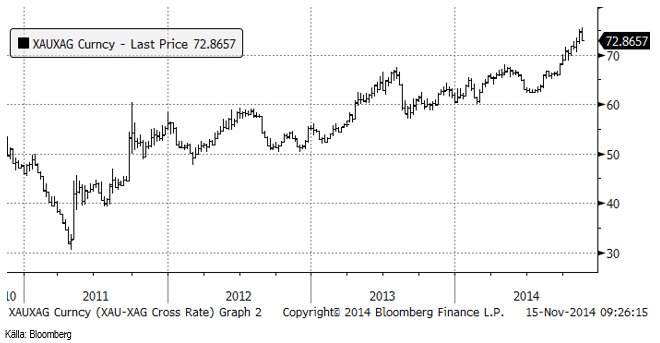
Silver är fortsatt billigt i förhållande till guld och det kan vara en anledning att byta en investering i guld mot silver. Kvoten föll tillbaka förra veckan till samma nivå som den låg på för två veckor sedan.
Vi går över till neutral rekommendation. Det är en svår bedömning. Tekniskt borde silver vara säljvärt nu, men fundamentalt sett är silver köptvärt – dels för att det är billigt i förhållande till guld och dels för att en så stor andel av producenterna går med förlust.
Platina & Palladium
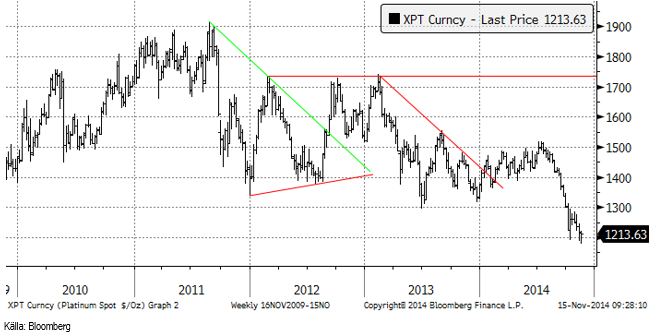
Platina noterade det lägsta priset på fem år i veckan som gick, innan priset hämtade sig.
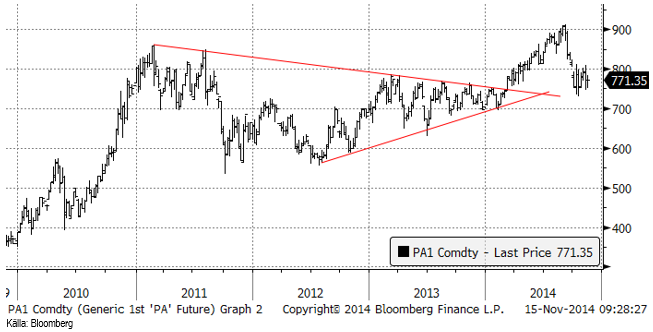
Palladiumpriset är i princip oförändrat från förra veckan och befinner sig fortfarande i konsolidering. Det går dock inte att utesluta ett prisfall ända ner till 600 dollar, även om vårt huvudscenario är att priset vänder uppåt när konsolideringen i prisintervallet 750 till 800 dollar är klar.
Nedanför ser vi hur mycket metall som finns i börshandlade fonder för platina respektive palladium. Investerare har sålt både platina och palladium den senaste veckan.
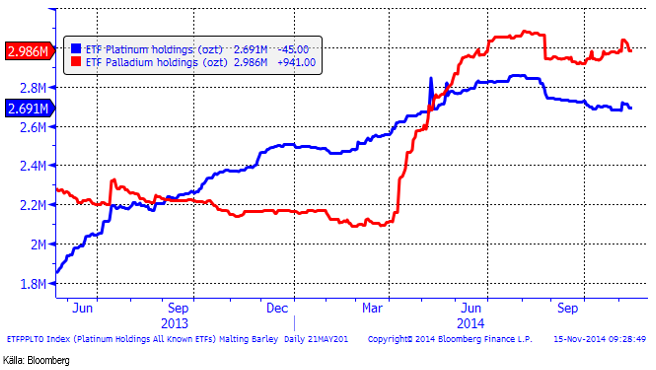
Vi fortsätter med neutral rekommendation på platina, men rekommenderar köp av palladium via t ex PALLADIUM S.
Ris
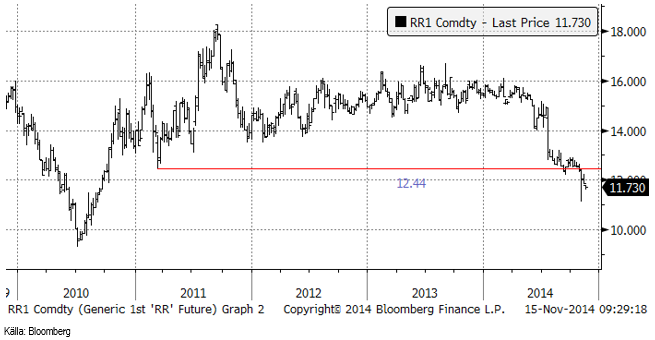
Priset på ris fortsatte att gå ner och stängde på 11.73 dollar per cwt.
WASDE-rapporten var helt neutral. USDA gör ingen förändring alls för de stora producentländerna i världen, men en liten sänkning bland övriga producenter, vilket leder till en marginell minskning av estimatet för global produktion från oktobers rapport till novembers.
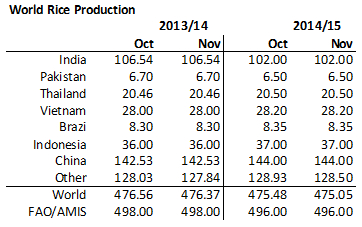
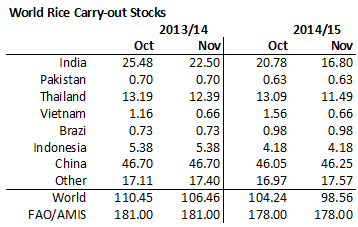
USDA sänker estimatet för utgående lager 2013/14 med 4 mt, (3 mt lägre i Indien och 1 mt lägre i Thailand), vilket leder till 4 mt lägre utgående lager 2014/15. Att vi ser en sänkning av globala utgående lager 2015 från 104.24 mt enligt förra månadens rapport till 98.56 mt i novemberrapporten beror alltså inte på någon justering av produktionen eller konsumtionen för innevarande år.
Kaffe
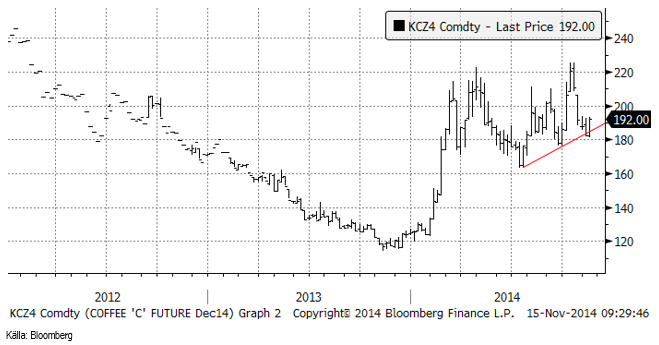
Kaffepriset vände upp från det tekniska stödet vid 180 cent och stängde på 192 cent per pund i decemberkontraktet. Trots att det regnar en hel del i Brasilien, kom några nyhetsrapporter mot slutet av veckan, som huvudsakligen var intervjuer med mäklare i São Paulo, som menade att regnen inte var tillräckliga. Detta räckte uppenbarligen för att få upp priset lite grand. Frågan är hur mycket dessa uttalanden faktiskt korresponderar mot den verkliga situationen.
Som vi sett ovan under odlingsväder är chanserna goda för ett El Niño från Jul och det skulle innebära en period av hög nederbörd. På lite längre sikt är alltså utsikterna rätt ”bearish”.
Det kom också rapporter om robustan i Vietnam har små bönor i år. Det kan också ha bidragit till prisuppgången i veckan.
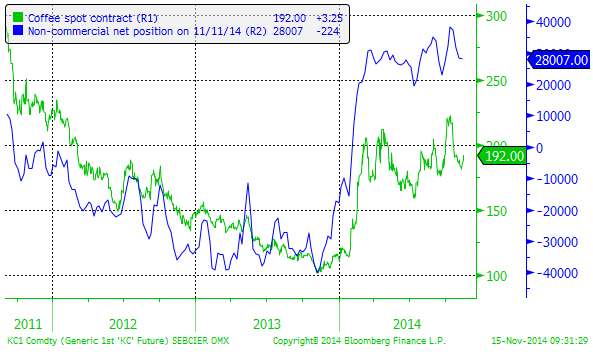
Som vi ser i nedanstående diagram är non-commercials fortfarande nettoköpta över 28,000 kontrakt. Det var nästan ingen förändring alls den senaste veckan.
Kakao
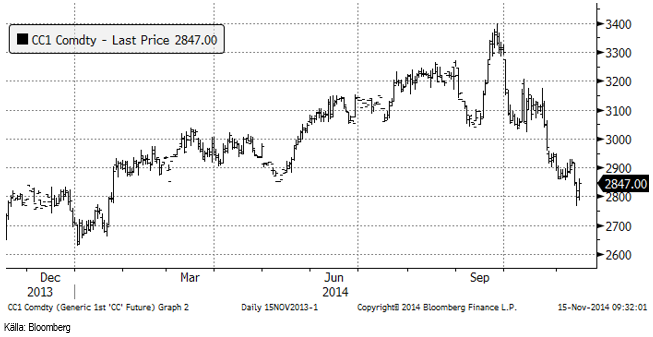
Kakaopriset gick ner från 2900 till 2800 dollar, men rekylerade sedan i fredags och stängde på 2847. Fredagens uppgång behöver inte betyda att nedgången vänder utan det kan handla om vinsthemtagningar inför helgen.
I torsdags släppte Liberia på reserestriktionerna inom landet och det kan ha påverkat marknaden under onsdagen och torsdagen.
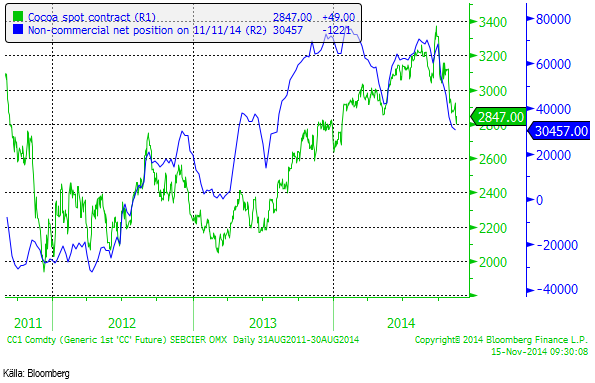
Non-commercials fortsätter sälja av terminer på kakao, förra veckan dock bara 1221 kontrakt.
Vi behåller positionen i SHORT KAKAO A S
För fler analyser på jordbruksråvaror se SEBs andra analysbrev.
[box]SEB Veckobrev Veckans råvarukommentar är producerat av SEB Merchant Banking och publiceras i samarbete och med tillstånd på Råvarumarknaden.se[/box]
Disclaimer
The information in this document has been compiled by SEB Merchant Banking, a division within Skandinaviska Enskilda Banken AB (publ) (“SEB”).
Opinions contained in this report represent the bank’s present opinion only and are subject to change without notice. All information contained in this report has been compiled in good faith from sources believed to be reliable. However, no representation or warranty, expressed or implied, is made with respect to the completeness or accuracy of its contents and the information is not to be relied upon as authoritative. Anyone considering taking actions based upon the content of this document is urged to base his or her investment decisions upon such investigations as he or she deems necessary. This document is being provided as information only, and no specific actions are being solicited as a result of it; to the extent permitted by law, no liability whatsoever is accepted for any direct or consequential loss arising from use of this document or its contents.
About SEB
SEB is a public company incorporated in Stockholm, Sweden, with limited liability. It is a participant at major Nordic and other European Regulated Markets and Multilateral Trading Facilities (as well as some non-European equivalent markets) for trading in financial instruments, such as markets operated by NASDAQ OMX, NYSE Euronext, London Stock Exchange, Deutsche Börse, Swiss Exchanges, Turquoise and Chi-X. SEB is authorized and regulated by Finansinspektionen in Sweden; it is authorized and subject to limited regulation by the Financial Services Authority for the conduct of designated investment business in the UK, and is subject to the provisions of relevant regulators in all other jurisdictions where SEB conducts operations. SEB Merchant Banking. All rights reserved.

Brent M1 moving below the 200 dma of $78.7/b. Brent crude continued its move lower yesterday with a decline of 3.3% to $77.9/b. This morning it is adding another drop of 1.4% to $76.8/b. Israel bombing Lebanon during the weekend was a violence of the MoU and Iran was quick to declare the SoH closed again. But the willingness to move forward by both the US and Iran obviously trumped the bombing in Lebanon making the event more of a hiccup on the road of further negotiations.

The US has now waived sanctions against Iranian oil exports for two months allowing Iran to sell its oil all over the world, though sanctions instated in Europe will take more time to unwind. Oil from Iran, Russia as well as Venezuela can for the time being be sold across the world without any sharp discount due to sanctions. Chinese Tea-pot refineries will suffer as they previously could buy rebated crude while selling products at market prices.
Crude oil is no flowing out of the SoH with latest number close to 7 mb/d on a three day moving average. That is still well below the 14 mb/d of crude and 6 mb/d of products normally flowing out of the SoH. Latest estimate is that there is around 80 mb of crude on water inside the Persian Gulf and maybe another 80 mb of oil products on water as well. If crude is exiting the SoH at a rate of around 7 mb/d, then the 80 mb of crude would be depleted within 10-15 days and there after the flow would rely on new crude tankers entering, loading and then exiting the SoH to continue further flows. Given the uncertainties surrounding the status of the SoH with Iran stating that it was closed again as recent as this weekend, there is likely an asymmetry here where ships and oil stranded in the SoH for months are much more eager to exit than new ships are eager to enter.
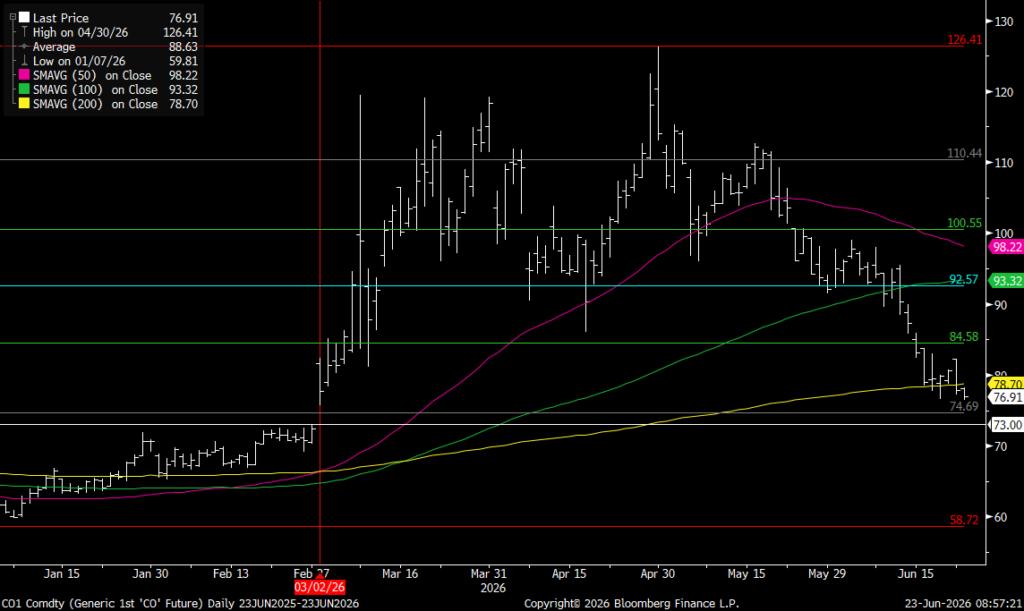
For now Brent crude keeps falling like a rock with the front-end Brent contract now only trading at a premium of $7.6/b above the five year contract. Quickly heading towards parity. The Brent M1 contract has now broken below its 200 dma of $78.7/b and is closing in on the Fibo-level at $74.7/b. Below that there is not much more supporting levels to be found before $73/b which would close the gap from February 3.
Brent crude M1 technical levels
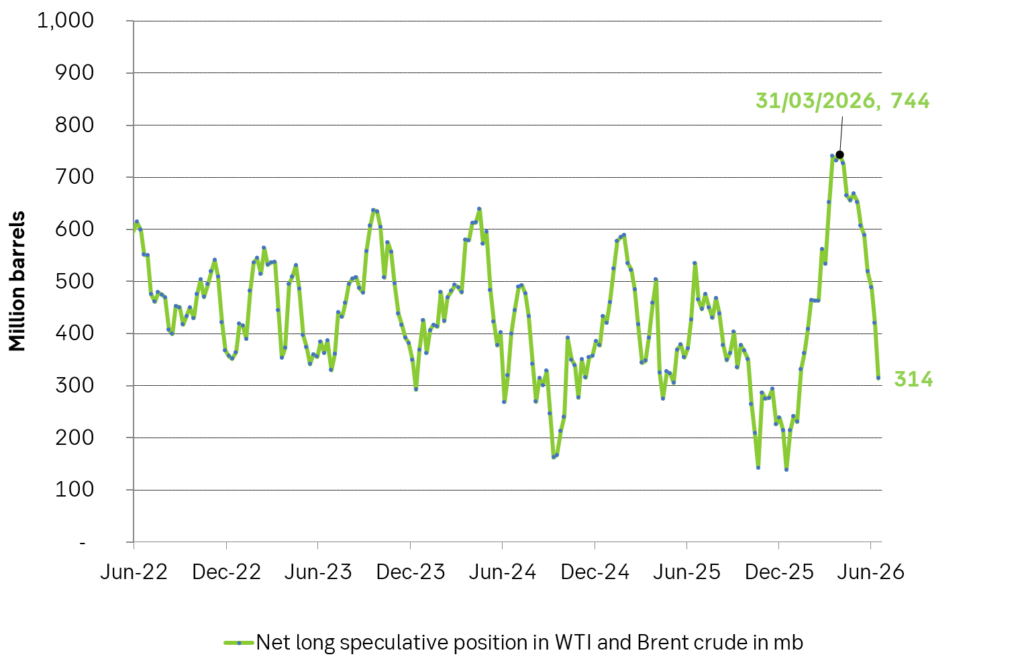
Net long speculative positions are also falling like a rock and as of Tuesday last week the net long positioning in Brent and WTI together summed to 314 million barrels and falling fast.
Will there be a rebound? A possible combination could be an exhaustion of the oil blob caught within the SoH within 1-2 weeks if exits continue at current rate while new ships entering are much more cautious, more Israeli bombardments in Lebanon as Netanyahu fights for re-election, a temporary closure of the SoH again while speculative short positions take cover buying back and covering their positions.
US and Israeli stands versus Iran could harden beyond elections so 2027 surplus is far from given. But Iran and the US are all in all moving towards a set of solutions with both clearly eager to reopen the SoH and keep it open. And that is what the market is pricing along with sharply falling prices. The ongoing discussions will likely take months and last beyond both the upcoming Israeli election (before 27 oct) and the US midterm elections on 3 Nov. Beyond those dates the stance by both Israel and the US may harden again versus Iran. But Iran knows that and is most likely preparing for such a hardening turn. Thus a surplus of oil and global oil stock rebuilding in 2027 (as now is mostly projected) is far from given.
Selling down on a ”deal”. Brent crude fell 6.2% last week with accelerated weakness towards the end of the week. Close of the week at $87.33/b and low of the week (and on Friday) of $85.8/b. Brent is falling another 4% this morning to $83.7/b on confirmation by Iran that a MoU text has been reached and that it will be signed on Friday this week.
So what is this ”deal” worth? Talk on the desk here this morning is that it is much like ”putting lipstick on a pig” where Trump has to sell this at home as a victory where ”the SoH has reopened”, the nuclear issue will be ironed out over the coming 60 days (or maybe 600 days?) and US consumers are getting a lower gasoline price and maybe US republicans survives the midterm elections.
The importance for Iran is that it emerges as the defacto winner of this war in the eyes of the non-US public world. That Iran now onwards is the ”ruler of the SoH” (combo of geography and new weapons systems like drones) or more softer: ”the guarantor of safe passage through the SoH”.
Iran doesn’t need nuclear weapons any more. Nuclear deterrence doesn’t work any more. Ukraine has made many attacks deep into Russia without being nuked in return. Plenty of Iranian ballistic rockets blasts over Israel but Iran wasn’t nuked in return.
There is no trust between the US and Iran. We don’t know all the details yet of the MoU. But what we do know is that there is no trust between the US and Iran what so ever. This is probably more like a descriptive text on how they can cooperate in a way where both sides keeps tactical leverage. Neither side makes irreversible concessions. Violations can be punished quickly. Cooperation produces immediate benefits.
This is a fragile structure. It can easily break down. There may be details which cannot be overcome. To be seen on Friday. The US has to show that it is willing put enough force behind managing and restraining Israel versus Hezbollah in Lebanon. We have seen that Netanyahu hasn’t listened all that much to Trump’s directives and wishes. This could be a major obstacle.
A gradual reopening is tactically preferable for Iran. A tactical leverage for Iran right now is that global oil stocks have been drawn down towards painful and increasingly dangerous levels with increasing risks for oil price spikes in mid-July to August. This together with US midterm elections on 3 November gives tactical leverage to Iran. Iran probably doesn’t want to fully give up on that leverage. A rapid, full reopening where global stocks are able to refill over the coming 60 days will significantly erode that leverage. If Iran reinstates a closure of the SoH after 60 days (if talks break down again), then the effect won’t be that impactful in terms of prices and the US midterm elections.
So a gradual and partial reopening where global markets gets the oil they need while they are unable to rebuild stocks could be a practical middle way for both parties. Trump can sell it as ”the SoH has reopened” and get affordable gasoline for US consumers. Iran can sell it as ”the SoH has fully reopened, but there is some friction” so flow is only 60-80% of normal.
Not much real demand destruction below $100/b. What we do know is that there is not much real price pain demand destruction for oil globally at an oil price below $100/b. A lot of demand-shock destruction. Fear. But demand should now come roaring back towards normal with fear for exceptionally high prices now is rapidly receding.
Sudden China demand destruction due to EVs? Bullocks. EV share of total Chinese carpool now around 13%. Share of new sales of EVs has reached 50%. This is a very gradual process. It doesn’t make oil demand fall like a rock over night. When EV new sales share reaches 100%, then the gasoline car pool will contract by some 5-10% per year. But that is only gasoline. Sudden reduction in Chinese oil demand is more about shock and risk.
Chinese crude oil imports will come roaring back. At what price? Today’s ”neutral” oil price is $70/b. That is the five year price which has steadily traded around the $70/b mark over the past 3-4 years. With still a risky picture one would think that China and the rest of the world will be big buyers of oil in the range of $70-85/b.
Global demand will likely snap back towards normal, forecasted demand and growth at such prices.
Physical reopening is a gradual process. The physical and practical reopening of the SoH will likely be gradual rather than sudden. And that probably suites Iran tactically as well.
Brent M1 price versus the Brent 5-yr (today’s ”normal” price)

Market is starting to take US/Iran headlines with a pinch of salt. Brent crude rose $2.8/b yesterday to an official close of $112.1/b. But after that it traded as low as $108.05/b before ending late night at around $109.7/b. Through the day it traded in a range of $106.87 – 112.72/b amid a flurry of news or rumors from Iran and the US. ”US temporary sanctions during negotiations” (falls alarm). ”We will bomb Iran” (not anyhow),… etc. While the market is still fluctuating to this kind of news flow, it is starting to take such headlines with a pinch of salt.
We’ll see. Maybe, maybe not. The Brent M1 contract is trading at $110.2/b this morning which very close to the average ticks through yesterday of $110.4/b.
Trump with bearish, verbal intervention whenever Brent trades above $110/b it seems. What seems to be a pattern is that Trump states something like ”very good negotiations going on with Iran”, ”New leaders in Iran are great,..”, ”Great progress in negotiations,…”, ”Deal in sight,..” etc whenever the Brent M1 contract trades above $110/b. An effort to cool the market. These hot air verbal interventions from Trump used to have a heavy bearish impact on prices, but they now seems to have less and less effect unless they are backed by reality.
As far as we can see there has been no real progress in the negotiations between the US and Iran with both sides still standing by their previous demands.
Iran is getting stronger while the cease fire lasts making a return to war for Trump yet harder. Iran is naturally in constant preparation for a return to war given Trump’s steady threats of bombing Iran again. Iran is naturally doing what ever is possible to prepare for a return to war. And every day the cease fire lasts it is better prepared. This naturally makes it more and more difficult and dangerous for the US to return to warring activity versus Iran as the consequences for energy infrastructure in the Persian Gulf will be more and more severe the longer the cease fire lasts. Israel seems to see it this way as well. That the war is not won and that current frozen state of a cease fire gives Iran opportunity to rebuild military and politically.
Global inventories are drawing down day by day. How much? In the meantime the Strait of Hormuz stays closed. There is varying measures and estimates of how much global inventories are drawing down. Our rough estimate, back of the envelope, is that global inventories are drawing down by at least some 10 mb/d or about 300 mb/d in a balance between loss of supply versus demand destruction. Other estimates we see are a monthly draw of 250-270 mb/d. The IEA only ’measured’ a draw in global observable stocks of 117 mb in April with oil on water rising 53 mb while on shore stocks fell 170 mb. But global stocks are hard to measure with large invisible, unmeasured stocks. As such a back of the envelope approach may be better.
Oil products is what the world is consuming. Oil product prices likely to rise while product stocks fall. Strategic Petroleum Reserves (SPR) are predominantly crude oil. Discharging oil from OECD SPR stocks, a sharp reduction in Chinese crude imports and a reduction in global refinery throughput of 6-7 mb/d has helped to keep crude oil markets satisfactorily supplied. But global inventories are drawing down none the less. And oil products is really what the world is consuming. So if global refinery throughput stays subdued, then demand will eventually have to match the supply of oil products. The likely path forward this summer is a steady draw down in jet fuel, diesel and gasoline. Higher prices for these. Then, if possible, higher refinery throughput and higher usage of crude in response to very profitable refinery margins. And lastly sharper draw in crude stocks and higher prices for these. But some 6 mb/d of oil products used to be exported through the Strait of Hormuz. And it may not be so easy to ramp up refinery activity across the world to compensate. Especially as Ukraine continues to damage Russian refineries as well as Russian crude production and export facilities.
Watch oil product stocks and prices as well as Brent calendar 2027. What to watch for this summer is thus oil product inventories falling and oil product premiums to crude rising. Another measure to watch is the Brent crude 2027 contract as it rises steadily day by day as the Strait of Hormuz stays closed and global oil inventories decline. The latter is close to the highest level since the start of the war and keeps rising.
The Brent M1 contract and the Brent 2027 prices and current price of jet fuel in Europe (ARA). All in USD/b

Our back of the envelope calculation of the global shortage created by the closure of the Strait of Hormuz. Note that 3.5 mb/d of discharge from SPR is also a draw. Note also that ’Forced demand loss’ of 2.5 mb/d is probably temporary and will fall back towards zero as logistics are sorted out leaving ’Price demand loss’ to do the job of balancing the market. Thus a shortfall of at least 9 mb/d created by the closure. More if SPR discharge is included and more if Forced demand loss recedes.


Brent falling like a rock with oil likely to flow from SoH until at least 3 November

Vattenfalls och Industrikrafts kärnkraftsbolag Videberg Kraft har valt Rolls-Royce SMR
Selling down on a ”deal”

Sommarväder skapar prisrally på elbörsen
Oil product price pain is set to rise as the Strait of Hormuz stays closed into summer
Sommarväder skapar prisrally på elbörsen
Vattenfalls och Industrikrafts kärnkraftsbolag Videberg Kraft har valt Rolls-Royce SMR
Selling down on a ”deal”
Brent falling like a rock with oil likely to flow from SoH until at least 3 November
-
Nyheter3 veckor sedan
Sommarväder skapar prisrally på elbörsen
-
 Nyheter1 vecka sedan
Vattenfalls och Industrikrafts kärnkraftsbolag Videberg Kraft har valt Rolls-Royce SMR
-
Analys1 vecka sedan
Selling down on a ”deal”
-
Analys6 timmar sedan
Brent falling like a rock with oil likely to flow from SoH until at least 3 November