

Analys
SEB – Råvarukommentarer, 3 november 2014

Veckans rekommendationer
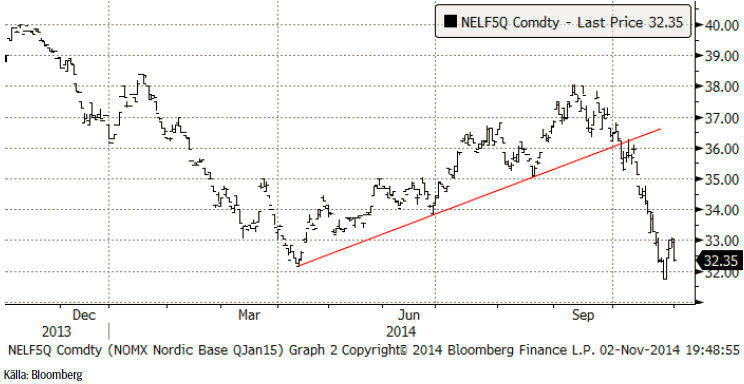
Råolja – Brent
Fredagens huvudnyhet på oljemarknaden var att OPEC producerade 31 mbpd i oktober, över sitt produktionstak på 30 mbpd. Det finns alltså inga tecken på att OPEC minskar utbudet. Lägg därtill en starkare dollar och att oljepriset fortsätter att handlas ner. Oljepriset har sjunkit den senaste veckan trots ökande tillväxtoptimism, högre BNP-tillväxt i USA än väntat och stimulans från Bank of Japan. Aktier och metaller har gått upp i pris på detta, men oljan fortsätter nedåt.
VD:n för det amerikanska bolaget Cheniere Energy sade i veckan att ”WTI kommer nästan helt säkert att falla till 50 – 60 dollar per fat. Kostnaderna för att producera amerikansk skifferolja är mycket lägre än vad många tror.”
Vi erfar att amerikansk skifferoljeproduktion är billigare än konventionell amerikansk olja. Amerikansk skifferolja kostar 58 dollar per fat medan konventionell kostar 60 dollar. Statoil sade i veckan att man inte kan förbli konkurrenskraftig som oljebolag om man inte producerar skifferolja.
Vi tror att det tar 6-12 månader för att bromsa tillväxten i amerikansk skifferoljeproduktion efter att priset har fallit till under break-even och det priset är inte uppnått än. Det finns dock ännu inte några tecken på att skifferoljeproduktionen tar fart på allvar utanför USA. Det beror huvudsakligen på att det saknas infrastruktur.
Förra veckan noterade vi att det sker en lageruppbyggnad i Saudiarabien därför att de faktiskt inte lyckas sälja all ökad produktion av olja. På global basis är detta mer betydelsefullt än man med de senaste årens erfarenhet av brist kan föreställa sig. Fortsätter produktionsökningen i USA på dagens nivå kommer det att vara ett produktionsöverskott på 2 mbpd nästa år om produktionen inte minskar. I den takten fylls alla tänkbara lagringsmöjligheter på sex månader.
Det finns dock även positiva tecken. Kina har tagit alla ”överskottslaster”. Västafrika höjde sina benchmarkpriser istället för att sänka dem, som Irak, Iran och Saudiarabien.
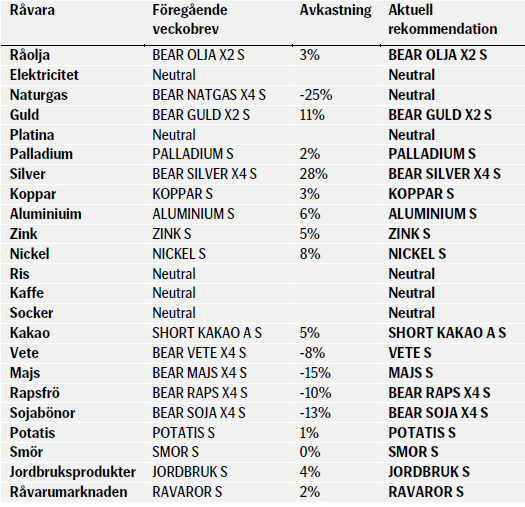
Nedan ser vi ett diagram på antalet oljeriggar i USA, enligt Baker Hughes statistik (svart). Antalet ökade med 2 från förra veckan.
Vi rekommenderar en kort position, t ex med BEAR OLJA X2 S.
Elektricitet
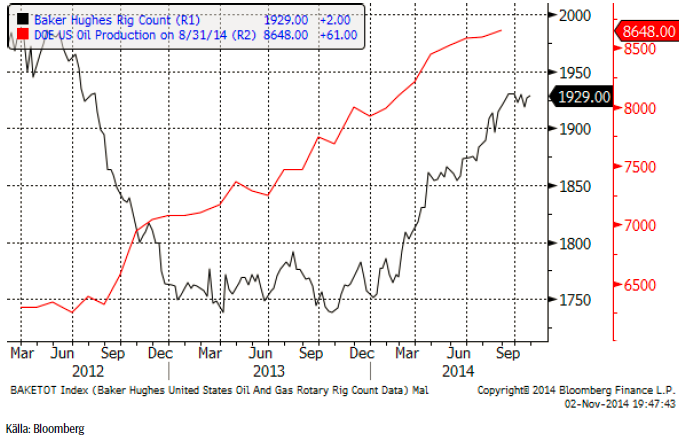
Priset på el studsade på 32 euro, där vi rekommenderade att ta hem vinster i förra veckans brev. Priset rekylerade till 33 euro, men föll i fredags återigen och stängde på 32.35. Det är möjligt att det kan komma en nytt test av stödet vid 32 euro.
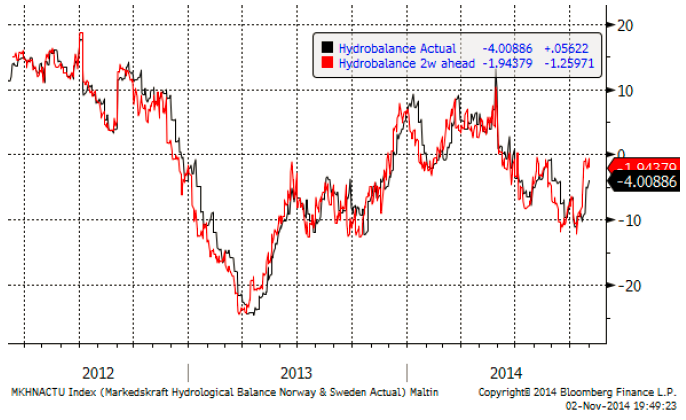
Hydrologisk balans har enligt 2-veckors prognosen stigit till nästan normal nivå. Vädret väntas fortsatt att vara både varmt och nederbördsrikt.
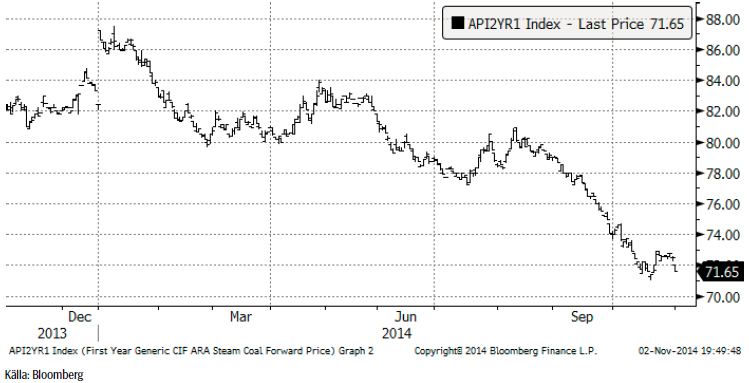
Nedan ser vi terminspriset för kalenderåret 2015 avseende energikol. Priset rekylerade uppåt från 71 dollar för drygt en vecka sedan, men detta vände inte trenden. Efter lite sidledes rörelse föll priset ganska kraftigt i fredags och stängde på 71.65 dollar per ton. Ett nytt test av 71 dollarsnivån verkar vara inom räckhåll.
Vi rekommenderade förra veckan att ta hem vinsterna på den korta positionen. Tendensen i marknaden är dock fortsatt negativ. Skulle prisnivån 32 euro brytas, kan det vara aktuellt att gå kort igen.
Naturgas
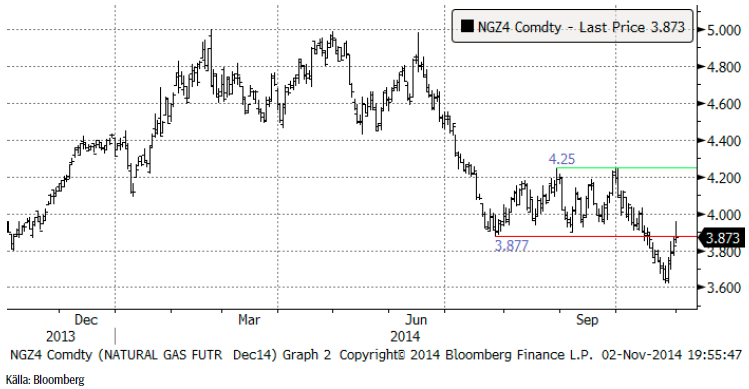
Naturgaspriset (decemberkontraktet) startade en rekyl från 3.60, som tog priset upp till 3.873 i fredags (strax under motståndet 3.877), även om priset var högre under fredagen. Tekniskt borde priset gå ner och vi håller därför fast vid BEAR NATGAS X4 S.
Koppar
Med hög volatilitet handlades kopparpriset högre hela veckan. Från teknisk synvinkel, rekylerar priset den större, fallande pristrenden från början av året. Ur ett fundamentalt perspektiv är detta i linje med förväntningarna om att marknaden går från underskott till överskott. Enligt International Copper Study Group (ICSG) kommer år 2014 att uppvisa ett underskott på 307 kt, som vänds till ett överskott på 393 kt nästa år. Den här förändringen har ännu inte resulterat i en svagare marknad. Bristen på material på LME håller marknaden i ett hårt grepp. Cash till 3-månaders terminsnotering handlas i stadig backwardation på 60 – 70 dollar. Resten av terminskurvan uppvisar ungefär samma mönster. Den globala ekonomin har i någon mån stärkts den senaste tiden med mer stimulans och statistik från USA som visar att tillväxten är god. Säsongsmässigt är vi nu inne i det starkaste kvartalet. Vi behåller åsiken att det finns utsikter för högre pris på koppar resten av året.
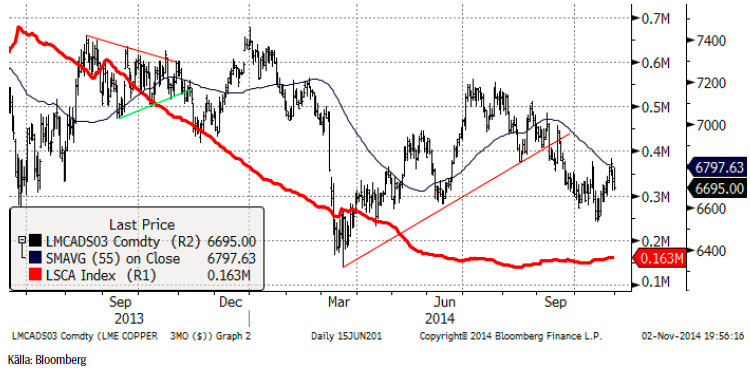
Koppar är den enda basmetallen som handlas i USA och därför har vi tillgång till statistik på vad spekulantkollektivet gör där. Vi ser att de har sålt sig ganska korta sedan början av juli. Nettopositionen är 21,000 kontrakt. I den rapport som kom i fredags kväll och visade förändringen tisdag – tisdag, hade de köpt tillbaka 6000 kontrakt. En stor såld position kan när den täcks ge lite extra stöd för priset.
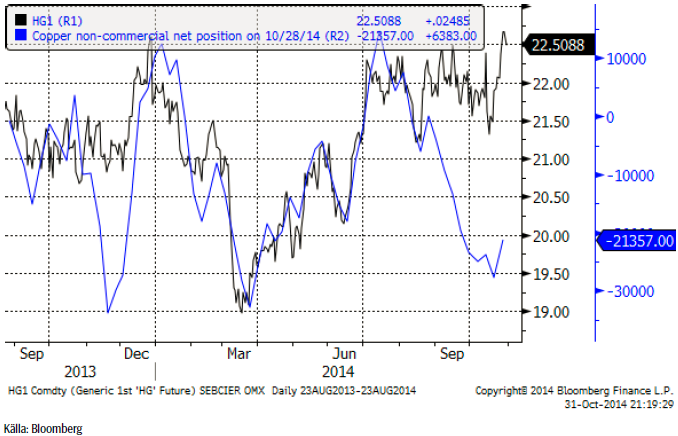
Vi håller fast vid vår rekommendation av KOPPAR S.
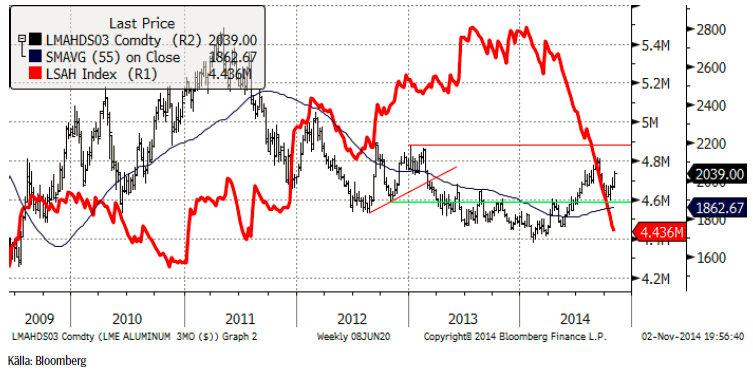
Aluminium
Det är intressant att notera att aluminiumtackor har återlämnats till LME mot lagerbevis (warrants) för första gången sedan det var backwardation senast, i augusti. Detta har noterats bland annat i lagerhuset i Vlissingen. Det noterades ett nettoinflöde även den 30 oktober. Inflödet är ett tecken på att aktörer drar nytta av den backwardation som finns i terminspriserna. De säljer spot och köper tillbaka på termin. Som vi har påpekat tidigare, ger de höga premierna (>500 dollar) i både USA och i EU, en anledning att vid något tillfälle sälja istället för att förnya finansieringsaffärerna.
Samtidigt som efterfrågan tar fart globalt, tror vi att aluminiummarknaden kommer att vara stark resten av året. Priset gick upp varje dag i veckan som gick. Det tekniska motståndet vid 2040-50 dollar var dock lite för svårt att byta igenom och vi såg tendenser till vinsthemtagningar framåt fredagens eftermiddag.
Vi fortsätter att rekommendera köp av ALUMINIUM S.
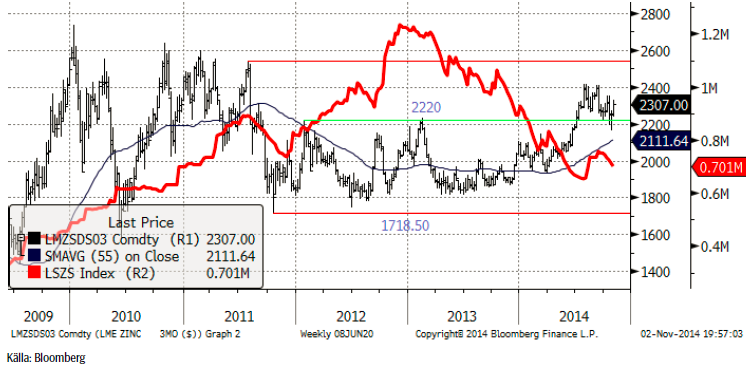
Zink
Skillnaden mellan cash och 3-månaders termin på zink handlades ner i backwardation i veckan och i fredags hade skillnaden hunnit bli 8 dollar. Längre ut på terminskurvan är det fortfarande contango. Utflödet av metall från LME sker huvudsakligen på ett enda ställa, New Orleans. Det anses tyda på att materialet bara flyttas till ett billigare lager (till finansieringsaffärer). Om metallen skulle gå till konsumtion, skulle man normalt se utflöden på fler ställen och i små enheter.
I motsats till aluminium, är den fysiska premien för zink inte förhöjd och den fysiska marknaden präglas inte av brist. Två teman har varit i fokus på zinkmarknaden i år. För det första verkar fonder och CTA:s gilla metallen, vilket beror på den positiva långsiktiga trenden som beror på gruvnedläggningar. De har handlat in och ut och hållit marknaden inom olika prisintervall. För det andra har uppsidan varit begränsad av prissäkring från gruvbolag. 2400 dollar verkar vara nivån. Vi har noterat den stadiga förbättringen av den fundamentala balansen, såsom rapporterat huvudsakligen av International Zink Study Group (ILZSG). Baserat på data därifrån förväntar vi oss ytterligare lagerminskningar och en stadigare positiv pristrend. Vår bedömning är att priset kommer att ligga i intervallet 2200 – 2350 dollar per ton under det fjärde kvartalet. Vi kan möjligen få se 2400 dollar (toppnoteringen från sommarmånaderna).
Vi rekommenderar köp av ZINK S.
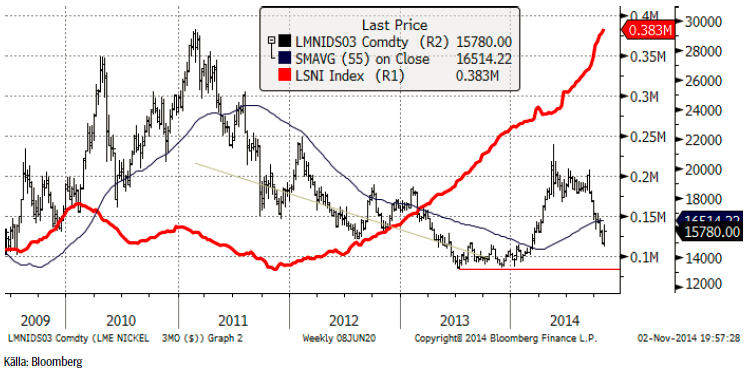
Nickel
Veckan började på samma sätt som den gjort sedan den fallande pristrenden började i mitten av september, dvs svagt. Den viktiga tekniska stödnivån på 15,800 dollar testades och bröts, men inga stop-loss-ordrar eldade på prisfallet. På tisdagsmorgonen vände marknaden. En våg av ”short covering” tryckte upp priset ända till 15,650 senare på kvällen. Efter lite lugnare handel och konsolidering mitt i veckan, steg priset till veckans högsta nivå, 16,175 dollar på fredagen, innan vinsthemtagningar inför helgen tog överhanden och stängde marknaden strax under 16,000 dollar.
Det verkar som om marknadens aktörer vände fokus till den fundamentala situationen, och att det mesta av NPI-produktionen blir olönsam vid de här prisnivåerna på primärnickel. Om man beaktar den sämre filippinska malmen, som motsvarar en produktionskostnad på nickel på runt 20,000 dollar, verkar dagens nivå attraktiv. Vi hör talas om att långsiktiga investerare har börjat eller börjar utnyttja det låga priset som rekylen har gett upphov till, för att bygga en lång position. Tekniskt kan man säga att den branta rekylen något bröts av veckans handel och det ger i första hand en indikation på att man kan vänta sig ”sidledes” handel mellan 15,000 och 17,000 dollar per ton.
Vi tycker att de kommande veckorna kan ge möjlighet att komma in på den långa sidan och rekommenderar köp av NICKEL S.
Guld
Guldpriset har tagit stryk av tre anledningar: För det första har QE3 avslutats i USA. Det var i och för sig helt väntat att FED:s nedtrappning av obligationsköpen skulle sluta nu. Nedtrappningen inleddes veckan före jul för nu nästan ett år sedan och nådde sitt slut nu. Den andra faktorn, som pressar guldpriset är att när FED senast uttalade sig om räntan, föreföll det luta lite mer åt räntehöjningar än tidigare. Tillväxten i USA överraskar också på den positiva sidan. På grund av såväl lite mer positiva utsikter för räntehöjning, hög tillväxt och allmän oro i världen, fortsätter dollarn att stiga mot andra valutor – och mot guldet. Med andra ord sjunker priset på guld uttryckt i dollar.
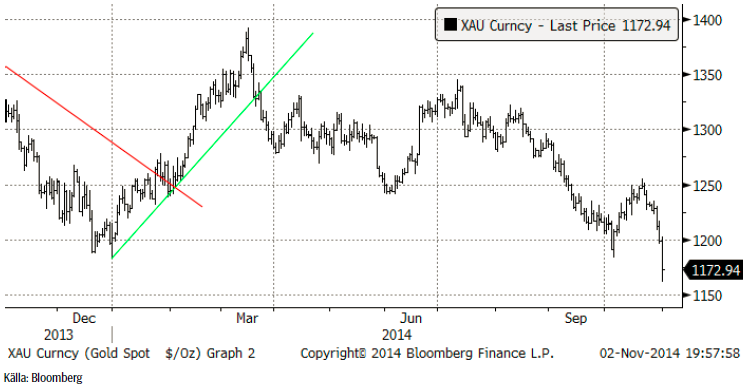
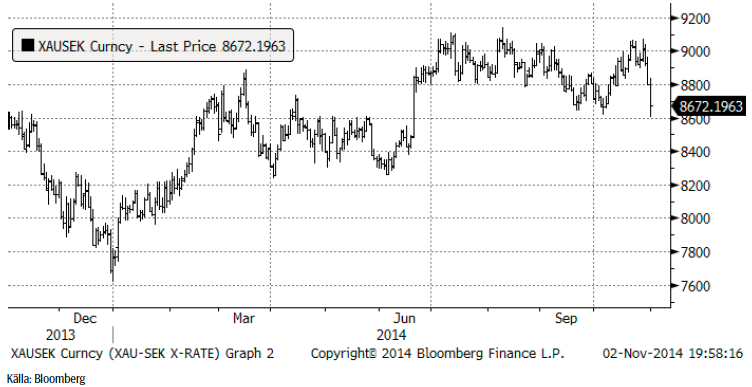
Chartet för guld i kronor ligger kvar vid 8850 kronor per uns.
Investerare fortsätter att sälja av guldfonder och hittills i oktober även silverfonder.
Den ryska centralbanken fortsätter att köpa guld. Detta måste ses mot bakgrund av att den ryska rubeln har tappat 23% mot dollarn sedan månadsskiftet juni/ juli. Valutafallet hejdades temporärt i torsdags, men tog ny fart på fredagen och Rysslands köp av guld har i vart fall inte haft någon synlig effekt på svagheten i guldpriset.
Vi fortsätter med såld position i guld, t ex med BEAR GULD X2 S.
Silver
Silverpriset föll huvudsakligen i torsdags och i fredags och det var ett relativt kraftigt prisfall.
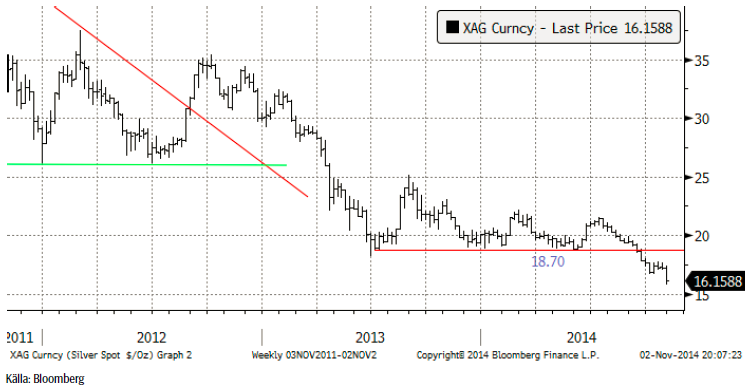
Silverpriset i svenska kronor har brutit stödet vid 123 kronor per uns. Nästa stöd finns nu vid 100 kr per uns, som agerade motstånd från 2006 och framåt och stöd från år 2009. Uppsidan är nu begränsad av 123 kr, som är det nya motståndet. Marknaden kommer att ha mycket svårt att ta sig över den nivån, med tanke på hur länge det fungerade som stöd.
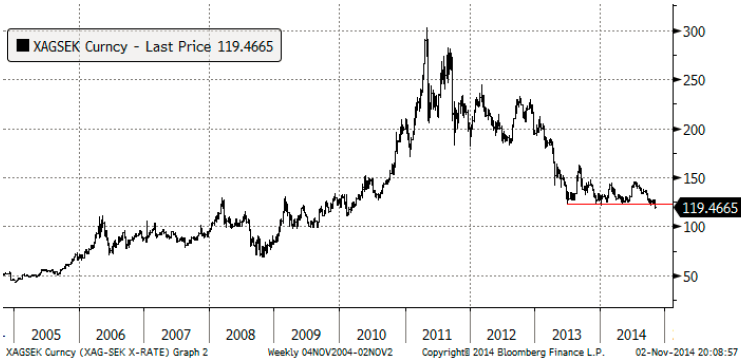
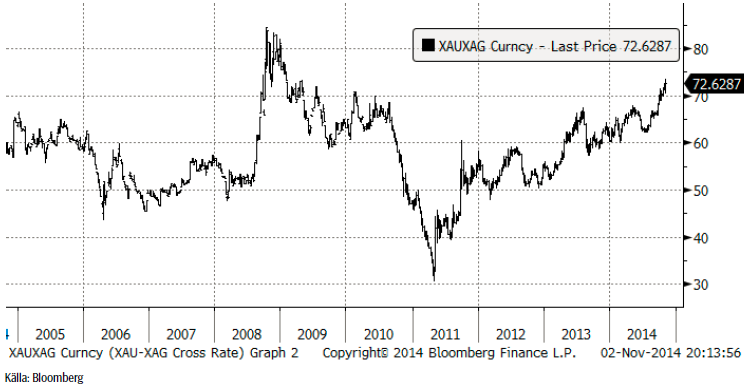
Silver är fortsatt billigt i förhållande till guld och det kan vara en anledning att byta en investering i guld mot silver.
Vi fortsätter att på kort sikt rekommendera en kort position i silver med köp av BEAR SILVER X4 S.
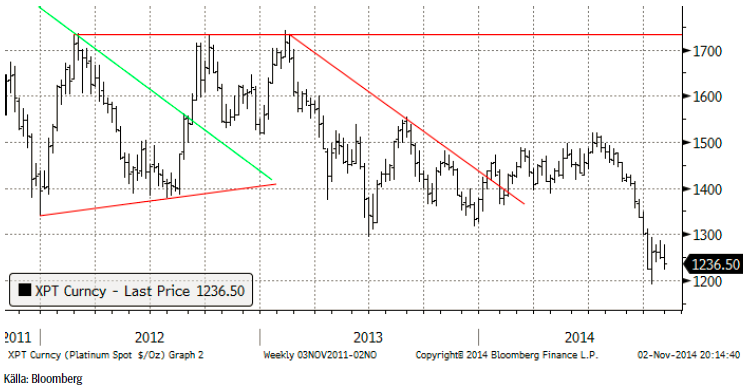
Platina & Palladium
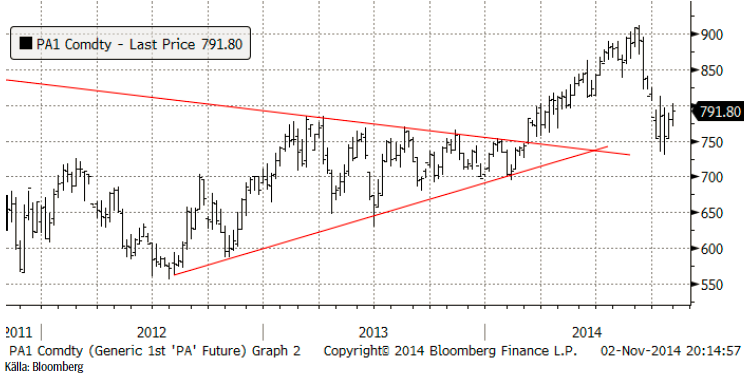
Både platina och palladium har befunnit sig i konsolideringsfas några veckor. I fredags verkade konsolideringen vara över för båda metallerna, men de ser ut att bryta ut åt olika håll. Medan platina föll kraftigt mot slutet av veckan, tillsammans med guld och silver, visade palladium styrka och verkar vara på väg att testa 900 dollar igen.
Palladium fick som väntat stöd vid 750 dollar. I veckan tog marknaden vad som kan vara det första steget uppåt för att kanske lämna den här rekylen nedåt och konsolideringen bakom sig. Nästa motstånd finns på 850 och därefter 900 dollar.
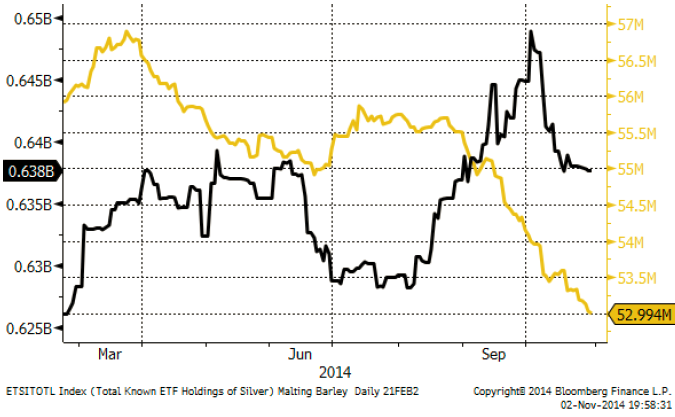
Nedanför ser vi hur mycket metall som finns i börshandlade fonder för platina respektive palladium. Investerare fortsätter att sälja av platina, men verkar behålla sitt palladium och till och med öka på den.
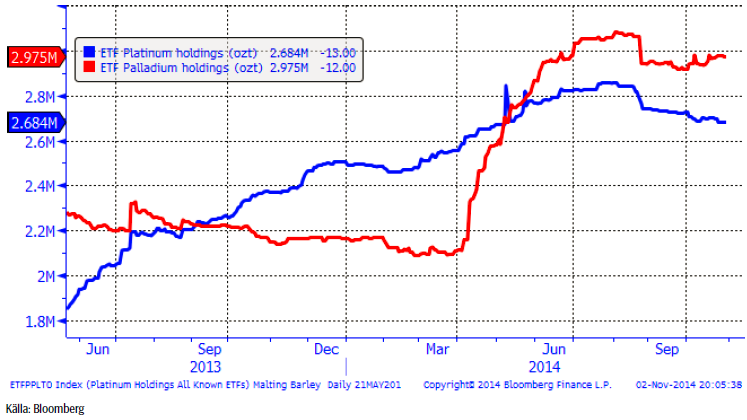
Vi fortsätter med neutral rekommendation på platina, men rekommenderar köp av palladium via t ex PALLADIUM S.
[box]SEB Veckobrev Veckans råvarukommentar är producerat av SEB Merchant Banking och publiceras i samarbete och med tillstånd på Råvarumarknaden.se[/box]
Disclaimer
The information in this document has been compiled by SEB Merchant Banking, a division within Skandinaviska Enskilda Banken AB (publ) (“SEB”).
Opinions contained in this report represent the bank’s present opinion only and are subject to change without notice. All information contained in this report has been compiled in good faith from sources believed to be reliable. However, no representation or warranty, expressed or implied, is made with respect to the completeness or accuracy of its contents and the information is not to be relied upon as authoritative. Anyone considering taking actions based upon the content of this document is urged to base his or her investment decisions upon such investigations as he or she deems necessary. This document is being provided as information only, and no specific actions are being solicited as a result of it; to the extent permitted by law, no liability whatsoever is accepted for any direct or consequential loss arising from use of this document or its contents.
About SEB
SEB is a public company incorporated in Stockholm, Sweden, with limited liability. It is a participant at major Nordic and other European Regulated Markets and Multilateral Trading Facilities (as well as some non-European equivalent markets) for trading in financial instruments, such as markets operated by NASDAQ OMX, NYSE Euronext, London Stock Exchange, Deutsche Börse, Swiss Exchanges, Turquoise and Chi-X. SEB is authorized and regulated by Finansinspektionen in Sweden; it is authorized and subject to limited regulation by the Financial Services Authority for the conduct of designated investment business in the UK, and is subject to the provisions of relevant regulators in all other jurisdictions where SEB conducts operations. SEB Merchant Banking. All rights reserved.

Market is starting to take US/Iran headlines with a pinch of salt. Brent crude rose $2.8/b yesterday to an official close of $112.1/b. But after that it traded as low as $108.05/b before ending late night at around $109.7/b. Through the day it traded in a range of $106.87 – 112.72/b amid a flurry of news or rumors from Iran and the US. ”US temporary sanctions during negotiations” (falls alarm). ”We will bomb Iran” (not anyhow),… etc. While the market is still fluctuating to this kind of news flow, it is starting to take such headlines with a pinch of salt.

We’ll see. Maybe, maybe not. The Brent M1 contract is trading at $110.2/b this morning which very close to the average ticks through yesterday of $110.4/b.
Trump with bearish, verbal intervention whenever Brent trades above $110/b it seems. What seems to be a pattern is that Trump states something like ”very good negotiations going on with Iran”, ”New leaders in Iran are great,..”, ”Great progress in negotiations,…”, ”Deal in sight,..” etc whenever the Brent M1 contract trades above $110/b. An effort to cool the market. These hot air verbal interventions from Trump used to have a heavy bearish impact on prices, but they now seems to have less and less effect unless they are backed by reality.
As far as we can see there has been no real progress in the negotiations between the US and Iran with both sides still standing by their previous demands.
Iran is getting stronger while the cease fire lasts making a return to war for Trump yet harder. Iran is naturally in constant preparation for a return to war given Trump’s steady threats of bombing Iran again. Iran is naturally doing what ever is possible to prepare for a return to war. And every day the cease fire lasts it is better prepared. This naturally makes it more and more difficult and dangerous for the US to return to warring activity versus Iran as the consequences for energy infrastructure in the Persian Gulf will be more and more severe the longer the cease fire lasts. Israel seems to see it this way as well. That the war is not won and that current frozen state of a cease fire gives Iran opportunity to rebuild military and politically.
Global inventories are drawing down day by day. How much? In the meantime the Strait of Hormuz stays closed. There is varying measures and estimates of how much global inventories are drawing down. Our rough estimate, back of the envelope, is that global inventories are drawing down by at least some 10 mb/d or about 300 mb/d in a balance between loss of supply versus demand destruction. Other estimates we see are a monthly draw of 250-270 mb/d. The IEA only ’measured’ a draw in global observable stocks of 117 mb in April with oil on water rising 53 mb while on shore stocks fell 170 mb. But global stocks are hard to measure with large invisible, unmeasured stocks. As such a back of the envelope approach may be better.
Oil products is what the world is consuming. Oil product prices likely to rise while product stocks fall. Strategic Petroleum Reserves (SPR) are predominantly crude oil. Discharging oil from OECD SPR stocks, a sharp reduction in Chinese crude imports and a reduction in global refinery throughput of 6-7 mb/d has helped to keep crude oil markets satisfactorily supplied. But global inventories are drawing down none the less. And oil products is really what the world is consuming. So if global refinery throughput stays subdued, then demand will eventually have to match the supply of oil products. The likely path forward this summer is a steady draw down in jet fuel, diesel and gasoline. Higher prices for these. Then, if possible, higher refinery throughput and higher usage of crude in response to very profitable refinery margins. And lastly sharper draw in crude stocks and higher prices for these. But some 6 mb/d of oil products used to be exported through the Strait of Hormuz. And it may not be so easy to ramp up refinery activity across the world to compensate. Especially as Ukraine continues to damage Russian refineries as well as Russian crude production and export facilities.
Watch oil product stocks and prices as well as Brent calendar 2027. What to watch for this summer is thus oil product inventories falling and oil product premiums to crude rising. Another measure to watch is the Brent crude 2027 contract as it rises steadily day by day as the Strait of Hormuz stays closed and global oil inventories decline. The latter is close to the highest level since the start of the war and keeps rising.
The Brent M1 contract and the Brent 2027 prices and current price of jet fuel in Europe (ARA). All in USD/b

Our back of the envelope calculation of the global shortage created by the closure of the Strait of Hormuz. Note that 3.5 mb/d of discharge from SPR is also a draw. Note also that ’Forced demand loss’ of 2.5 mb/d is probably temporary and will fall back towards zero as logistics are sorted out leaving ’Price demand loss’ to do the job of balancing the market. Thus a shortfall of at least 9 mb/d created by the closure. More if SPR discharge is included and more if Forced demand loss recedes.

Brent is climbing higher. Front-month is at USD 106.3/bl this morning, close to a weekly high and a USD 9/bl jump from Mondays open. This is the move we flagged as a risk earlier in the week: the market shifting from ”a deal is around the corner” to ”this is going to take longer than we thought”.

Analyst Commodities, SEB
During April, rest-of-year Brent remained remarkably stable around USD 90/bl. A stability which rested on one single assumption: the SoH reopens around 1 May. That assumption is now slowly falling apart.
As we highlighted yesterday: every week of delay beyond 1 May adds (theoretically) ish USD 5/bl to the rest-of-year average, as global inventories draw 100 million barrels per week. i.e., a mid-May reopening implies rest-of-year Brent closer to USD 100/bl, and anything pushing into June or July takes us meaningfully higher.
What’s changed in the last 48 hours:
#1: The US military has formally warned that clearing suspected sea mines from SoH could take up to six months. That is a completely different timescale from what the financial market is pricing. Even a political deal tomorrow does not immediately reopen the strait.
#2: Trump has shifted his tone from urgency to ”strategic patience”. In yesterday’s press conference: ”Don’t rush me… I want a great deal.” The market is reading this as a president no longer feeling pressured by timelines, with the naval blockade running in the background.
#3: So far, the military activity is escalating, not de-escalating. Axios reports Iran is laying more mines in SoH. The US 3rd carrier strike group (USS George H.W. Bush) is arriving with two countermine vessels. Trump yesterday ordered the US Navy to destroy any Iranian boats caught laying mines. While CNN reports that the Pentagon is actively drawing up plans to strike Iranian SoH capabilities and individual Iranian military leaders if the ceasefire collapses. i.e., NOT a attitude consistent with an imminent deal!
Spot crude and product prices eased off the early-April highs on a combination of system rerouting and deal optimism. Both now weakening. Goldman estimates April Gulf output is reduced by 14.5 mbl/d, or 57% of pre-war supply, a number that keeps getting worse the longer this drags on.
Demand-side adaptation is ongoing: S. Korea has cut its Middle East crude dependence from 69% to 56% by pulling more from the Americas and Africa, and Japan is kicking off a second round of SPR releases from 1 May. But SPRs are finite.
Ref. to the negotiations, we should not bet on speed. The current Iranian leadership is dominated by genuine hardliners willing to absorb economic pain and run the clock to extract concessions. That is not a setup for a rapid resolution. US/Israeli media briefings keep framing the delay as ”internal Iranian divisions”, the reality is more complicated and points toward weeks and months, not days.
Our point is that the complexity is large, and higher prices have only just started (given a scenario where the negotiations drag out in time). The market spent April leaning on the USD 90/bl rest-of-year assumption; that case is diminishing by the hour. If ”early May reopening” is replaced by ”June, July or later” over the next week or two, both crude and products have meaningful room to reprice higher from here. There is a high risk being short energy and betting on any immediate political resolution(!).
Down on Friday. Up on Monday. The Brent June crude oil contract traded down 5.1% last week to a close of $90.38/b. It reached a high of $103.87/b last Monday and a low of $86.09/b on Friday as Iran announced that the Strait of Hormuz was fully open for transit. That quickly changed over the weekend as the US upheld its blockade of Iranian oil exports while Iran naturally responded by closing the SoH again. The US blew a hole in the engine room of the Iranian ship TOUSKA and took custody of the ship on Sunday. Brent crude is up 5.6% this morning to $95.4/b.
The cease-fire is expiring tomorrow. The US has said it will send a delegation for a second round of negotiations in Islamabad in Pakistan. But Iran has for now rejected a second round of talks as it views US demands as unrealistic and excessive while the US is also blocking the Strait of Hormuz.
While Brent is up 5% this morning, the financial market is still very optimistic that progress will be made. That talks will continue and that the SoH will fully open by the start of May which is consistent with a rest-of-year average Brent crude oil price of around $90/b with the market now trading that balance at around $88/b.
Financial optimism vs. physical deterioration. We have a divergence where the financial market is trading negotiations, improvements and resolution while at the same time the physical market is deteriorating day by day. Physical oil flows remain constrained by disrupted flows, longer voyage times and elevated freight and insurance costs.
Financial markets are betting that a US/Iranian resolution will save us in time from violent shortages down the road. But every day that the SoH remains closed is bringing us closer to a potentially very painful point of shortages and much higher prices.
The US blockade is also a weapon of leverage against its European and Asian allies. When Iran closed the SoH it held the world economy as a hostage against the US. The US blockade of the SoH is of course blocking Iranian oil exports. But it is also an action of disruption directed towards Europe and Asia. The US has called for the rest of the world to engaged in the war with Iran: ”If you want oil from the Persian Gulf, then go and get it”. A risk is that the US plays brinkmanship with the global oil market directed towards its European and Asian allies and maybe even towards China to force them to engage and take part. Maybe unthinkable. But unthinkable has become the norm with Trump in the White House.


Oil product price pain is set to rise as the Strait of Hormuz stays closed into summer

Solkraften pressar elpriserna dagtid

Michel Gubel ger sin syn på oljemarknaden


