

Analys
SEB – Råvarukommentarer, 17 mars 2014

Rekommendationer
Kort sammanfattning
Råvarumarknaderna var relativt stökiga förra veckan. Koppar inledde veckan med att falla kraftigt, liksom zink. Vetepriset i USA steg med 6%, men backade med 2% i Europa. I Europa, som var soligt och varmt, men nederbördsrikt i svensk/norska fjällen, föll elpriset kraftigt och noterade en ny kontraktslägsta för det tredje kvartalet. Globalt odlingsväder har slagit om från torrt i Syd- och Nordamerika till ordentligt vått och ”rain makes grain”. Sockerpriset föll mot slutet av förra veckan och kaffepriset ser ut att vilja hänga på.
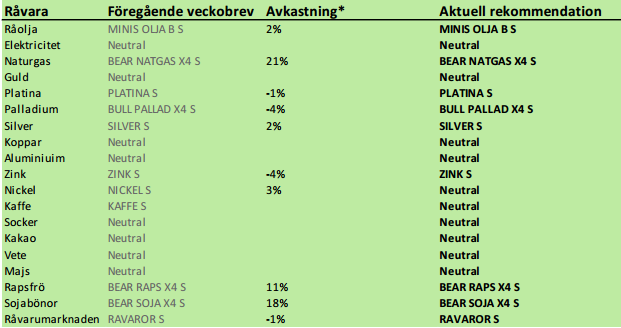
Kinas industriproduktion föll till 8.6% i årstakt i februari enligt statisktik som publicerades i torsdags. Det är ännu en bekräftelse på att landets ekonomi har problem och därmed har de flesta råvarumarknader problem. I diagrammet nedan ser vi förändringen i industriproduktion i Kina på årstakt sedan 2008.
Mot slutet av veckan kom nyheten att Kinas centralbank vidgar intervallet för den kinesiska valutan. Vi tolkar det som en önskan om svagare valuta och alltså en devalvering. Därmed sällar sig Kina till alla länder som vill devalvera sina valutor, dvs öka penningmängden. Det är positivt för ädelmetallerna.
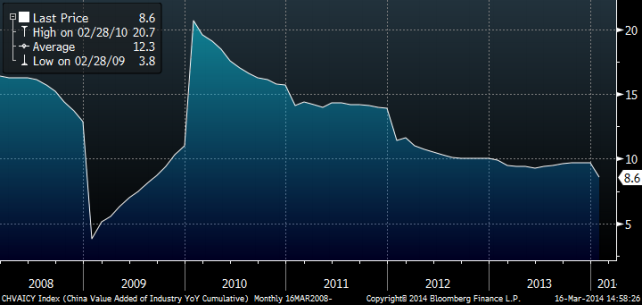
Råolja – Brent
Oljepriset sjönk under lugn handel i veckan från 109 till 108.57 dollar per fat. Vi tror att det är lugnet före stormen, när oljepriset bryter stödet i den stora triangelformation som marknaden handlar inom.
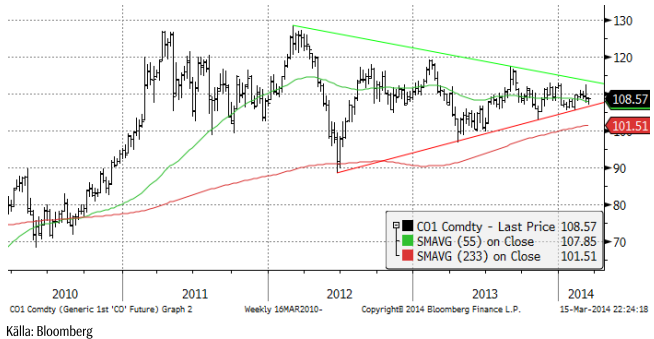
Non-commercials (investerare) är rekordköpta terminskontrakt på NYMEX i New York, enligt CFTC:s rapport i fredags. De äger terminskontrakt för 407 miljoner fat olja. År 2010 var de nästan inte köpta olja alls. Tänk om sentimentet ändrar sig!!!
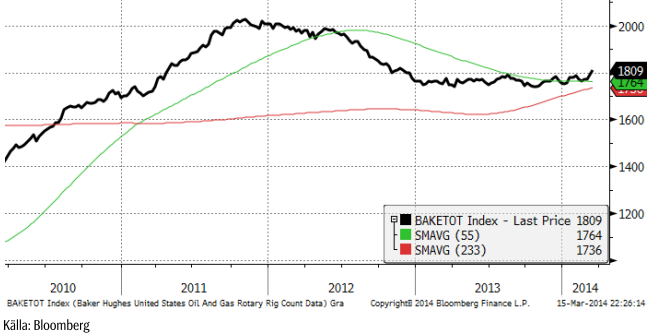
Antalet borr-riggar i USA steg i veckan till 1809 (förra veckan 1792) stycken enligt Baker Hughes. Det är återigen en ökning och bekräftar den trend vi skrev om förra veckan. Skifferboomen i USA har fått ny fart och kommer att resultera i en ännu högre produktionsökning i USA.
Årets lägsta oljepris brukar noteras i april. Förra året var det 97 dollar. I år är marknaden väsentligt svagare. Därför tror vi att priset kommer att gå ännu längre ner, kanske till 95 dollar.
Vi rekommenderar en kort position i olja, t ex med MINIS OLJA B S eller MINIS OLJA A S.
Elektricitet
Kvartal tre fortsatte falla, och nådde nästan ner till 24 euro per MWh. Varmt väder, en prognos om rikligt med nederbörd över svensk/norska fjälltrakten och ett prisfall på 7% i utsläppsrätterna bidrog till prisfallet.
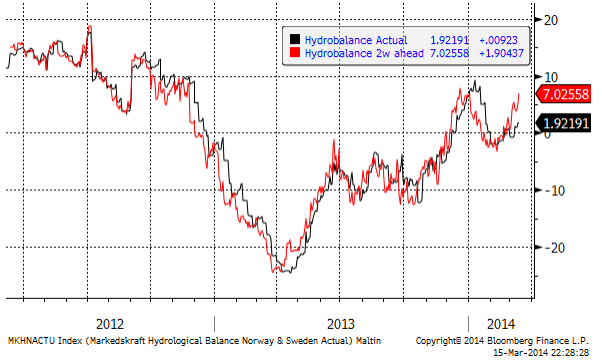
2 veckors prognos för hydrologisk balans har stigit till +7 TWh (förra veckan +5 TWh).
Priset på kol är det enda som visar styrka just nu. EU importerar kol från Ryssland och det kan vara det som påverkar priset, liksom det kan ha gjort för palladium och nickel. 80 dollar är en viktig stödnivå och det är viktigt att den inte bryts.
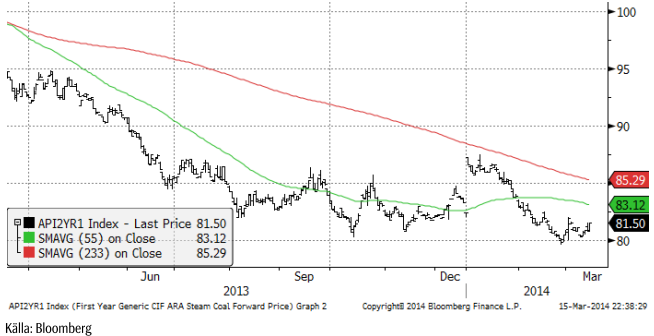
Vi fortsätter med neutral rekommendation. Trenden är tydligt nedåtriktad, men priset är mycket lågt och söker en botten.
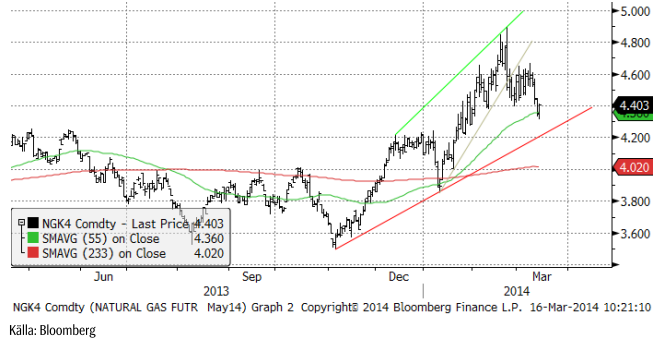
Naturgas
Förra veckan rekommenderade vi köp av BEAR NATGAS X4 S mot bakgrund av att priset stigit en längre tid på det kalla vädret i USA och att varmt väder nu ”borde” komma in i prognosfönstret. Samtidigt såg vi att antalet borr-riggar återigen ökar tydligt och de flesta av dem producerar gas. Japan drar igång sina kärnkraftverk nu och slutar därmed att importera LNG. Det har talats om, bland annat i en annons i New York Times i fredags som en privatperson (!) satt in med anledning av krisen i Ukraina, att EU skulle importera LNG från USA. Om det sker, som en del i det ”paket” som EU och USA ställer upp mot Ryssland efter söndagens ”val” i södra Ukraina, kan det verka stödjande på priset, men annars bör priset i första hand falla ner mot 4.30 – 4.20 dollar per MMBtu. Vi fortsätter med säljrekommendation och behåller BEAR NATGAS X4 S.
Koppar
Den väsentligt svagare industrikonjunkturen i Kina oroar. Priset på koppar har rasat med 13% hittills i år till den lägsta nivån sedan sommaren 2010. I ett tidigare veckobrev för någon tid sedan visade vi produktionskostnaden för Codelco, som är världens ledande producent av koppar. Den låg då ca 10% under priset och det senaste prisfallet bör alltså nu innebära att Codelco inte går runt. Det innebär att utbudet av koppar från nya gruvor kommer att minska på lite längre sikt, men på kort sikt kan priset gå under produktionskostnaden.
Värt att notera är dock att lagren vid LME fortfarande inte visar några tecken på att stiga utan fortsätter att falla.
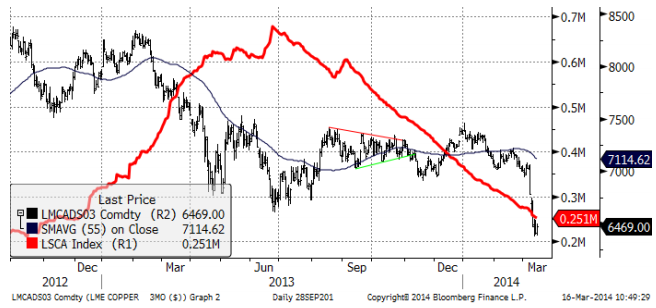
Vi rekommenderar neutral position i koppar.
Aluminium
Aluminiumpriset påverkades av svagheten i kopparmarknaden, men tycks än så länge ha det mest mesta bakom sig.
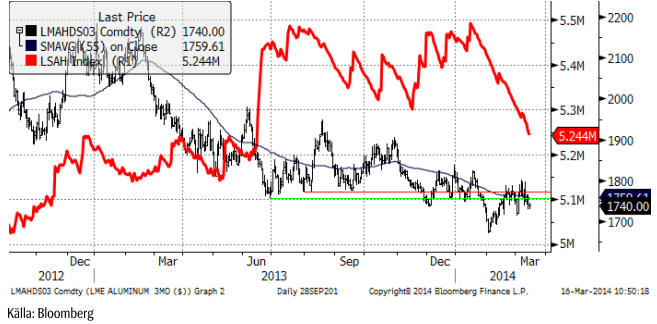
Vi fortsätter med neutral rekommendation på aluminium.
Zink
Zinkrpriset har fallit hela vägen tillbaka från toppen vid 2150. Priset är nu vid ett tekniskt stödområde och vi tror att det är ett bra tillfälle att köpa zink vid.
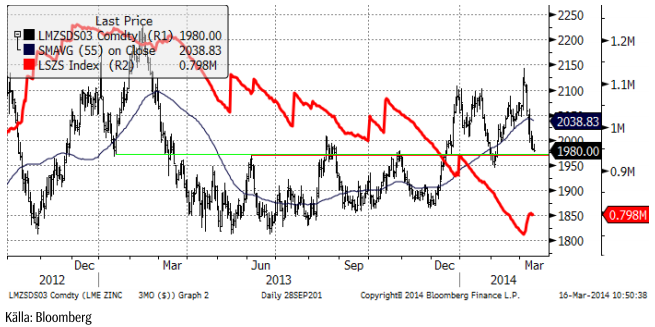
Vi rekommenderar köp av ZINK S eller BULL ZINK X4 S.
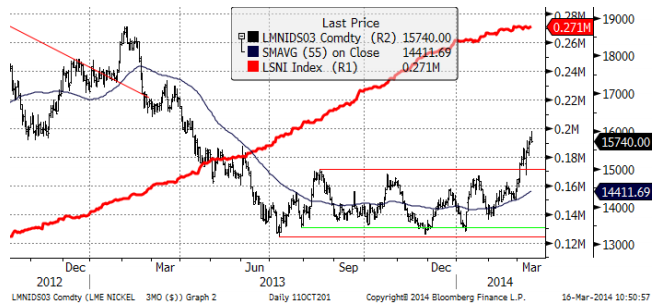
Nickel
Nickel har till skillnad från de andra basmetallerna stigit i veckan. Som vi skrivit tidigare gynnas nickelpriset av oron för Rysslands/Ukraina-krisen. Priset har dock kommit upp till 16,000 dollar och det är en motståndsnivå, där t ex marknaden fann en botten i slutet av år 2012. Vi rekommenderar därför att man går ur långa positioner nu och lägger sig neutral.
Guld
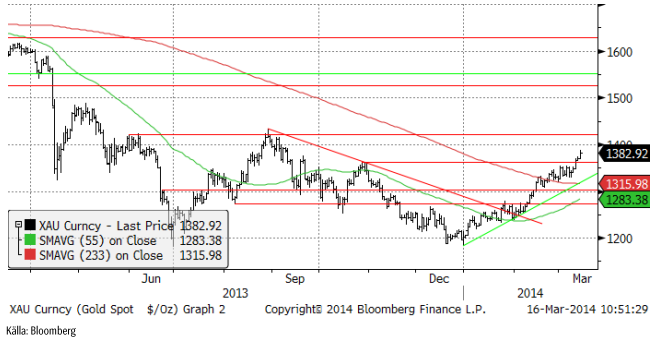
I takt med att tillväxten tvekar såväl i Kina som i USA leder det till ökade förväntningar på monetär stimulans i Kina och mindre avtrappning av den monetära stimulansen i USA. Sådana uttalanden har också kommit från FED, bland annat att takten på ”tapering” kan diskuteras. Konflikten mellan Ryssland och Ukraina och EU:s och USA:s kostnader för att handskas med detta bidrar också till att ge stöd till guldpriset. Oron för en extrem upptrappning av konflikten, även om den har liten sannolikhet påverkar också guldpriset positivt. Guldpriset är känsligt för ändringar i sannolikheten för extrema händelser av den karaktären.
Med det sagt, börjar ändå guldpriset nå upp till tekniska motstånd. Den första passerades utan större bekymmer i veckan, men den andra vid strax över 1400 dollar kan bli svårare.
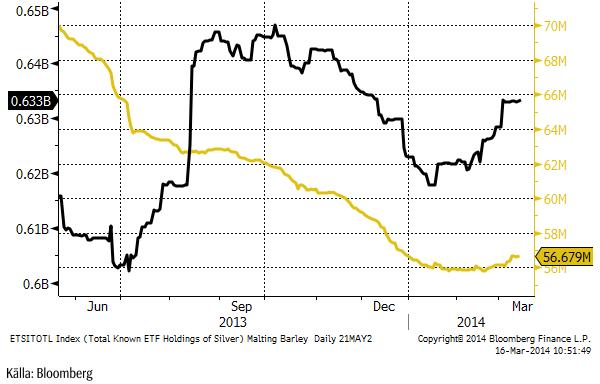
Nu har institutionella placerare börjat köpa guldfonder igen! Den gula kurvan visar antal miljoner uns som ägs via börshandlade fonder/certifikat/depåbevis. Innehaven i silver, den svarta kurvan, har ökat kraftigt sedan början av året, men förblivit oförändrad den senaste tiden.
Vi fortsätter tills vidare med neutral vy på guld. Vi skulle vilja köpa om det kommer en rekyl.
Silver
Silverpriset steg även det lite grand i veckan men befinner sig alltjämt mellan 20.50 och 22. Ett brott på uppsidan av 22 ger en teknisk köpsignal om den skulle inträffa. Det finns just nu ingen trend i silverpriset.
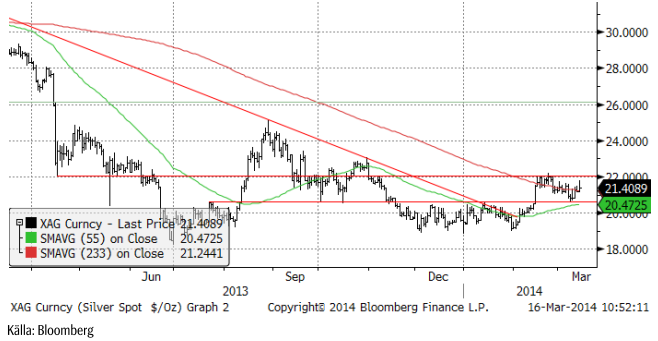
Nedan ser vi guldpriset angivet i silver (istället för dollar). Vi ser att guld är relativt dyrt i förhållande till silver, såväl i det korta perspektivet som i det långa. Vi föredrar därför att köpa silver, hellre än guld, men silverpriset ligger, som vi nämnde, fast under ett tekniskt motstånd på 22 dollar.
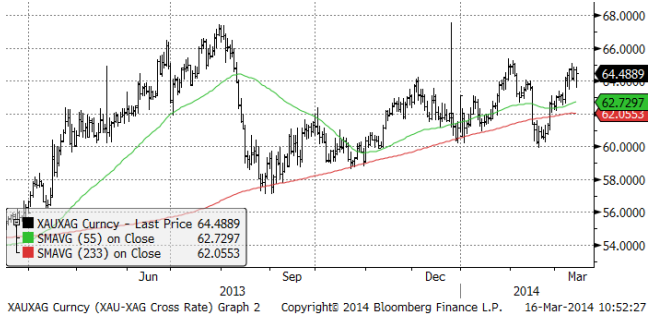
Vi anser att silver är mer köpvärt än guld och skulle vilja köpa på de här nivåerna, i synnerhet efter den rekyl som inträffat de senaste veckorna.
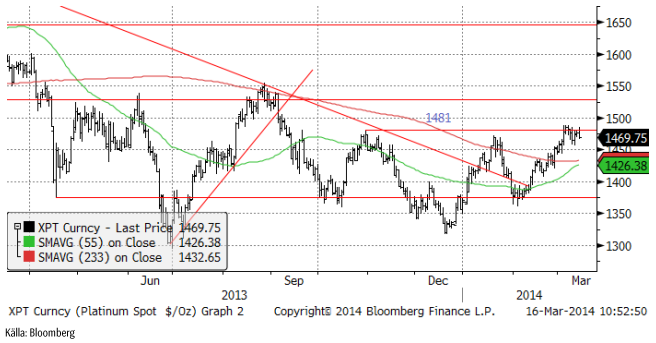
Platina & Palladium
Platina har problem att gå över det tekniska motståndet på 1481 dollar. Den senaste utvecklingen antyder att det finns en risk för en rekyl nedåt.
Palladiumpriset tog en paus efter utbrottet förra veckan. Det är ett vanligt marknadsbeteende och man kan dessutom då och då se en rekyl ner tillbaka till utbrottsnivån. Vi tror att palladiumpriset kan stå inför en större prisrörelse uppåt och väntar oss att se bekräftelser på det först genom att passera 785 dollar som var toppnoteringen under 2013.
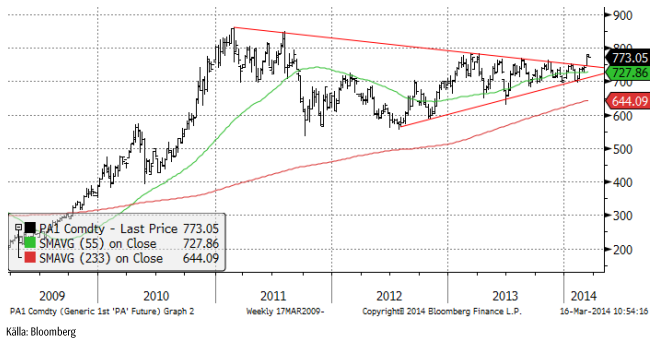
Vi rekommenderar alltså en neutral position i platina och en köpt position i palladium.
Kaffe
Torkan i Brasilien är av allt att döma slut. Det har regnat i veckan som gått. Prognosen från GFS-modellen för de kommande två veckorna visar onormalt mycket nederbörd över Minas Gerais. Allra mest väntas falla över den södra delen, där kaffeproduktionen är som mest intensiv.
Tekniskt noterar vi att priset har brutit stödet för den allra mest intensiva uppgången, vilket signalerar en förestående rekyl. Tekniskt stöd finns i första hand på ca 180 cent.
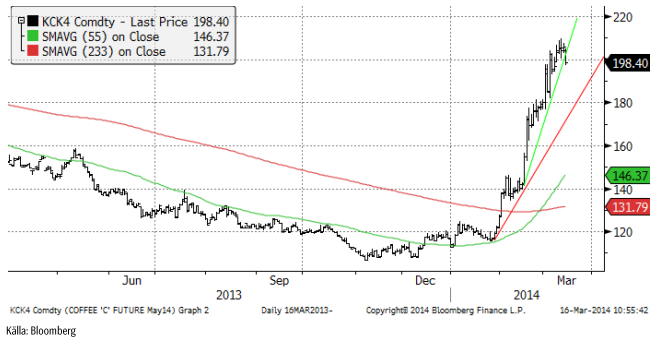
Vi rekommenderar neutral position i kaffe, eller möjligtvis en mycket kortsiktig kort position.
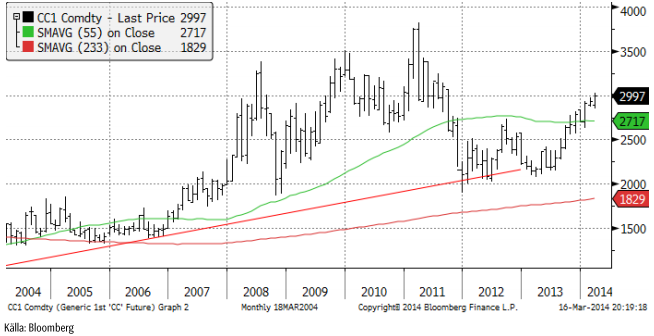
Kakao
Priset på kakao i New York har gått upp från 2709 dollar per ton till 2997 sedan årsskiftet, alltså plus 10%. Uppgången är framförallt driven av en stark efterfrågan. Som vi ser i diagrammet nedan är priset på kakao återigen uppe vid 3000 dollar per ton, som är den nivå som priserna pendlade kring vid slutet av 00-talets råvaruboom åren 2009 – 2011. Det är möjligt att priset kan gå högre, men uppgångens momentum bör mattas av på de nuvarande höga nivåerna.
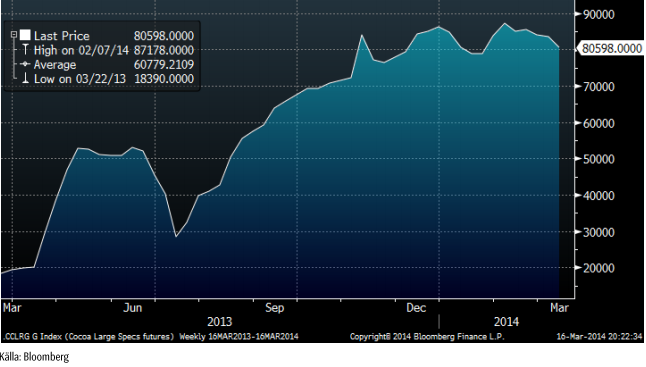
Kakaoterminsmarknaden präglas av en stor kort position i producentledet. Enligt fredagens Commitment of Traders – rapport från CFTC, som visar läget per i tisdags, var producenter korta över 90,000 kontrakt i det amerikanska kontraktet på kakao. Investerare var köpta 80,598 kontrakt. Investerarkategorin har börjat minska sin köpta position, som vi ser i diagrammet nedan. Alla tester visar att kausaliteten går från prisrörelse till agerande hos investerare och inte tvärt om, men bilden visar i vart fall att det positiva sentimentet hos aktörer som inte enbart är ute efter att bli av med risk, utan på att försöka förutspå prisutvecklingen, har blivit lite mindre positivt (även om de fortfarande är mycket positiva).
Kakaoterminerna på LIFFE i London handlas normalt sett högre än terminerna på NYBOT i New York. I diagrammet nedan har vi kvoten mellan London-kakao och New York-kakao, omräknat till brittiska pund per ton. Det är spotkontraktet vi ser.
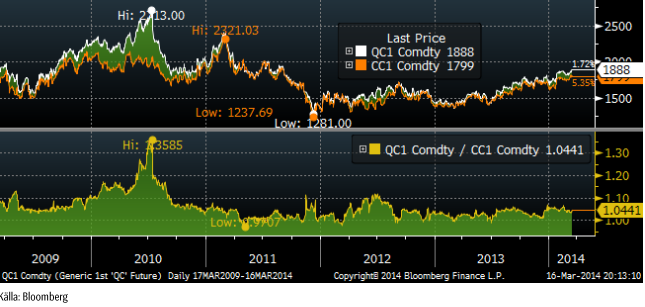
Öppen balans är ungefär lika stor för både LIFFE och NYBOT, men NYBOT har nästan hela sin handel frontmånadskontraktet, vilket återspeglar positioner från indexfonder, som har valt det kontraktet och inte London-kontraktet. Londonkontraktet har en mer spridd handel och används av företag i Europa för prissäkring. Vi ser också att det råder contango i NYBOT-kontraktet för korta löptider (kanske pga long-only-indexfonder) medan det är backwardation i London-kontraktet. Även kakao följer alltså samma mönster som t ex vete, där det råder contango i USA, men backwardation i Europa.
Vi rekommenderar en neutral position vid dagens situation.
[box]SEB Veckobrev Veckans råvarukommentar är producerat av SEB Merchant Banking och publiceras i samarbete och med tillstånd på Råvarumarknaden.se[/box]
Disclaimer
The information in this document has been compiled by SEB Merchant Banking, a division within Skandinaviska Enskilda Banken AB (publ) (“SEB”).
Opinions contained in this report represent the bank’s present opinion only and are subject to change without notice. All information contained in this report has been compiled in good faith from sources believed to be reliable. However, no representation or warranty, expressed or implied, is made with respect to the completeness or accuracy of its contents and the information is not to be relied upon as authoritative. Anyone considering taking actions based upon the content of this document is urged to base his or her investment decisions upon such investigations as he or she deems necessary. This document is being provided as information only, and no specific actions are being solicited as a result of it; to the extent permitted by law, no liability whatsoever is accepted for any direct or consequential loss arising from use of this document or its contents.
About SEB
SEB is a public company incorporated in Stockholm, Sweden, with limited liability. It is a participant at major Nordic and other European Regulated Markets and Multilateral Trading Facilities (as well as some non-European equivalent markets) for trading in financial instruments, such as markets operated by NASDAQ OMX, NYSE Euronext, London Stock Exchange, Deutsche Börse, Swiss Exchanges, Turquoise and Chi-X. SEB is authorized and regulated by Finansinspektionen in Sweden; it is authorized and subject to limited regulation by the Financial Services Authority for the conduct of designated investment business in the UK, and is subject to the provisions of relevant regulators in all other jurisdictions where SEB conducts operations. SEB Merchant Banking. All rights reserved.

Market is starting to take US/Iran headlines with a pinch of salt. Brent crude rose $2.8/b yesterday to an official close of $112.1/b. But after that it traded as low as $108.05/b before ending late night at around $109.7/b. Through the day it traded in a range of $106.87 – 112.72/b amid a flurry of news or rumors from Iran and the US. ”US temporary sanctions during negotiations” (falls alarm). ”We will bomb Iran” (not anyhow),… etc. While the market is still fluctuating to this kind of news flow, it is starting to take such headlines with a pinch of salt.

We’ll see. Maybe, maybe not. The Brent M1 contract is trading at $110.2/b this morning which very close to the average ticks through yesterday of $110.4/b.
Trump with bearish, verbal intervention whenever Brent trades above $110/b it seems. What seems to be a pattern is that Trump states something like ”very good negotiations going on with Iran”, ”New leaders in Iran are great,..”, ”Great progress in negotiations,…”, ”Deal in sight,..” etc whenever the Brent M1 contract trades above $110/b. An effort to cool the market. These hot air verbal interventions from Trump used to have a heavy bearish impact on prices, but they now seems to have less and less effect unless they are backed by reality.
As far as we can see there has been no real progress in the negotiations between the US and Iran with both sides still standing by their previous demands.
Iran is getting stronger while the cease fire lasts making a return to war for Trump yet harder. Iran is naturally in constant preparation for a return to war given Trump’s steady threats of bombing Iran again. Iran is naturally doing what ever is possible to prepare for a return to war. And every day the cease fire lasts it is better prepared. This naturally makes it more and more difficult and dangerous for the US to return to warring activity versus Iran as the consequences for energy infrastructure in the Persian Gulf will be more and more severe the longer the cease fire lasts. Israel seems to see it this way as well. That the war is not won and that current frozen state of a cease fire gives Iran opportunity to rebuild military and politically.
Global inventories are drawing down day by day. How much? In the meantime the Strait of Hormuz stays closed. There is varying measures and estimates of how much global inventories are drawing down. Our rough estimate, back of the envelope, is that global inventories are drawing down by at least some 10 mb/d or about 300 mb/d in a balance between loss of supply versus demand destruction. Other estimates we see are a monthly draw of 250-270 mb/d. The IEA only ’measured’ a draw in global observable stocks of 117 mb in April with oil on water rising 53 mb while on shore stocks fell 170 mb. But global stocks are hard to measure with large invisible, unmeasured stocks. As such a back of the envelope approach may be better.
Oil products is what the world is consuming. Oil product prices likely to rise while product stocks fall. Strategic Petroleum Reserves (SPR) are predominantly crude oil. Discharging oil from OECD SPR stocks, a sharp reduction in Chinese crude imports and a reduction in global refinery throughput of 6-7 mb/d has helped to keep crude oil markets satisfactorily supplied. But global inventories are drawing down none the less. And oil products is really what the world is consuming. So if global refinery throughput stays subdued, then demand will eventually have to match the supply of oil products. The likely path forward this summer is a steady draw down in jet fuel, diesel and gasoline. Higher prices for these. Then, if possible, higher refinery throughput and higher usage of crude in response to very profitable refinery margins. And lastly sharper draw in crude stocks and higher prices for these. But some 6 mb/d of oil products used to be exported through the Strait of Hormuz. And it may not be so easy to ramp up refinery activity across the world to compensate. Especially as Ukraine continues to damage Russian refineries as well as Russian crude production and export facilities.
Watch oil product stocks and prices as well as Brent calendar 2027. What to watch for this summer is thus oil product inventories falling and oil product premiums to crude rising. Another measure to watch is the Brent crude 2027 contract as it rises steadily day by day as the Strait of Hormuz stays closed and global oil inventories decline. The latter is close to the highest level since the start of the war and keeps rising.
The Brent M1 contract and the Brent 2027 prices and current price of jet fuel in Europe (ARA). All in USD/b

Our back of the envelope calculation of the global shortage created by the closure of the Strait of Hormuz. Note that 3.5 mb/d of discharge from SPR is also a draw. Note also that ’Forced demand loss’ of 2.5 mb/d is probably temporary and will fall back towards zero as logistics are sorted out leaving ’Price demand loss’ to do the job of balancing the market. Thus a shortfall of at least 9 mb/d created by the closure. More if SPR discharge is included and more if Forced demand loss recedes.

Brent is climbing higher. Front-month is at USD 106.3/bl this morning, close to a weekly high and a USD 9/bl jump from Mondays open. This is the move we flagged as a risk earlier in the week: the market shifting from ”a deal is around the corner” to ”this is going to take longer than we thought”.

Analyst Commodities, SEB
During April, rest-of-year Brent remained remarkably stable around USD 90/bl. A stability which rested on one single assumption: the SoH reopens around 1 May. That assumption is now slowly falling apart.
As we highlighted yesterday: every week of delay beyond 1 May adds (theoretically) ish USD 5/bl to the rest-of-year average, as global inventories draw 100 million barrels per week. i.e., a mid-May reopening implies rest-of-year Brent closer to USD 100/bl, and anything pushing into June or July takes us meaningfully higher.
What’s changed in the last 48 hours:
#1: The US military has formally warned that clearing suspected sea mines from SoH could take up to six months. That is a completely different timescale from what the financial market is pricing. Even a political deal tomorrow does not immediately reopen the strait.
#2: Trump has shifted his tone from urgency to ”strategic patience”. In yesterday’s press conference: ”Don’t rush me… I want a great deal.” The market is reading this as a president no longer feeling pressured by timelines, with the naval blockade running in the background.
#3: So far, the military activity is escalating, not de-escalating. Axios reports Iran is laying more mines in SoH. The US 3rd carrier strike group (USS George H.W. Bush) is arriving with two countermine vessels. Trump yesterday ordered the US Navy to destroy any Iranian boats caught laying mines. While CNN reports that the Pentagon is actively drawing up plans to strike Iranian SoH capabilities and individual Iranian military leaders if the ceasefire collapses. i.e., NOT a attitude consistent with an imminent deal!
Spot crude and product prices eased off the early-April highs on a combination of system rerouting and deal optimism. Both now weakening. Goldman estimates April Gulf output is reduced by 14.5 mbl/d, or 57% of pre-war supply, a number that keeps getting worse the longer this drags on.
Demand-side adaptation is ongoing: S. Korea has cut its Middle East crude dependence from 69% to 56% by pulling more from the Americas and Africa, and Japan is kicking off a second round of SPR releases from 1 May. But SPRs are finite.
Ref. to the negotiations, we should not bet on speed. The current Iranian leadership is dominated by genuine hardliners willing to absorb economic pain and run the clock to extract concessions. That is not a setup for a rapid resolution. US/Israeli media briefings keep framing the delay as ”internal Iranian divisions”, the reality is more complicated and points toward weeks and months, not days.
Our point is that the complexity is large, and higher prices have only just started (given a scenario where the negotiations drag out in time). The market spent April leaning on the USD 90/bl rest-of-year assumption; that case is diminishing by the hour. If ”early May reopening” is replaced by ”June, July or later” over the next week or two, both crude and products have meaningful room to reprice higher from here. There is a high risk being short energy and betting on any immediate political resolution(!).
Down on Friday. Up on Monday. The Brent June crude oil contract traded down 5.1% last week to a close of $90.38/b. It reached a high of $103.87/b last Monday and a low of $86.09/b on Friday as Iran announced that the Strait of Hormuz was fully open for transit. That quickly changed over the weekend as the US upheld its blockade of Iranian oil exports while Iran naturally responded by closing the SoH again. The US blew a hole in the engine room of the Iranian ship TOUSKA and took custody of the ship on Sunday. Brent crude is up 5.6% this morning to $95.4/b.
The cease-fire is expiring tomorrow. The US has said it will send a delegation for a second round of negotiations in Islamabad in Pakistan. But Iran has for now rejected a second round of talks as it views US demands as unrealistic and excessive while the US is also blocking the Strait of Hormuz.
While Brent is up 5% this morning, the financial market is still very optimistic that progress will be made. That talks will continue and that the SoH will fully open by the start of May which is consistent with a rest-of-year average Brent crude oil price of around $90/b with the market now trading that balance at around $88/b.
Financial optimism vs. physical deterioration. We have a divergence where the financial market is trading negotiations, improvements and resolution while at the same time the physical market is deteriorating day by day. Physical oil flows remain constrained by disrupted flows, longer voyage times and elevated freight and insurance costs.
Financial markets are betting that a US/Iranian resolution will save us in time from violent shortages down the road. But every day that the SoH remains closed is bringing us closer to a potentially very painful point of shortages and much higher prices.
The US blockade is also a weapon of leverage against its European and Asian allies. When Iran closed the SoH it held the world economy as a hostage against the US. The US blockade of the SoH is of course blocking Iranian oil exports. But it is also an action of disruption directed towards Europe and Asia. The US has called for the rest of the world to engaged in the war with Iran: ”If you want oil from the Persian Gulf, then go and get it”. A risk is that the US plays brinkmanship with the global oil market directed towards its European and Asian allies and maybe even towards China to force them to engage and take part. Maybe unthinkable. But unthinkable has become the norm with Trump in the White House.


Sommarväder skapar prisrally på elbörsen
Oil product price pain is set to rise as the Strait of Hormuz stays closed into summer

Solkraften pressar elpriserna dagtid

Michel Gubel ger sin syn på oljemarknaden