

Analys
SEB – Råvarukommentarer, 23 september 2013

Rekommendationer
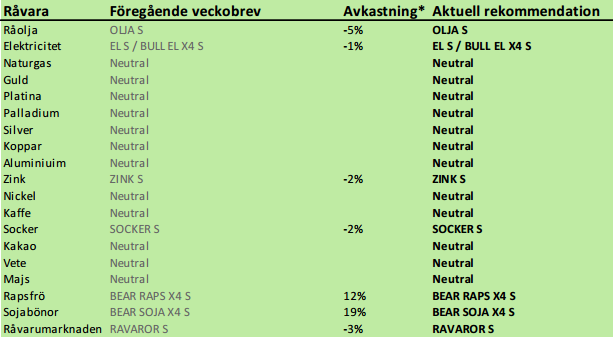
*) Avkastningen anges för 1:1 certifikaten där både BULL och 1:1 certifikat är angivna.
Inledning
Prisrörelserna förra veckan påverkades mycket av den amerikanska centralbanken. Först kom beskedet att det inte blir någon minskning i centralbankens (FED:s) köp av amerikanska obligationer, förrän tidigast år 2015. Anledningen är att man inte sett tillräcklig effekt på ekonomin än av de köp (och utbetalningar av pengar) som skett. Man kan fråga sig var de läst att sedelpressen någonsin skapat sysselsättning. Beslutet fick alla råvarumarknader att hoppa upp. Råvarulandet Brasliens aktiebörs blev den bästa av nästan 100 aktiebörser i världen, den dagen. I fredags gjorde så en medlem i FED ett uttalande som antydde att det ändå kan bli fråga om minskning i centralbankens återköp. Analytiker tolkade detta som en del i FED:s kommunikationsstrategi. Marknaderna föll abrupt på detta sent på fredagen. Jag ser dock detta inte som en medveten kommunikationsstrategi utan som ett tecken på oenighet i FED om fortsatt pengaproduktion är rätt väg. Det viktiga är dock att de som tycker att sedelpressen ska stå på är i majoritet och att dissidenterna är få. Vid det senaste FED-beslutet var det endast en person som var emot en förlängning till 2015. Kanske har marknaden kommit fram till samma slutsats under helgen. I så fall skulle priserna kunna gå upp i veckan som kommer.
Inga tekniska stödnivåer bröts i under fredagens prisfall – utom för sojabönor – men ”it had it coming”. Vår position i BEAR SOJA X4 S ökade i pris med 19% i veckan. Vi är fortsatt negativa till sojabönor och raps, men neutrala till spannmål och vi har köp på socker, samt köp på el och zink. Generellt sett är det, som en kollega i branschen uttryckte det i fredags, ett gyllene läge för råvaror som placering.
I torsdags var vi på Copenhagen Grain Exchange, som besöktes av rekordmånga från branschen. När man talade med folk var den allmänna bedömningen att priset på spannmål kommer att hålla sig stabilt på den här nivån åtminstone fram till våren. Det är i sig ett observandum, att man tror att volatiliteten kommer att vara låg och att priserna kommer att vara låga. Det finns inget som tyder på det, men skulle det komma nyheter som indikerar högre priser, finns ingen psykologisk förberedelse på detta.
Råolja – Brent
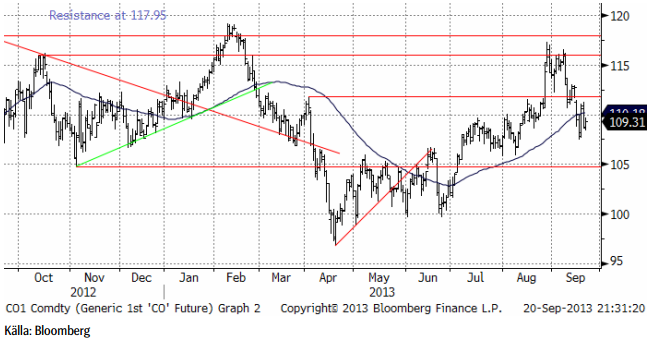
Oljepriset fortsatte att rekylera nedåt och gick även igenom den psykologiskt viktiga 110-dollarsnivån. Vi tycker att detta gör olja än mer köpvärt. Det är rabatten på terminerna som gör att vi vill vara investerade i olja.
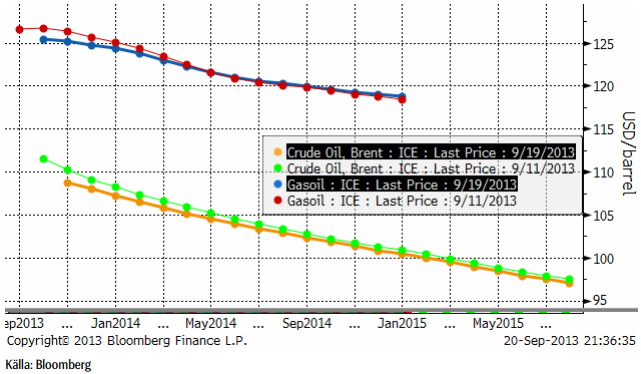
Terminskurvorna för Brent (den lägre) och gasolja (mer eller mindre detsamma som diesel) ligger något lägre jämfört med förra veckan. Men notera att medan terminskurvan för brent fallit för alla löptider, har kurvan för gasolja faktiskt vridit sig, så att de längre terminskontrakten ligger högre än förra veckan. Det är också väsentligt lägre grad av backwardation i gasoljekurvan än i oljekurvan. Man får bättre betalt för att vara investerad i olja än i gasolja.
Nedan ser vi hur 100 dollar i början av januari 2011 utvecklat sig om man investerat i fysisk råolja (svart linje) eller via terminer (grön linje). På grund av rabatten på terminerna, har mer än hälften av de ca 35% avkastning under dessa två år kommit från dem – och inte från prisförändring på fysisk råolja.
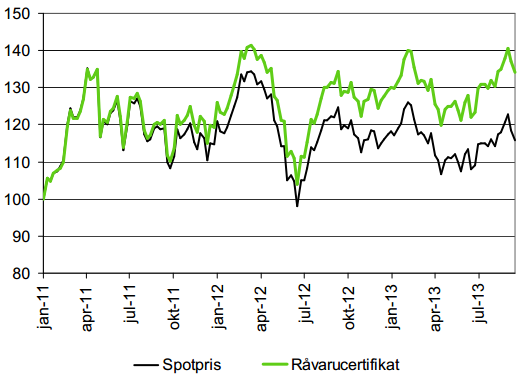
För råvaruinvesterare är den här rabatten nu väldigt attraktiv. Man kan tjäna ca 7 – 10% extra på att äga råoljeterminer.
När nu priset fallit tillbaka och rabatten på terminer är så attraktiv, tycker vi att det är ett bra tillfälle att komma in i den lönsamma oljemarknaden och rekommenderar köp av OLJA S. Det är framförallt rabatten på terminerna vi vill komma åt och därför föredrar vi OLJA S framför t ex BULL OLJA X4 S.
Elektricitet
Elpriset gick i veckan över motståndet på 42.35 och vi har nu en teknisk köpsignal på el. Vi skulle dock inte bli förvånade om det kom en rekyl nedåt, efter den snabba prisuppgång som varit. En sådan rekyl nedåt ser vi som ett utmärkt köptillfälle.
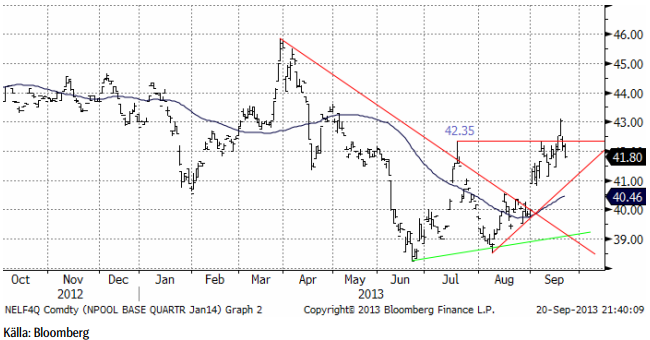
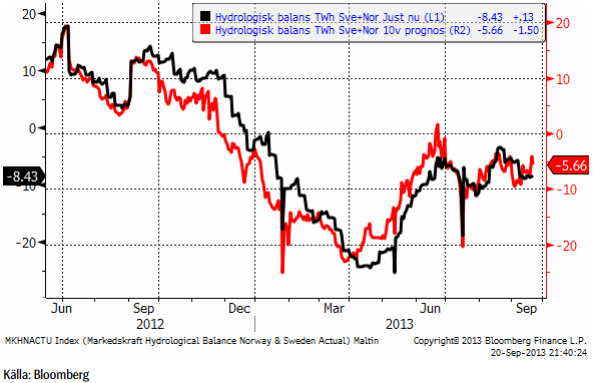
Hydrologisk balans visar inge större förändringar i veckan. 10-veckors-prognosen visar på ett marginellt mindre underskott än förra veckan.
Vi rekommenderar köp av el, t ex EL S eller BULL EL X4 S.
Naturgas
Naturgaspriset studsade var uppe vid 4 dollar, en nivå som tidigare varit ett motstånd.
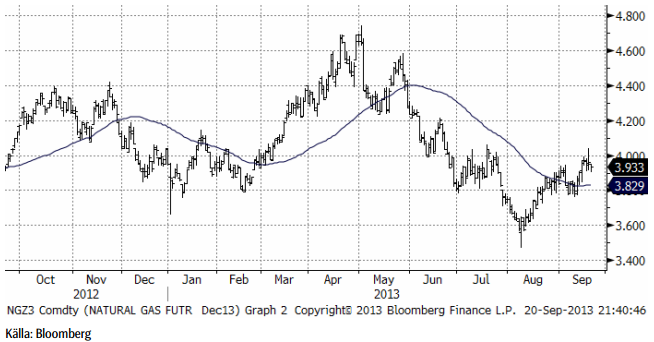
Vi har neutral rekommendation.
Guld & Silver
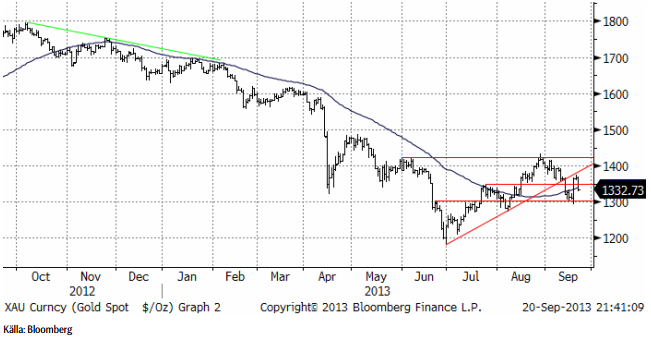
Guldpriset fann stöd på 1300 dollar och rusade uppåt på FED-beskedet om fortsatt penningpolitisk stimulans åtminstone till år 2015. Detta vände till panikförsäljning i fredags när marknaden tolkade uttalandet från St. Louis-FED:s chef som att det nog ändå kunde bli frågan om en minskning av obligationsköpen innan 2015. Den tekniska bilden indikerar att lägre pris är att vänta, men vi har ingen säljsignal än, bara en bruten uppgång.
Nedan ser vi kursdiagrammet för silver i dollar per troy ounce. Tekniskt ser marknaden faktiskt lite mer positiv ut än guld. Den fallande trenden är dock inte bruten och vi skulle inte vilja köpa så länge detta inte har skett.
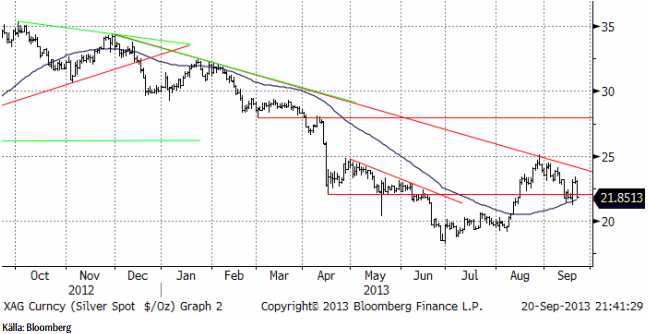
Vi fortsätter att vara neutrala guld och silver och skulle inte vilja köpa någon av dem idag.
Platina & Palladium
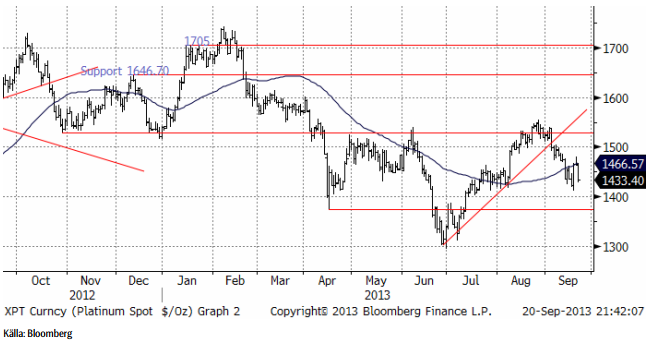
Prisuppgången i platina hindrades vid 55-dagars glidande medelvärde. Tekniskt ser platina svagare ut än både silver och guld. Det är många som hoppas på att platina och palladium ska gå bättre än guld och silver, därför att de också har ett industriellt invändningsområde i katalysatorer. Det innebär att det finns mycket förhoppningar investerat redan i metallerna och egentligen, en ganska stor nedsida.
Nedan ser vi frontmånadskontraktet på palladium. Palladium är en ganska illikvid metall och vi ser att priset steg kraftigt i veckan och sedan föll tillbaka.
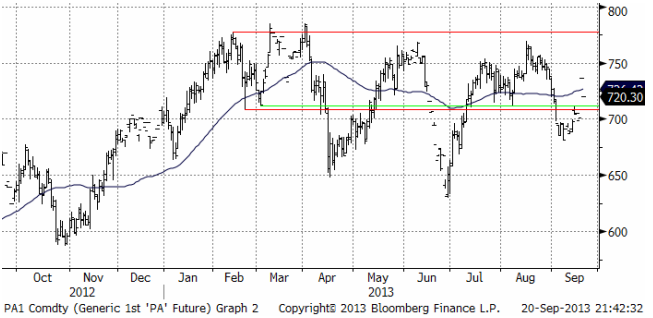
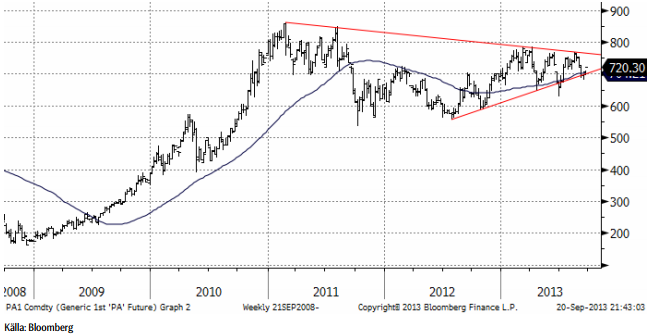
Palladiumpriset är tillbaka i den triangelformation vi talat om tidigare.
Vi är för närvarande neutrala platina och palladium, men om palladium skulle falla bara något lite ytterligare, skulle vi vilja haka på och ta en kort position via BEAR PALLAD X4 S. Vi skulle absolut inte vilja köpa någon av dem.
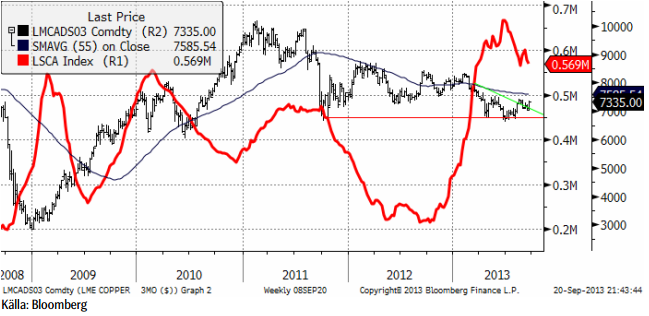
Koppar
Koppar var den basmetall som gick bäst i veckan med en uppgång på 2.5%, trots den generella svagheten på fredagen. Tekniskt bröts den kortsiktiga nedåttrenden i torsdags. SEB:s tekniska analytiker gjorde följande bedömning på fredagen: “Rechecking $+7,400 before down… There is some near-term momentum in the ongoing move higher, as it was able to gap through short-term resistance at ≈7,200 (now likely support). This behavior puts the Aug high of 7,420 in focus, but extension beyond this level should be restricted to the 233day moving average band (7,445\7,575)”.
Den fysiska marknaden rapporteras vara i någorlunda balans. Arbitraget mellan SHFE och LME fanns förra veckan (Shanghai 200 dollar högre). Lagren på LME har fallit ytterligare 2.2% i veckan.
Det ser positivt ut, men uppsidan är begränsad, enligt den tekniska analysen. Vi fortsätter därför att ha en neutral position.
Aluminium
Aluminiumprisets relativa svaghet var tydlig i veckan. Vi rekommenderar att man försöker köpa BEAR ALU X4 S på rekyler (uppåt).
Den oberoende analysfirman Wood Mackenzie publicerade en rapport i veckan som gick, som utmålade en mörk framtid för aluminiummarknaden de kommande åren. De förutspår ett överskott nästa år på 1.1 mt. Det är en rejäl ökning av överproduktionen om man jämför med årets 0.5 mt. Kina behöver stänga produktion på 1.6 mt för att regionen ska komma i balans, enligt rapporten. Det råder samstämmighet bland bedömare att marknaden behöver stora produktionsneddragningar. Den här rapporten pekar på att detta kan ta längre tid än de flesta hoppats.
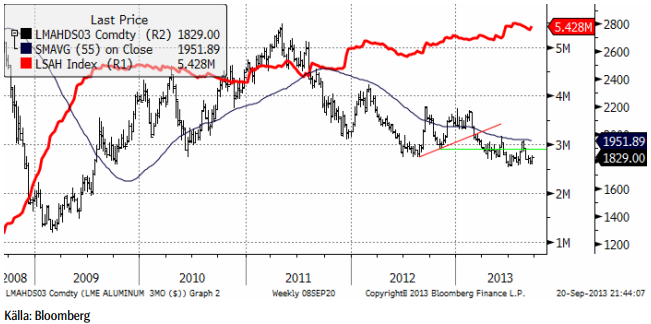
Vi har neutral rekommendation, men tycker man ska försöka komma in i BEAR ALU X4 S på rekyler uppåt.
Zink
Som vi har noterat tidigare, håller zink-balansen (utbud/efterfrågan) på att förbättras. ILZG rapporterade siffrorna för juli och de visade ett litet överskott. Produktionen av raffinerad zink var 1.109 mt i juli och efterfrågan var 1.095. Detta tog bort optimismen och gav baissarna ammunition. Men faktum är att trenden går mot ett underskott. Det tar naturligtvis tid att beta av de uppkomna lagren, men det ligger i priserna. De flesta som följer marknaden är överens om att gruvkapacitet kommer att stängas nästa år, och att ny kapacitet inte kommer att kompensera detta. Det finns en stor möjlighet till stora underskott framöver. Detta kommer att ge marknaden stöd enligt vårt sätt att se. Samtidigt verkar ekonomierna i Kina, USA och Europa ta fart och den effekten på underskottet måste också beaktas.
Zink blev en besvikelse den här veckan efter den oväntade svagheten i fredags och stängde ner 0.5% på veckan.
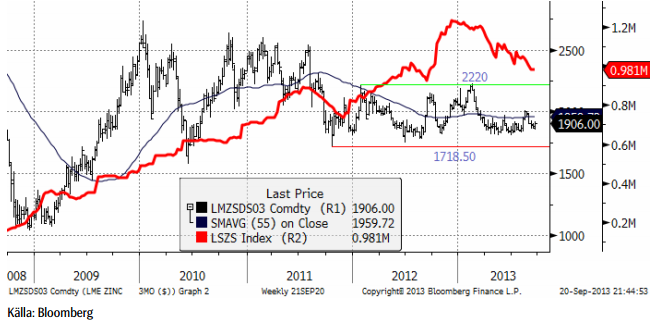
Vi fortsätter med en försiktig köprekommendation, av ZINK S.
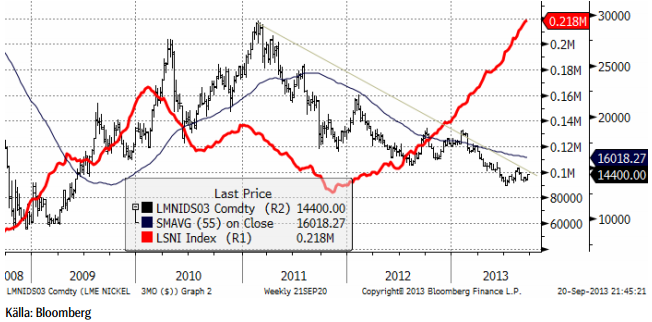
Nickel
Nickel är traditionellt den mest volatila av metallerna som handlas på LME och den levde upp till sitt rykte den här veckan. FEDbeskedet fick priset att stiga från 13900 dollar till 14400. Detta vändes sedan i dramatiskt prisfall på fredagskvällen och veckan stängde bara precis över 14000 dollar. De stora och stigande lager hänger hotfullt över marknaden, men vi märker av mer intressen att köpa metallen från industrin. Med tanke på vad den tekniska analysen säger, tror vi det finns möjligheter för priset att nå 15000 dollar inom överskådlig tid. Nyhetsflödet kring Indonesiens export av järnmalm med nickelinnehåll för tillverkning av Nickel Pig Iron i Kina kommer att spela en central roll och vara en källa till volatilitet i marknaden.
Kaffe
Den fallande trenden i kaffepriset tog ett nytt trappsteg ner i veckan som gick. Den här nedgången är den längsta i tid sedan 1993.
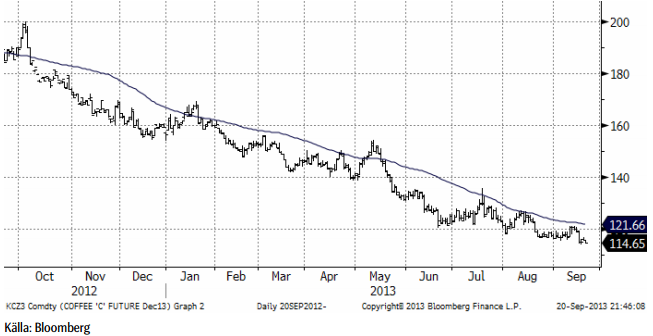
Regn i Brasilien har fått kaffeträden att sätta blomknoppar för en andra blomning. Dessa blommor kommer sedan att bli bönor. Den kommande skörden är den växelvis större. Den skörd som just bärgats var ett mellanår. Arabica är en varannanårsgröda.
Brasilianska bönor av ”good cup” kvalitet (även kallad ”Swedish quality”, faktiskt) handlades till 18 till 21 cents rabatt till noteringen på ICE i New York. ”Fine cup” kvalitet handlas till en rabatt på 13 cent enligt företaget Flavour Coffee i Rio de Janeiro.
Flavour Coffee rapporterade också att Conillons, som den brasilianska robustan kallas, handlas till 8 cents premium över LIFFE:s terminspris i London, en uppgång från förra veckans premium på 5 cent. Det fanns även vissa kvaliteter av robusta som var dyrare än arabica. Robusta odlas mest i Afrika och i Asien, där Vietnam har blivit den största producenten. Robusta används mest i snabbkaffe.
Brasilien kommer att bärga en rekordskörd, av allt att döma och globala lager ökade med över 7% i augusti enligt tradinghuset FC Stone.
Vi behåller tills vidare neutral rekommendation, tills vi ser tecken på ett trendbrott.
Fler analyser på jordbruksråvaror från SEB.
[box]SEB Veckobrev Veckans råvarukommentar är producerat av SEB Merchant Banking och publiceras i samarbete och med tillstånd på Råvarumarknaden.se[/box]
Disclaimer
The information in this document has been compiled by SEB Merchant Banking, a division within Skandinaviska Enskilda Banken AB (publ) (“SEB”).
Opinions contained in this report represent the bank’s present opinion only and are subject to change without notice. All information contained in this report has been compiled in good faith from sources believed to be reliable. However, no representation or warranty, expressed or implied, is made with respect to the completeness or accuracy of its contents and the information is not to be relied upon as authoritative. Anyone considering taking actions based upon the content of this document is urged to base his or her investment decisions upon such investigations as he or she deems necessary. This document is being provided as information only, and no specific actions are being solicited as a result of it; to the extent permitted by law, no liability whatsoever is accepted for any direct or consequential loss arising from use of this document or its contents.
About SEB
SEB is a public company incorporated in Stockholm, Sweden, with limited liability. It is a participant at major Nordic and other European Regulated Markets and Multilateral Trading Facilities (as well as some non-European equivalent markets) for trading in financial instruments, such as markets operated by NASDAQ OMX, NYSE Euronext, London Stock Exchange, Deutsche Börse, Swiss Exchanges, Turquoise and Chi-X. SEB is authorized and regulated by Finansinspektionen in Sweden; it is authorized and subject to limited regulation by the Financial Services Authority for the conduct of designated investment business in the UK, and is subject to the provisions of relevant regulators in all other jurisdictions where SEB conducts operations. SEB Merchant Banking. All rights reserved.

Brent is climbing higher. Front-month is at USD 106.3/bl this morning, close to a weekly high and a USD 9/bl jump from Mondays open. This is the move we flagged as a risk earlier in the week: the market shifting from ”a deal is around the corner” to ”this is going to take longer than we thought”.

Analyst Commodities, SEB
During April, rest-of-year Brent remained remarkably stable around USD 90/bl. A stability which rested on one single assumption: the SoH reopens around 1 May. That assumption is now slowly falling apart.
As we highlighted yesterday: every week of delay beyond 1 May adds (theoretically) ish USD 5/bl to the rest-of-year average, as global inventories draw 100 million barrels per week. i.e., a mid-May reopening implies rest-of-year Brent closer to USD 100/bl, and anything pushing into June or July takes us meaningfully higher.
What’s changed in the last 48 hours:
#1: The US military has formally warned that clearing suspected sea mines from SoH could take up to six months. That is a completely different timescale from what the financial market is pricing. Even a political deal tomorrow does not immediately reopen the strait.
#2: Trump has shifted his tone from urgency to ”strategic patience”. In yesterday’s press conference: ”Don’t rush me… I want a great deal.” The market is reading this as a president no longer feeling pressured by timelines, with the naval blockade running in the background.
#3: So far, the military activity is escalating, not de-escalating. Axios reports Iran is laying more mines in SoH. The US 3rd carrier strike group (USS George H.W. Bush) is arriving with two countermine vessels. Trump yesterday ordered the US Navy to destroy any Iranian boats caught laying mines. While CNN reports that the Pentagon is actively drawing up plans to strike Iranian SoH capabilities and individual Iranian military leaders if the ceasefire collapses. i.e., NOT a attitude consistent with an imminent deal!
Spot crude and product prices eased off the early-April highs on a combination of system rerouting and deal optimism. Both now weakening. Goldman estimates April Gulf output is reduced by 14.5 mbl/d, or 57% of pre-war supply, a number that keeps getting worse the longer this drags on.
Demand-side adaptation is ongoing: S. Korea has cut its Middle East crude dependence from 69% to 56% by pulling more from the Americas and Africa, and Japan is kicking off a second round of SPR releases from 1 May. But SPRs are finite.
Ref. to the negotiations, we should not bet on speed. The current Iranian leadership is dominated by genuine hardliners willing to absorb economic pain and run the clock to extract concessions. That is not a setup for a rapid resolution. US/Israeli media briefings keep framing the delay as ”internal Iranian divisions”, the reality is more complicated and points toward weeks and months, not days.
Our point is that the complexity is large, and higher prices have only just started (given a scenario where the negotiations drag out in time). The market spent April leaning on the USD 90/bl rest-of-year assumption; that case is diminishing by the hour. If ”early May reopening” is replaced by ”June, July or later” over the next week or two, both crude and products have meaningful room to reprice higher from here. There is a high risk being short energy and betting on any immediate political resolution(!).
Down on Friday. Up on Monday. The Brent June crude oil contract traded down 5.1% last week to a close of $90.38/b. It reached a high of $103.87/b last Monday and a low of $86.09/b on Friday as Iran announced that the Strait of Hormuz was fully open for transit. That quickly changed over the weekend as the US upheld its blockade of Iranian oil exports while Iran naturally responded by closing the SoH again. The US blew a hole in the engine room of the Iranian ship TOUSKA and took custody of the ship on Sunday. Brent crude is up 5.6% this morning to $95.4/b.

The cease-fire is expiring tomorrow. The US has said it will send a delegation for a second round of negotiations in Islamabad in Pakistan. But Iran has for now rejected a second round of talks as it views US demands as unrealistic and excessive while the US is also blocking the Strait of Hormuz.
While Brent is up 5% this morning, the financial market is still very optimistic that progress will be made. That talks will continue and that the SoH will fully open by the start of May which is consistent with a rest-of-year average Brent crude oil price of around $90/b with the market now trading that balance at around $88/b.
Financial optimism vs. physical deterioration. We have a divergence where the financial market is trading negotiations, improvements and resolution while at the same time the physical market is deteriorating day by day. Physical oil flows remain constrained by disrupted flows, longer voyage times and elevated freight and insurance costs.
Financial markets are betting that a US/Iranian resolution will save us in time from violent shortages down the road. But every day that the SoH remains closed is bringing us closer to a potentially very painful point of shortages and much higher prices.
The US blockade is also a weapon of leverage against its European and Asian allies. When Iran closed the SoH it held the world economy as a hostage against the US. The US blockade of the SoH is of course blocking Iranian oil exports. But it is also an action of disruption directed towards Europe and Asia. The US has called for the rest of the world to engaged in the war with Iran: ”If you want oil from the Persian Gulf, then go and get it”. A risk is that the US plays brinkmanship with the global oil market directed towards its European and Asian allies and maybe even towards China to force them to engage and take part. Maybe unthinkable. But unthinkable has become the norm with Trump in the White House.
Wild moves yesterday. Brent crude traded to a high of $114.43/b and a low of $96.0/b and closed at $99.94/b yesterday.
US – Iran negotiations ongoing or not? What a day. Donald Trump announced that good talks were ongoing between Iran and the US and that the 48 hour deadline before bombing Iranian power plants and energy infrastructure was postponed by five days subject to success of ongoing meetings. Iranian media meanwhile stated that no meetings were ongoing at all.
Today we are scratching our heads trying to figure out what yesterday was all about.
Friends and family playing the market? Was it just Trump and his friends and family who were playing with oil and equity markets with $580m and $1.46bn in bets being placed by someone in oil and equity markets just 15 minutes before Trump’s announcement?
Was Trump pulling a TACO as he reached his political and economic pain point: Brent at $112/b, US Gas at $4/gal, SPX below 200dma and US 10yr above 4.4%?
Different Iranian factions with Trump talking with one of them? Are there real negotiations going on but with the US talking to one faction in Iran while another, the hardliners, are not involved and are denying any such negotiations going on?
Extending the ultimatum to attack and invade Kharg island next weekend? Or, is the five day delay of the deadline a tactical decision to allow US amphibious assault ships and marines to arrive in the Gulf in the upcoming weekend while US and Israeli continues to degrade Iranian military targets till then. And then next weekend a move by the US/Israel to attack and conquer for example the Kharg island?
We do not really know which it is or maybe a combination of these.
We did get some kind of TACO ydy. But markets have been waiting for some kind of TACO to happen and yesterday we got some kind of TACO. And Brent crude is now trading at $101.5/b as a result rather than at $112-114/b as it did no the high yesterday.
But what really matters in our view is the political situation on the ground in Iran. Will hardliners continue to hold power or will a more pragmatic faction gain power?
If the hardliners remain in power then oil pain should extend all the way to US midterm elections. The hardliners were apparently still in charge as of last week. Iran immediately retaliated and damaged LNG infrastructure in Qatar after Israel hit Iranian South Pars. The SoH was still closed and all messages coming out of Iran indicated defiance. Hardliners continues in power has a huge consequence for oil prices going forward. The regime has played its ’oil-weapon’ (closing or chocking the Strait of Hormuz). It is using it to achieve political goals. Deterrence: it needs to be so politically and economically expensive to attack Iran that it won’t happen again in the future. Or at least that the US/Israel thinks 10-times over before they attack again. The highest Brent crude oil closing price since the start of the war is $112.19/b last Friday. In comparison the 20-year inflation adjusted Brent price is $103/b. So Brent crude last Friday at $112.19/b isn’t a shockingly high price. And it is still far below the nominal high of $148/b from 2008 which is $220/b if inflation adjusted. So once in a lifetime Iran activates its most powerful weapon. The oil weapon. It needs to show the power of this weapon and it needs to reap political gains. Getting Brent to $112/b and intraday high of $119.5/b (9 March) isn’t a display of the power of that weapon. And it is not a deterrence against future attacks.
So if the hardliners remain in power in Iran, then the SoH will likely remain chocked all the way to US midterm elections and Brent crude will at a minimum go above the historical nominal high of $148/b from 2008.
Thus the outlook for the oil price for the rest of the year doesn’t depend all that much of whether Trump pulls a TACO or not. Stops bombing or not. It depends more on who is in charge in Iran. If it is the hardliners, then deterrence against future attacks via chocking of the SoH and high oil prices is the likely line of action. It is impacting the world but the Iranian ’oil-weapon’ is directed towards the US president and the the US midterm elections.
If a pragmatic faction gets to power in Iran, then a very prosperous future is possible. However, if power is shifting towards a more pragmatic faction in Iran then a completely different direction could evolve. Such a faction could possibly be open for cooperation with the US and the GCC and possibly put its issues versus Israel aside. Then the prosperity we have seen evolving in Dubai could be a possible future also for Iran.
So far it looks like the hardliners are fully in charge. As far as we can see, the hardliners are still fully in control in Iran. That points towards continued chocking of the SoH and oil prices ticking higher as global inventories (the oil market buffers) are drawn lower. And not just for a few more weeks, but possibly all the way to the US midterm elections.


Solkraften pressar elpriserna dagtid

Michel Gubel ger sin syn på oljemarknaden

Svag vårflod dubblar elpriserna
Brent crude up USD 9/bl on the week… ”deal around the corner” narrative fades
Market Still Betting on Timely Resolution, But Each Day Raises Shortage Risk
Market Still Betting on Timely Resolution, But Each Day Raises Shortage Risk
Brent crude up USD 9/bl on the week… ”deal around the corner” narrative fades
Michel Gubel ger sin syn på oljemarknaden
Solkraften pressar elpriserna dagtid
Svag vårflod dubblar elpriserna
-
Analys3 veckor sedan
Market Still Betting on Timely Resolution, But Each Day Raises Shortage Risk
-
Analys3 veckor sedan
Brent crude up USD 9/bl on the week… ”deal around the corner” narrative fades
-
 Nyheter2 veckor sedan
Michel Gubel ger sin syn på oljemarknaden
-
 Nyheter2 veckor sedan
Solkraften pressar elpriserna dagtid
-
Nyheter2 veckor sedan
Svag vårflod dubblar elpriserna