

Analys
SEB – Råvarukommentarer, 27 maj 2013

Rekommendationer
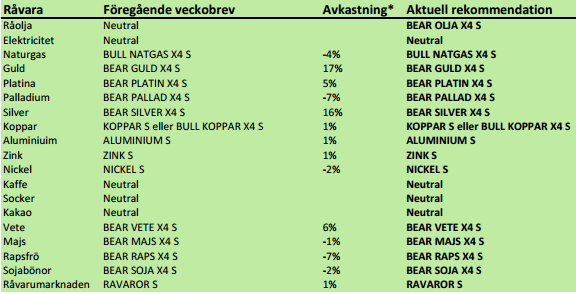
*) Avkastningen avser 1:1 råvarucertifikat där de ingår i rekommendationen. I den aktuella tabellen ovan har jag tagit prisförändringen den senaste veckan sedan det förra veckobrevet publicerades.
Inledning
Inköpschefsindex kom in på sin svagaste nivå på 7 månader och i stort sett alla råvarumarknader präglas av långsiktigt fallande trender. En produktion som kommer ikapp efterfrågan med lagerökningar som följd syns tydligast på spannmålsmarknaden, men samma sak kan anas även på andra marknader, t ex för basmetaller, där lagren varit stigande länge. Vissa marknader har dock fallit under lång tid, och börjar närma sig vad jag tror är bottennivåer. Dit hör t ex kaffe, socker och guld och amerikansk naturgas.
Råolja – Brent
Oljan var har under april och maj rekylerat uppåt och i slutet av förra veckan brutit detta mönster och handlat lägre. Det är en teknisk säljsignal och vi rekommenderar köp av BEAR OLJA X4 S.
Lagren och lagerförändringarna i USA den senaste rapportveckan (som slutade den 10 maj) ser vi nedan, enligt Department of Energy och American Petroleum Institute.
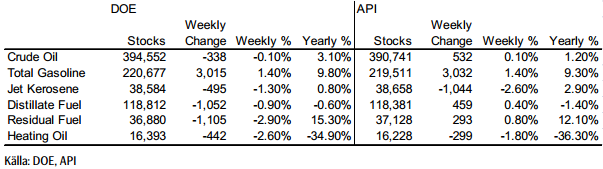
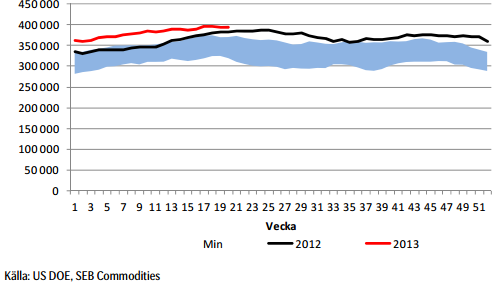
Nedan ser vi amerikanska råoljelager enligt DOE i tusen fat. Den svarta kurvan är 2012 års lagernivåer vecka för vecka och den lilla röda linjen är 2013 års nivå.
Importen fortsätter att hålla sig under förra årets nivå. En liten ökning av importen noterades i den senaste rapporten.
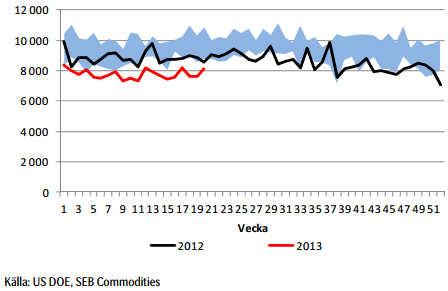
Slutsatsen är alltså att vi tror att oljepriset faller från den här punkten.
Elektricitet
Elen har konsoliderat sig över 35 euro per MWh. Eftersom inget brott åt något håll har skett ligger vi kvar, men följer på i den riktning som utbrottet sker.
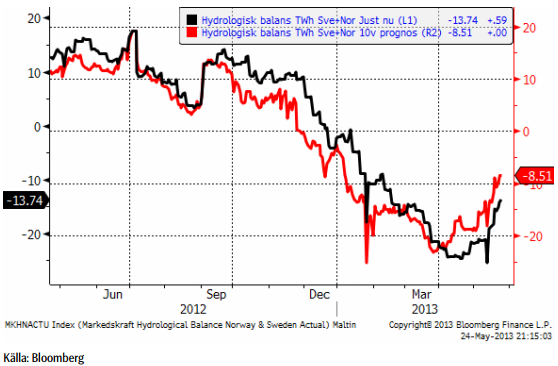
Hydrologisk balans har fortsatt att stiga från -11.93 till -8.51 i tioveckorsprognosen.
Eftersom priset trots allt kommit ner ganska långt, väljer vi att fortsätta med neutral position.
Naturgas
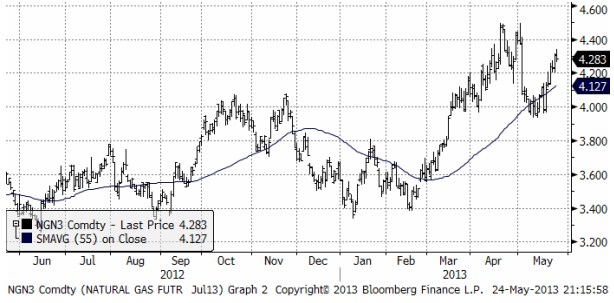
Naturgasen vände upp och är i stadig trend nu. Därför rekommenderas en köpt position, t ex genom BULL NATGAS X4 S.
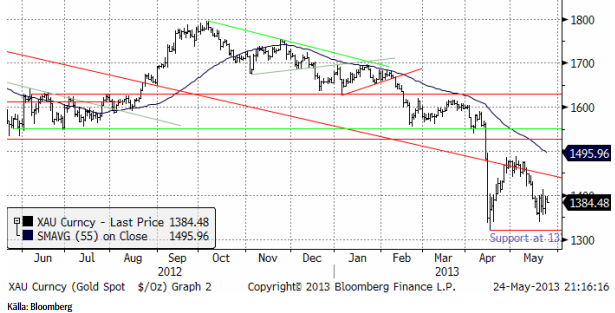
Guld & Silver
Guldpriset var nere och ”nästan” rörde vid botten från prisfallet i april. Det är ett styrketecken för marknaden att det inte registrerades en ny botten. Trenden är dock fortfarande nedåtriktad och det ”borde” bli en förnyad nedgång mot 1300 i veckan som kommer.
ETF-investerare har fortsatt att likvidera sina innehav i guld, som vi ser i diagrammet nedan.
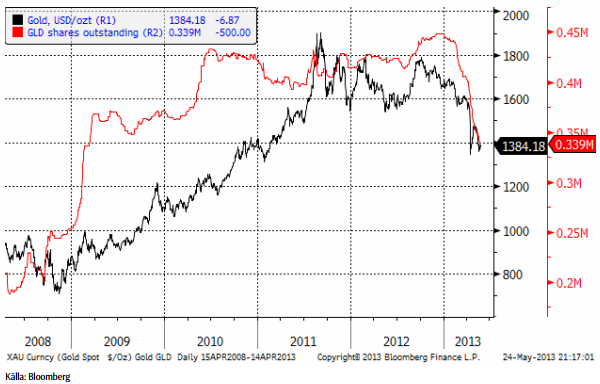
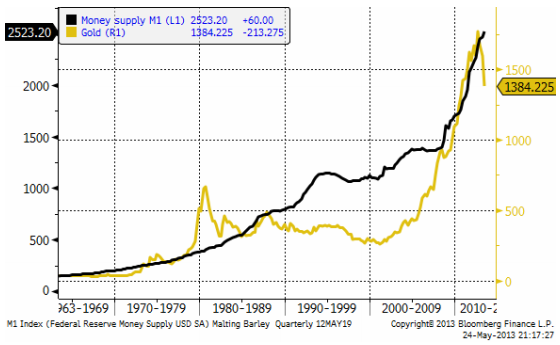
Vad som kan ha utlöst försäljningarna var ”hacket” i kurvan på penningmängden i USA. Samtidigt började FED tala om ett slut på QE. Men som vi ser i grafen nedan, har M1 fortsatt att öka i USA. Man fick kalla fötter hos FED och fortsatte trycka pengar. Det gör att det byggs upp ett latent stöd för guldpriset, bara kursfallet tar slut.
Nedan ser vi kursdiagrammet för silver i dollar per troy ounce. Stödet på 22 dollar håller än så länge. Bryts den nivån finns inget förrän vid 20 dollar, 10% längre ner. Silverpriset var nere och rörde nästan vid 20 och frågan är om det räcker så, eller om priset kommer att gå ner och testa stödet ordentligt.
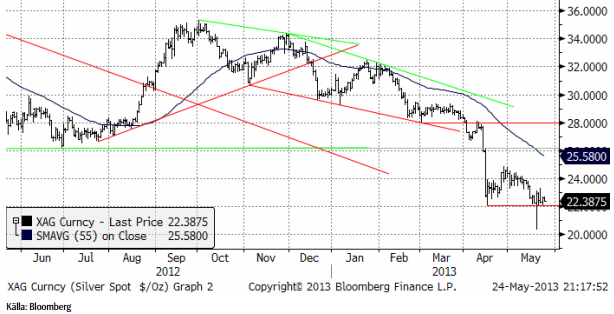
Jag tror att silverpriset kan gå lite lägre från dagens nivå, Trenden är nedåtriktad.
Vi ligger korta guld och silver. Jag tror att det kommer en till vända ner och ligger självklart kvar med köpt position i BEAR GULD X4 S och BEAR SILVER X4 S.
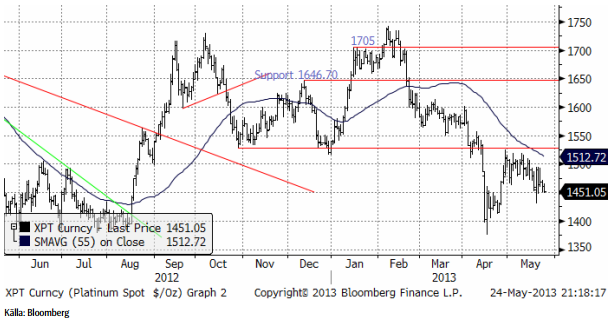
Platina & Palladium
Platina började veckan med att rekylera upp från 1450, men trenden (nedåt) tog över och vid slutet av veckan var priset återigen nere vid 1450. Den här nivån var toppen på konsolideringen efter det kraftiga prisfallet i mitten av april och därför ett visst tekniskt stöd. Marknaden står nu och väger. Antingen får vi se en trendvändning uppåt, eller så fortsätter priset i den fallande pristrenden.
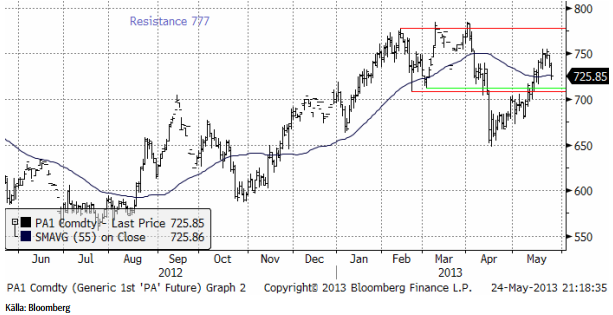
Palladium vände ner vid 750 dollar. Som jag skrev förra veckan, skulle 750 vara en lockande nivå för säljare att lägga sina ordrar. Priset har nu rekylerat ner och det mesta tyder på att prisfallet fortsätter, åtminstone ner mot 710 dollar.
Vi ligger kvar såld både platina och palladium, dvs med BEAR PLATNA X4 S och BEAR PALLAD X4 S.
Basmetaller
Fokus i veckan låg på onsdagens kongressutfrågning av Bernanke´s. Priserna inledde veckan positivt med köp från finansiella aktörer på förväntan om indikationer på en långvarig penningpolitisk stimulans från FED. Turbulensen ökad inför, och under talet. När han fick frågan om tidsaspekten, med svaret att det kan vara aktuellt med ett tillbakadragande de 2-3 nästkommande mötena, började börser och råvaror att falla tillbaka. Kinas PMI kom in svagare (49,6 mot 50,4 månaden före) natten till torsdagen, vilket satte förnyad press. Veckan avslutas i stort sett där den började, med endast marginellt högre priser.
Koppar
Som vi skrivit tidigare har vi haft kopparn under bevakning för att gå från neutral till köp. Tekniskt sett bedömde vi förutsättningarna som goda för en kortsiktig uppgång. Veckan inleddes som väntat starkt med en uppgång till nivåer strax över $7500, upp 3 % på veckan. Kinas PMI dämpade riskaptiten och priset föll ungefär lika mycket dagen efter. Trots tveksamhet under veckan, ser vi tecken på att det negativa stämningsläget kring koppar håller på att svänga om.
Tekniskt sett fokuserar vi på ”dubbelbotten” från april och maj, som ger en potentiell uppgång till $7620, där motståndet sätter in. Nästa nivå är $7800. Den omedelbara pressen på koppar verkar vara över och den nedåtgående trenden är bruten. Den generella trenden får betraktas som mer sidledes för koppar.
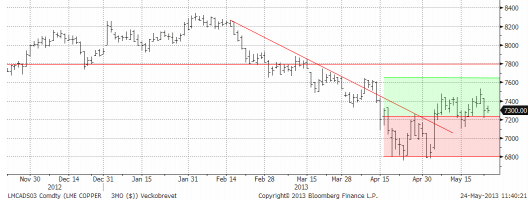
Vi förväntar oss fortsatt hög volatilitet. Vår kortsiktiga bedömning talar för uppsidan och vi rekommenderar därför köp av BULL KOPPAR X2 S eller X4 S.
Aluminium
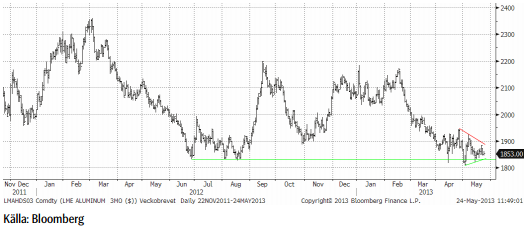
Priset har nu ”testat” stödnivåerna vid $1810-20 vid tre tillfällen, och lyckats studsa upp. Det är ett styrketecken. Vi ser fysiska aktörer som går in och täcker in framtida konsumtion via terminsköp vid varje dipp. Tekniskt orienterade fonder säljer vid varje uppställ. Trenden blir därefter, det rör sig sidledes. Vi ser tecken på att marknaden håller på att bottna ur. Högkostnadsproducenterna, framför allt i Kina, förväntas minska utbudet (ännu mer) om priset långvarigt stannar på nuvarande nivåer.
Långsiktigt är nivån väldigt intressant för kontraktet Aluminium S (utan hävstång).
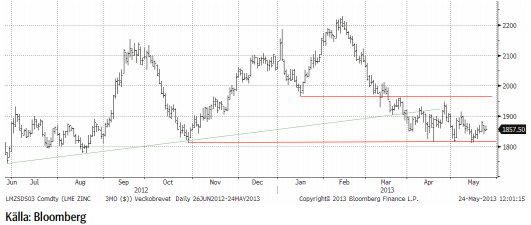
Zink
Situationen för zink påminner om den för aluminium, både fundamentalt och tekniskt. Vi bedömer zinken som ”billig” ur ett kostnadsperspektiv och nuvarande nivåer är mycket intressanta på lite längre sikt (6-12 månader). I det perspektivet är Zink S (utan hävstång) att föredra.
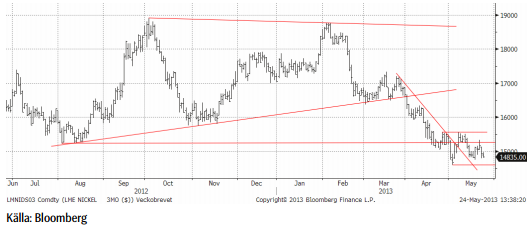
Nickel
Nickel följde övriga basmetaller under veckan, upp ca 3 % i mitten av veckan, och sen ner igen. Förutom det makroekonomiska nyhetsflödet är det inte mycket som har förändrats sen förra veckan.
Ur ett tekniskt perspektiv gäller att nivån från i början av månaden $14600 håller, för att undvika en test av lägre nivåer. Det finansiella kollektivet är redan väldigt ”korta” och frågan är hur mycket mer kraft det finns för att pressa priset ytterligare. Det byggs upp ett stort behov av att köpa tillbaka kortpositioner, vilket i sig kan skapa kraftiga rekyler på uppsidan. Vi bedömer nickel som ”billig” ur ett kostnadsperspektiv och nuvarande nivåer är mycket intressanta på lite längre sikt (6-12 månader). I det perspektivet är Nickel S (utan hävstång) att föredra.
[box]SEB Veckobrev Veckans råvarukommentar är producerat av SEB Merchant Banking och publiceras i samarbete och med tillstånd på Råvarumarknaden.se[/box]
Disclaimer
The information in this document has been compiled by SEB Merchant Banking, a division within Skandinaviska Enskilda Banken AB (publ) (“SEB”).
Opinions contained in this report represent the bank’s present opinion only and are subject to change without notice. All information contained in this report has been compiled in good faith from sources believed to be reliable. However, no representation or warranty, expressed or implied, is made with respect to the completeness or accuracy of its contents and the information is not to be relied upon as authoritative. Anyone considering taking actions based upon the content of this document is urged to base his or her investment decisions upon such investigations as he or she deems necessary. This document is being provided as information only, and no specific actions are being solicited as a result of it; to the extent permitted by law, no liability whatsoever is accepted for any direct or consequential loss arising from use of this document or its contents.
About SEB
SEB is a public company incorporated in Stockholm, Sweden, with limited liability. It is a participant at major Nordic and other European Regulated Markets and Multilateral Trading Facilities (as well as some non-European equivalent markets) for trading in financial instruments, such as markets operated by NASDAQ OMX, NYSE Euronext, London Stock Exchange, Deutsche Börse, Swiss Exchanges, Turquoise and Chi-X. SEB is authorized and regulated by Finansinspektionen in Sweden; it is authorized and subject to limited regulation by the Financial Services Authority for the conduct of designated investment business in the UK, and is subject to the provisions of relevant regulators in all other jurisdictions where SEB conducts operations. SEB Merchant Banking. All rights reserved.

Market is starting to take US/Iran headlines with a pinch of salt. Brent crude rose $2.8/b yesterday to an official close of $112.1/b. But after that it traded as low as $108.05/b before ending late night at around $109.7/b. Through the day it traded in a range of $106.87 – 112.72/b amid a flurry of news or rumors from Iran and the US. ”US temporary sanctions during negotiations” (falls alarm). ”We will bomb Iran” (not anyhow),… etc. While the market is still fluctuating to this kind of news flow, it is starting to take such headlines with a pinch of salt.

We’ll see. Maybe, maybe not. The Brent M1 contract is trading at $110.2/b this morning which very close to the average ticks through yesterday of $110.4/b.
Trump with bearish, verbal intervention whenever Brent trades above $110/b it seems. What seems to be a pattern is that Trump states something like ”very good negotiations going on with Iran”, ”New leaders in Iran are great,..”, ”Great progress in negotiations,…”, ”Deal in sight,..” etc whenever the Brent M1 contract trades above $110/b. An effort to cool the market. These hot air verbal interventions from Trump used to have a heavy bearish impact on prices, but they now seems to have less and less effect unless they are backed by reality.
As far as we can see there has been no real progress in the negotiations between the US and Iran with both sides still standing by their previous demands.
Iran is getting stronger while the cease fire lasts making a return to war for Trump yet harder. Iran is naturally in constant preparation for a return to war given Trump’s steady threats of bombing Iran again. Iran is naturally doing what ever is possible to prepare for a return to war. And every day the cease fire lasts it is better prepared. This naturally makes it more and more difficult and dangerous for the US to return to warring activity versus Iran as the consequences for energy infrastructure in the Persian Gulf will be more and more severe the longer the cease fire lasts. Israel seems to see it this way as well. That the war is not won and that current frozen state of a cease fire gives Iran opportunity to rebuild military and politically.
Global inventories are drawing down day by day. How much? In the meantime the Strait of Hormuz stays closed. There is varying measures and estimates of how much global inventories are drawing down. Our rough estimate, back of the envelope, is that global inventories are drawing down by at least some 10 mb/d or about 300 mb/d in a balance between loss of supply versus demand destruction. Other estimates we see are a monthly draw of 250-270 mb/d. The IEA only ’measured’ a draw in global observable stocks of 117 mb in April with oil on water rising 53 mb while on shore stocks fell 170 mb. But global stocks are hard to measure with large invisible, unmeasured stocks. As such a back of the envelope approach may be better.
Oil products is what the world is consuming. Oil product prices likely to rise while product stocks fall. Strategic Petroleum Reserves (SPR) are predominantly crude oil. Discharging oil from OECD SPR stocks, a sharp reduction in Chinese crude imports and a reduction in global refinery throughput of 6-7 mb/d has helped to keep crude oil markets satisfactorily supplied. But global inventories are drawing down none the less. And oil products is really what the world is consuming. So if global refinery throughput stays subdued, then demand will eventually have to match the supply of oil products. The likely path forward this summer is a steady draw down in jet fuel, diesel and gasoline. Higher prices for these. Then, if possible, higher refinery throughput and higher usage of crude in response to very profitable refinery margins. And lastly sharper draw in crude stocks and higher prices for these. But some 6 mb/d of oil products used to be exported through the Strait of Hormuz. And it may not be so easy to ramp up refinery activity across the world to compensate. Especially as Ukraine continues to damage Russian refineries as well as Russian crude production and export facilities.
Watch oil product stocks and prices as well as Brent calendar 2027. What to watch for this summer is thus oil product inventories falling and oil product premiums to crude rising. Another measure to watch is the Brent crude 2027 contract as it rises steadily day by day as the Strait of Hormuz stays closed and global oil inventories decline. The latter is close to the highest level since the start of the war and keeps rising.
The Brent M1 contract and the Brent 2027 prices and current price of jet fuel in Europe (ARA). All in USD/b

Our back of the envelope calculation of the global shortage created by the closure of the Strait of Hormuz. Note that 3.5 mb/d of discharge from SPR is also a draw. Note also that ’Forced demand loss’ of 2.5 mb/d is probably temporary and will fall back towards zero as logistics are sorted out leaving ’Price demand loss’ to do the job of balancing the market. Thus a shortfall of at least 9 mb/d created by the closure. More if SPR discharge is included and more if Forced demand loss recedes.

Brent is climbing higher. Front-month is at USD 106.3/bl this morning, close to a weekly high and a USD 9/bl jump from Mondays open. This is the move we flagged as a risk earlier in the week: the market shifting from ”a deal is around the corner” to ”this is going to take longer than we thought”.

Analyst Commodities, SEB
During April, rest-of-year Brent remained remarkably stable around USD 90/bl. A stability which rested on one single assumption: the SoH reopens around 1 May. That assumption is now slowly falling apart.
As we highlighted yesterday: every week of delay beyond 1 May adds (theoretically) ish USD 5/bl to the rest-of-year average, as global inventories draw 100 million barrels per week. i.e., a mid-May reopening implies rest-of-year Brent closer to USD 100/bl, and anything pushing into June or July takes us meaningfully higher.
What’s changed in the last 48 hours:
#1: The US military has formally warned that clearing suspected sea mines from SoH could take up to six months. That is a completely different timescale from what the financial market is pricing. Even a political deal tomorrow does not immediately reopen the strait.
#2: Trump has shifted his tone from urgency to ”strategic patience”. In yesterday’s press conference: ”Don’t rush me… I want a great deal.” The market is reading this as a president no longer feeling pressured by timelines, with the naval blockade running in the background.
#3: So far, the military activity is escalating, not de-escalating. Axios reports Iran is laying more mines in SoH. The US 3rd carrier strike group (USS George H.W. Bush) is arriving with two countermine vessels. Trump yesterday ordered the US Navy to destroy any Iranian boats caught laying mines. While CNN reports that the Pentagon is actively drawing up plans to strike Iranian SoH capabilities and individual Iranian military leaders if the ceasefire collapses. i.e., NOT a attitude consistent with an imminent deal!
Spot crude and product prices eased off the early-April highs on a combination of system rerouting and deal optimism. Both now weakening. Goldman estimates April Gulf output is reduced by 14.5 mbl/d, or 57% of pre-war supply, a number that keeps getting worse the longer this drags on.
Demand-side adaptation is ongoing: S. Korea has cut its Middle East crude dependence from 69% to 56% by pulling more from the Americas and Africa, and Japan is kicking off a second round of SPR releases from 1 May. But SPRs are finite.
Ref. to the negotiations, we should not bet on speed. The current Iranian leadership is dominated by genuine hardliners willing to absorb economic pain and run the clock to extract concessions. That is not a setup for a rapid resolution. US/Israeli media briefings keep framing the delay as ”internal Iranian divisions”, the reality is more complicated and points toward weeks and months, not days.
Our point is that the complexity is large, and higher prices have only just started (given a scenario where the negotiations drag out in time). The market spent April leaning on the USD 90/bl rest-of-year assumption; that case is diminishing by the hour. If ”early May reopening” is replaced by ”June, July or later” over the next week or two, both crude and products have meaningful room to reprice higher from here. There is a high risk being short energy and betting on any immediate political resolution(!).
Down on Friday. Up on Monday. The Brent June crude oil contract traded down 5.1% last week to a close of $90.38/b. It reached a high of $103.87/b last Monday and a low of $86.09/b on Friday as Iran announced that the Strait of Hormuz was fully open for transit. That quickly changed over the weekend as the US upheld its blockade of Iranian oil exports while Iran naturally responded by closing the SoH again. The US blew a hole in the engine room of the Iranian ship TOUSKA and took custody of the ship on Sunday. Brent crude is up 5.6% this morning to $95.4/b.
The cease-fire is expiring tomorrow. The US has said it will send a delegation for a second round of negotiations in Islamabad in Pakistan. But Iran has for now rejected a second round of talks as it views US demands as unrealistic and excessive while the US is also blocking the Strait of Hormuz.
While Brent is up 5% this morning, the financial market is still very optimistic that progress will be made. That talks will continue and that the SoH will fully open by the start of May which is consistent with a rest-of-year average Brent crude oil price of around $90/b with the market now trading that balance at around $88/b.
Financial optimism vs. physical deterioration. We have a divergence where the financial market is trading negotiations, improvements and resolution while at the same time the physical market is deteriorating day by day. Physical oil flows remain constrained by disrupted flows, longer voyage times and elevated freight and insurance costs.
Financial markets are betting that a US/Iranian resolution will save us in time from violent shortages down the road. But every day that the SoH remains closed is bringing us closer to a potentially very painful point of shortages and much higher prices.
The US blockade is also a weapon of leverage against its European and Asian allies. When Iran closed the SoH it held the world economy as a hostage against the US. The US blockade of the SoH is of course blocking Iranian oil exports. But it is also an action of disruption directed towards Europe and Asia. The US has called for the rest of the world to engaged in the war with Iran: ”If you want oil from the Persian Gulf, then go and get it”. A risk is that the US plays brinkmanship with the global oil market directed towards its European and Asian allies and maybe even towards China to force them to engage and take part. Maybe unthinkable. But unthinkable has become the norm with Trump in the White House.


Sommarväder skapar prisrally på elbörsen
Oil product price pain is set to rise as the Strait of Hormuz stays closed into summer

Solkraften pressar elpriserna dagtid

Michel Gubel ger sin syn på oljemarknaden