

Analys
Venezuela is bullish but S&P 500 still looks like the driver

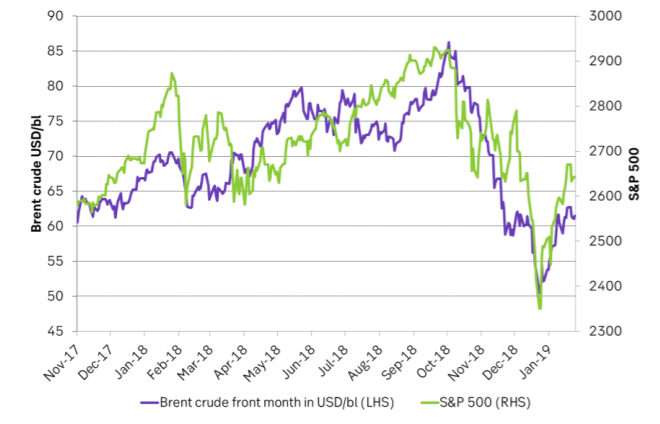
 Brent crude has gained 21% since Christmas eve following a comparable 12.4% recovery in the S&P 500 index. So just as the sell-off in Brent crude went more or less hand in hand with the equity sell-off this autumn the Brent crude recovery has gone hand in hand with the recovery of the S&P 500 so far this year. There is of course a fundamental story for the oil rebound as well with cuts by OPEC+, US shale oil rig count decline and declining production in Venezuela and Iran (and others). But what the equity-oil relationship through the autumn up to now is telling us is that if the current equity rebound falters with a renewed sell-off in the S&P 500 then the Brent crude oil price is likely to falter as well.
Donald Trump’s call for a regime shift in Venezuela with his outright support for opposition politician Juan Guaidó has led to a gain in the value of government bonds in Venezuela and thus seen as a positive development by bond investors on a general basis. Impacts on Venezuela’s oil production in the short to medium term is however another matter. To us it looks like more chaos and further decline in crude production.

Bjarne Schieldrop, Chief analyst commodities
A ban on oil imports from Venezuela to the US would likely only hurt US refineries which needs the heavy oil from Venezuela to blend with ultralight shale oil. Venezuela’s crude would probably just travel to other parts of the world instead of to the US. So an import ban to the US would probably not tighten the oil market as such. Tighter sanctions towards the Venezuelan economy with the goal of toppling the current Maduro regime would however most likely lead to a further rapid deterioration in Venezuela’s oil production which of course is directly bullish for the oil market. Eventually moving to the other side of chaos with an eventual Juan Guaidó regime holding hands with the US would then of course turn things around again as it would lay the foundation for a revival in crude production in Venezuela again but that seems to be way down the road from here.
As far as we understand it is not at all impossible for the US refineries to process ultralight US shale oil as it is today without blending it with heavy crude from Mexico or Venezuela. It is more that it is not optimal. Many of the US refineries were built for medium sour crude from the Middle East. In such complex refineries there are a lot of expensive post processing units following the division of the oil molecules in the atmospheric and vacuum distillation stage. All these post processing units have specific volume capacities calibrated to the molecule distribution in medium sour crude. So if US refineries process outright ultralight US shale oil in the distillation stage then many of the post processing units will run at sub-par volumes. Even the distillation stage may not be able to run at optimal capacity. I.e. it is technically and economically sub-optimal for these refineries to run shale oil outright but not necessarily difficult. It is mostly about economics. So a lower shale oil crude price versus product prices should facilitate this. The gasoline crack to Brent crude has however crashed to below zero and made it much more difficult. Or said in another way: A yet lower shale oil crude price is needed.
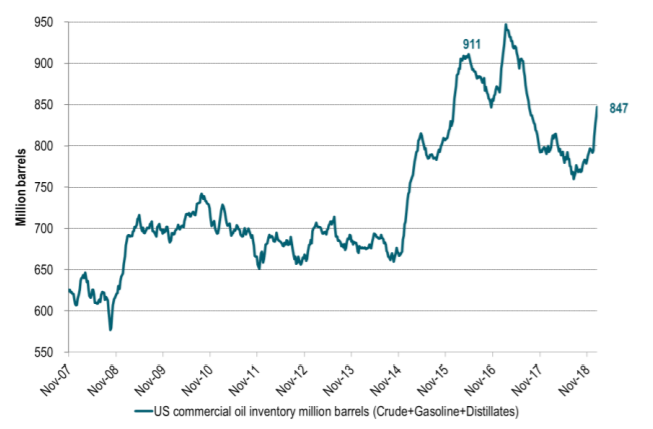
US crude and product inventories have sky-rocketed adding close to 90 m bl since late July last year of which 60 m bl have been added since late December. At the moment the market does not care too much about this since OPEC+ is cutting and production in Iran is falling (with further falls in Venezuela to be expected) while US well completions and rig count has started to decline. So the remedy for the booming inventories is on the way. If however the US S&P 500 recovery sours before the remedy shows signs of working (declining inventories) then crude oil prices would most likely follow the S&P 500 index lower.
A price-path dependent oil market. In our crude oil projection for 2019 we have projected Brent crude to average $55/bl in Q1-19 and we are well above that level now. It is important to note the strong price path dependence of today’s crude oil market. If we get a higher oil price now we’ll have more drilling more well completions and a higher oil production in the following quarters. It may feel good with Brent at $61/bl right now for global oil producers, but it may not be so good for the oil market in H2-19 as it will lead to a higher US crude oil production then.
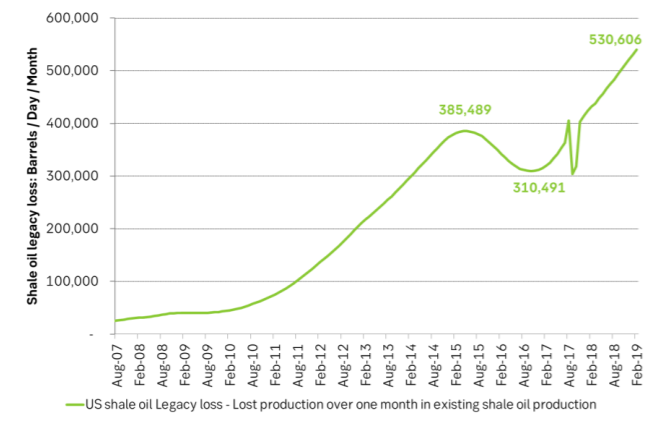
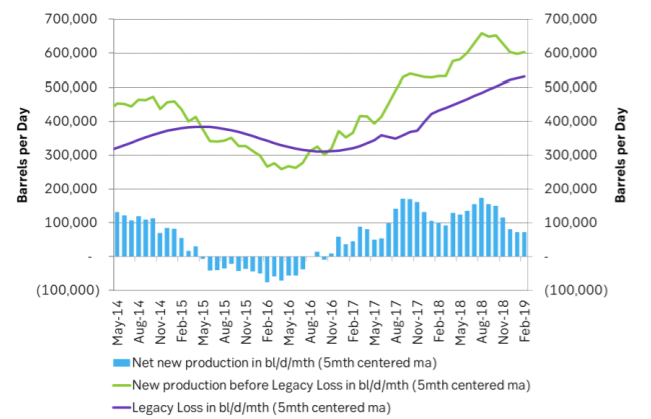
US shale oil production slows. In this week’s US EIA drilling productivity report we see that well completions have come down thus reacting to the decline in crude oil prices in H2-18. Losses in existing production rose to a new high of 530 k bl/d/mth while new production before losses rose to 602 k bl/d/mth for February. Marginal, annualized production growth thus fell to only 0.86 m bl/d/yr as new production growth slowed and moved closer to the rising legacy loss in the existing production.
Ch1: Crude prices and the S&P 500 continue hand in hand.
Ch2: US crude and product stocks have rallied. Up close to 90 m bl since late July of which close to 60 m bl since late December. But remedy is on the way with cuts by OPEC+ so the market has not cared too much about this since late December
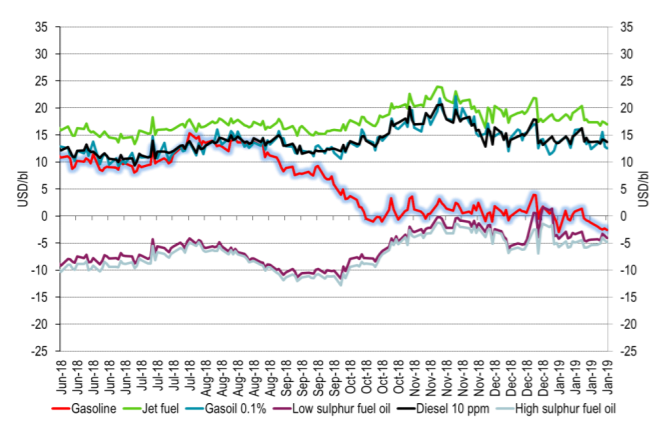
Ch3: Refining margins have been murdered by the crash in the gasoline crack (to Brent). Now gasoil and diesel cracks are also ticking lower as we moves towards the later part of the Nordic hemisphere winter.
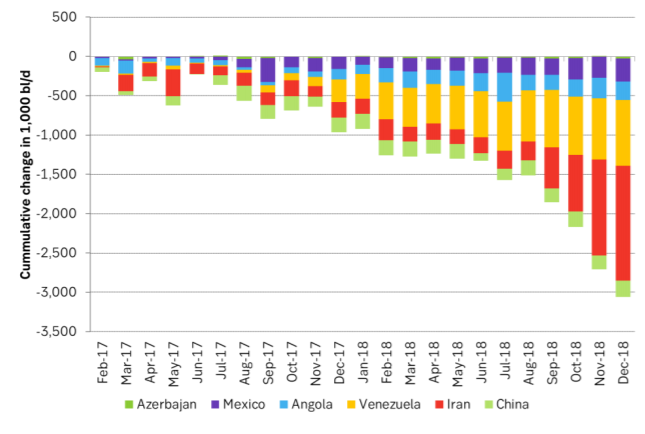
Ch4: Not so difficult to be booming shale oil as long as some 3 m bl/d is removed from supply from other suppliers. Booming US shale oil supply in the US is bad for Iran. The higher it goes the more room it gives Donald Trump to tighten Iran sanctions yet tighter.
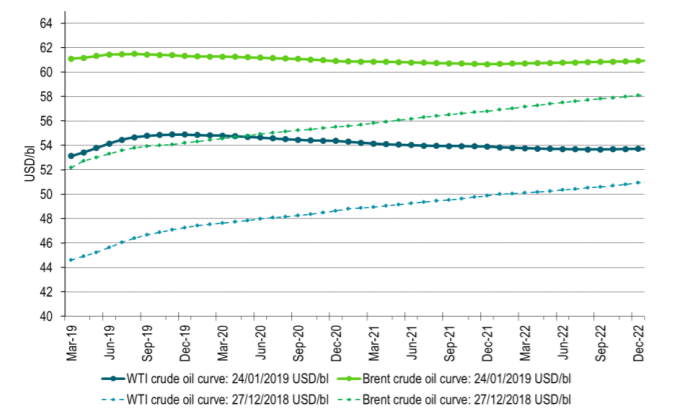
Ch5: Brent crude curve has flattened significantly since the low of 24 December
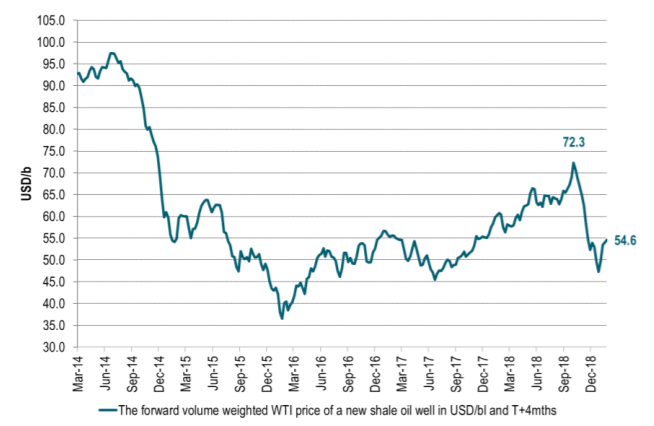
Ch6: The shale oil volume weighted WTI crude price has come down from $72.3/bl. But it has rebounded back to close to $55/bl which would imply “medium shale oil heat” if it stays at that price level. Access to capital is probably just as important as the oil price.
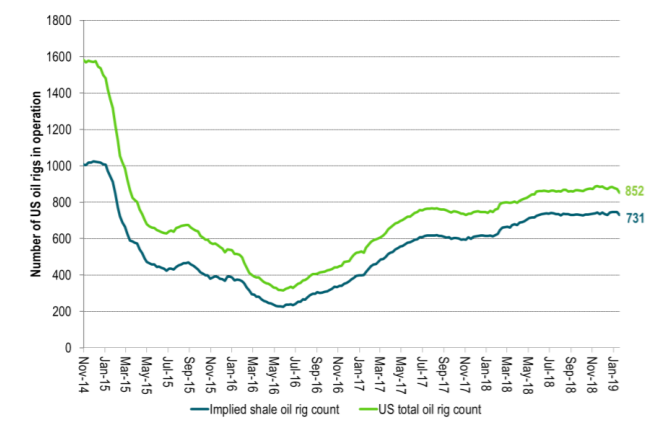
Ch7: US oil rig count has ticked lower but not all that much yet
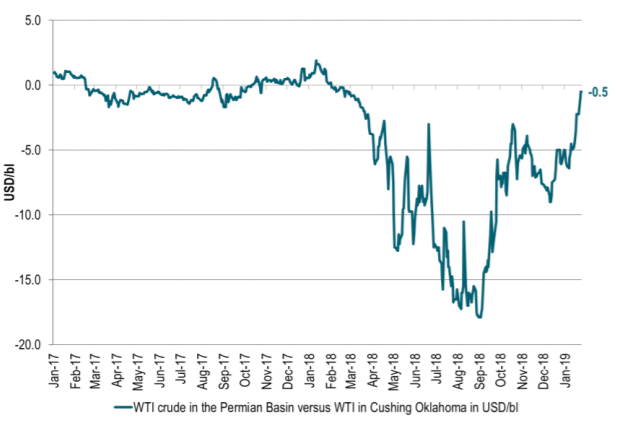
Ch8: The local Permian crude oil price traded at a huge discount versus Brent and WTI at times in 2018 as lack of pipelines out of Permian basin led to land-locked oil in the Permian
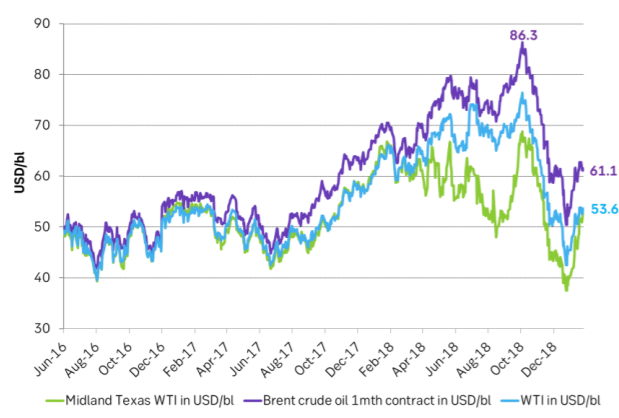
Ch9: Permian is obviously no longer very land-locked with respect to getting its oil to Cushing Oklahoma WTI and Permian prices are now almost equal again.
Ch10: Losses in existing US shale oil production will be 530 k bl/d/mth in February according to the US EIA. The most ever. I.e. more and more new wells need to be completed in order to counter this rising loss.
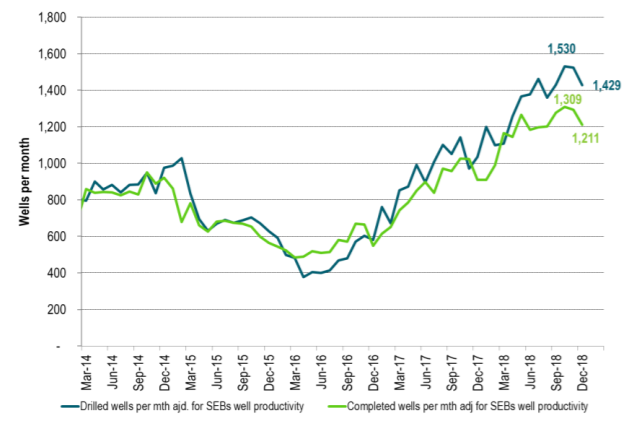
Ch11: Number of completed shale oil wells moved sideways in Oct and Nov and then down in December.
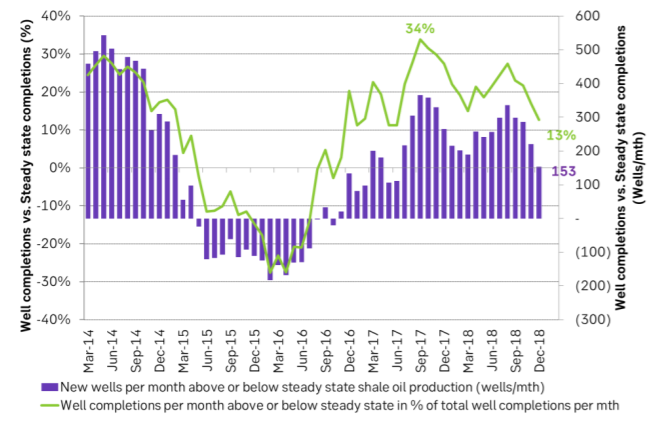
Ch12: A lower level of well completions led to a lower level of “new production”. Losses in existing production continued to increase. The gap between new production and losses thus narrowed so net production growth slowed to lowest growth rate since mid-2017.
Ch13: Well completions per month now only running at 153 (13%) wells above steady state (when US shale oil production growth = 0). That is the lowest since mid-2017. Due to strongly rising legacy loss the well completions only need to decline by another 153 wells per month to drive US shale oil production growth to a halt.
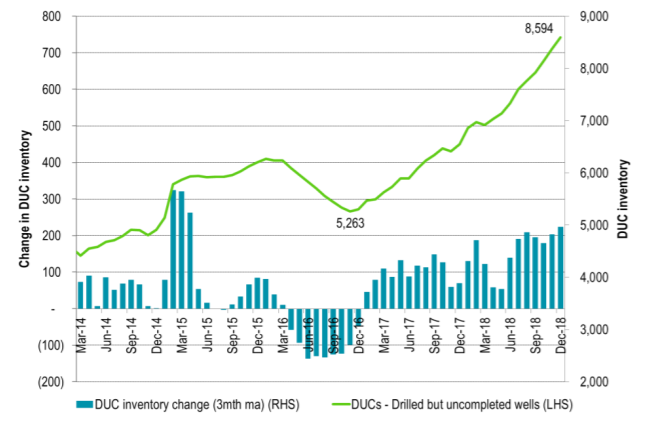
Ch14: Shale players are however still drilling way more than they are able or willing to complete. There is thus probably a significant inventory of DUCs which they can complete without drilling. So there is room for drilling rigs to decline significantly without a comparably significant decline in well completions.
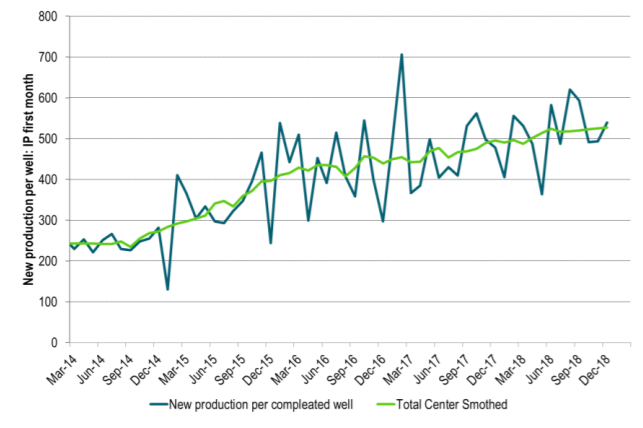
Ch15: Well productivity ticks higher at a pace of about 5-10% per year. But number of completed wells/mth is more important

The latest weekly report from the US DOE showed a substantial drawdown across key petroleum categories, adding more upside potential to the fundamental picture.

Commercial crude inventories (excl. SPR) fell by 5.8 million barrels, bringing total inventories down to 415.1 million barrels. Now sitting 11% below the five-year seasonal norm and placed in the lowest 2015-2022 range (see picture below).
Product inventories also tightened further last week. Gasoline inventories declined by 2.1 million barrels, with reductions seen in both finished gasoline and blending components. Current gasoline levels are about 3% below the five-year average for this time of year.
Among products, the most notable move came in diesel, where inventories dropped by almost 4.1 million barrels, deepening the deficit to around 20% below seasonal norms – continuing to underscore the persistent supply tightness in diesel markets.
The only area of inventory growth was in propane/propylene, which posted a significant 5.1-million-barrel build and now stands 9% above the five-year average.
Total commercial petroleum inventories (crude plus refined products) declined by 4.2 million barrels on the week, reinforcing the overall tightening of US crude and products.


A classic case of “buy the rumor, sell the news” played out in oil markets, as Brent crude has dropped sharply – down nearly USD 10 per barrel since yesterday evening – following Iran’s retaliatory strike on a U.S. air base in Qatar. The immediate reaction was: “That was it?” The strike followed a carefully calibrated, non-escalatory playbook, avoiding direct threats to energy infrastructure or disruption of shipping through the Strait of Hormuz – thus calming worst-case fears.
After Monday morning’s sharp spike to USD 81.4 per barrel, triggered by the U.S. bombing of Iranian nuclear facilities, oil prices drifted sideways in anticipation of a potential Iranian response. That response came with advance warning and caused limited physical damage. Early this morning, both the U.S. President and Iranian state media announced a ceasefire, effectively placing a lid on the immediate conflict risk – at least for now.
As a result, Brent crude has now fallen by a total of USD 12 from Monday’s peak, currently trading around USD 69 per barrel.
Looking beyond geopolitics, the market will now shift its focus to the upcoming OPEC+ meeting in early July. Saudi Arabia’s decision to increase output earlier this year – despite falling prices – has drawn renewed attention considering recent developments. Some suggest this was a response to U.S. pressure to offset potential Iranian supply losses.
However, consensus is that the move was driven more by internal OPEC+ dynamics. After years of curbing production to support prices, Riyadh had grown frustrated with quota-busting by several members (notably Kazakhstan). With Saudi Arabia cutting up to 2 million barrels per day – roughly 2% of global supply – returns were diminishing, and the risk of losing market share was rising. The production increase is widely seen as an effort to reassert leadership and restore discipline within the group.
That said, the FT recently stated that, the Saudis remain wary of past missteps. In 2018, Riyadh ramped up output at Trump’s request ahead of Iran sanctions, only to see prices collapse when the U.S. granted broad waivers – triggering oversupply. Officials have reportedly made it clear they don’t intend to repeat that mistake.
The recent visit by President Trump to Saudi Arabia, which included agreements on AI, defense, and nuclear cooperation, suggests a broader strategic alignment. This has fueled speculation about a quiet “pump-for-politics” deal behind recent production moves.
Looking ahead, oil prices have now retraced the entire rally sparked by the June 13 Israel–Iran escalation. This retreat provides more political and policy space for both the U.S. and Saudi Arabia. Specifically, it makes it easier for Riyadh to scale back its three recent production hikes of 411,000 barrels each, potentially returning to more moderate increases of 137,000 barrels for August and September.
In short: with no major loss of Iranian supply to the market, OPEC+ – led by Saudi Arabia – no longer needs to compensate for a disruption that hasn’t materialized, especially not to please the U.S. at the cost of its own market strategy. As the Saudis themselves have signaled, they are unlikely to repeat previous mistakes.
Conclusion: With Brent now in the high USD 60s, buying oil looks fundamentally justified. The geopolitical premium has deflated, but tensions between Israel and Iran remain unresolved – and the risk of missteps and renewed escalation still lingers. In fact, even this morning, reports have emerged of renewed missile fire despite the declared “truce.” The path forward may be calmer – but it is far from stable.
Analys
A muted price reaction. Market looks relaxed, but it is still on edge waiting for what Iran will do
Brent crossed the 80-line this morning but quickly fell back assigning limited probability for Iran choosing to close the Strait of Hormuz. Brent traded in a range of USD 70.56 – 79.04/b last week as the market fluctuated between ”Iran wants a deal” and ”US is about to attack Iran”. At the end of the week though, Donald Trump managed to convince markets (and probably also Iran) that he would make a decision within two weeks. I.e. no imminent attack. Previously when when he has talked about ”making a decision within two weeks” he has often ended up doing nothing in the end. The oil market relaxed as a result and the week ended at USD 77.01/b which is just USD 6/b above the year to date average of USD 71/b.

Brent jumped to USD 81.4/b this morning, the highest since mid-January, but then quickly fell back to a current price of USD 78.2/b which is only up 1.5% versus the close on Friday. As such the market is pricing a fairly low probability that Iran will actually close the Strait of Hormuz. Probably because it will hurt Iranian oil exports as well as the global oil market.
It was however all smoke and mirrors. Deception. The US attacked Iran on Saturday. The attack involved 125 warplanes, submarines and surface warships and 14 bunker buster bombs were dropped on Iranian nuclear sites including Fordow, Natanz and Isfahan. In response the Iranian Parliament voted in support of closing the Strait of Hormuz where some 17 mb of crude and products is transported to the global market every day plus significant volumes of LNG. This is however merely an advise to the Supreme leader Ayatollah Ali Khamenei and the Supreme National Security Council which sits with the final and actual decision.
No supply of oil is lost yet. It is about the risk of Iran closing the Strait of Hormuz or not. So far not a single drop of oil supply has been lost to the global market. The price at the moment is all about the assessed risk of loss of supply. Will Iran choose to choke of the Strait of Hormuz or not? That is the big question. It would be painful for US consumers, for Donald Trump’s voter base, for the global economy but also for Iran and its population which relies on oil exports and income from selling oil out of that Strait as well. As such it is not a no-brainer choice for Iran to close the Strait for oil exports. And looking at the il price this morning it is clear that the oil market doesn’t assign a very high probability of it happening. It is however probably well within the capability of Iran to close the Strait off with rockets, mines, air-drones and possibly sea-drones. Just look at how Ukraine has been able to control and damage the Russian Black Sea fleet.
What to do about the highly enriched uranium which has gone missing? While the US and Israel can celebrate their destruction of Iranian nuclear facilities they are also scratching their heads over what to do with the lost Iranian nuclear material. Iran had 408 kg of highly enriched uranium (IAEA). Almost weapons grade. Enough for some 10 nuclear warheads. It seems to have been transported out of Fordow before the attack this weekend.
The market is still on edge. USD 80-something/b seems sensible while we wait. The oil market reaction to this weekend’s events is very muted so far. The market is still on edge awaiting what Iran will do. Because Iran will do something. But what and when? An oil price of 80-something seems like a sensible level until something do happen.


Samtal om flera delar av råvarumarknaden
Tightening fundamentals – bullish inventories from DOE

Jonas Lindvall är tillbaka med ett nytt oljebolag, Perthro, som ska börsnoteras

Oljan, guldet och marknadens oroande tystnad

Domstolen ger klartecken till Lappland Guldprospektering

Stor uppsida i Lappland Guldprospekterings aktie enligt analys

Brookfield ska bygga ett AI-datacenter på hela 750 MW i Strängnäs

Sommaren inleds med sol och varierande elpriser

OPEC+ ökar oljeproduktionen trots fallande priser
Silverpriset släpar efter guldets utveckling, har mer uppsida
-
 Nyheter3 veckor sedan
Stor uppsida i Lappland Guldprospekterings aktie enligt analys
-
 Nyheter4 veckor sedan
Brookfield ska bygga ett AI-datacenter på hela 750 MW i Strängnäs
-
 Nyheter4 veckor sedan
Sommaren inleds med sol och varierande elpriser
-
 Nyheter3 veckor sedan
Silverpriset släpar efter guldets utveckling, har mer uppsida
-
 Nyheter4 veckor sedan
OPEC+ ökar oljeproduktionen trots fallande priser
-
Analys4 veckor sedan
Brent needs to fall to USD 58/b to make cheating unprofitable for Kazakhstan
-

 Nyheter4 veckor sedan
Tradingfirman XTX Markets bygger datacenter i finska Kajana för 1 miljard euro
-

 Nyheter2 veckor sedan
Uppgången i oljepriset planade ut under helgen