

Analys
US shale oil production growth to slow sharply in 2020


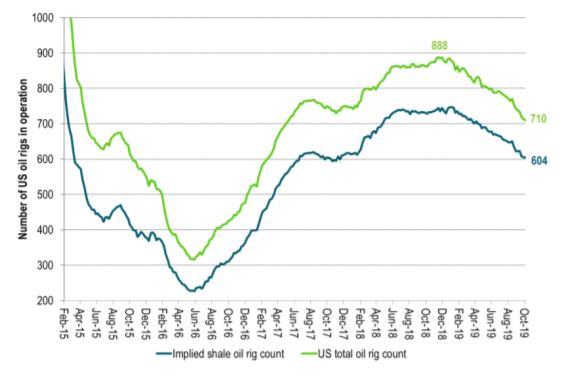
Baker Hughes US oil rig count has declined by 178 rigs since the recent peak of 888 rigs in mid-November 2018 with latest count now at 710. If anything the rig count decline has accelerated since July as investors have closed their pockets for debt based production growth with no profit to show for.
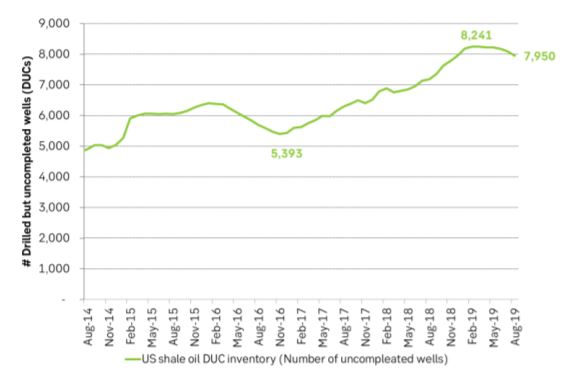
US oil rig count is now drawing down by about 3.5% per month. US shale oil producers are now completing more wells than they are drilling. As a consequence the DUC inventory of Drilled but uncompleted wells which ballooned from 5400 wells in late 2016 to a peak of 8246 in March 2019 has now been drawing down since April and is now drawing down at an accelerating pace.

The more the rig count falls the faster will be the DUC inventory draw-down be as producers work hard to maintain the monthly rate of well completions. In the end producers will have no other choice than to reduce the monthly rate of completed wells or to increase drilling activity and that is the point in time when US shale oil production growth will start to slow sharply. We think that in the end a higher oil price is needed to drive drilling activity higher.
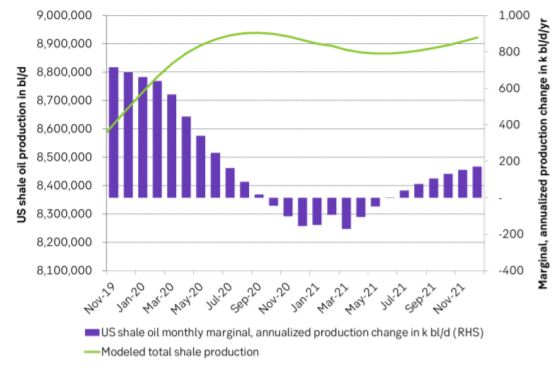
If we assume that the drilling rig count continues to fall by 20 rigs per month to the end of this year and then stabilizes then marginal US shale oil production growth is likely to slow sharply from March 2020 before contracting in September 2020.
The US EIA has a very simplistic method of calculating shale oil drilling productivity. The consequence is that they underestimate productivity in periods when the DUC inventory is growing (Dec-2016 to Mar-2019) and overestimate it when the DUC inventory is declining as it has been doing now since April. As a consequence they also have too high production forecasts when the DUC inventory is drawing down like it is now.
The US EIA is now probably overestimating US oil production for 2020 by some 300 k bl/d with a projection that production will average 13.17 m bl/d in 2020 (US EIA STEO report released yesterday). They did reduce their 2020 US production forecast yesterday from 13.23 m bl/d in their September STEO forecast to 13.17 m bl/d yesterday but they are probably still some 300 k bl/d too high.
US shale oil production is still growing by a marginal, annualized pace of 0.9 m bl/d (75 k bl/d/mth) now in October according to the latest US EIA DPR report in September. Thus the current very strong marginal US production growth still gives a very strong bearish impulse to the global oil market. This bearish impulse is however going to slow sharply from March onwards next year and potentially go to neutral and turn to bullish in September next year.
Year on year production growth in the US is still going to be significant in 2020 due to base effects. The US EIA STEO report yesterday projects a US liquids production growth of 1.56 m bl/d y/y from 2019 to 2020. We think that this is probably in the ball-park some 0.3 m bl/d to high. That still leaves a very strong 1.2 m bl/d y/y average growth in 2020. The monthly production growth and thus marginal bearish impulse to the global oil market is however likely going to slow sharply from March next year. On a Jan-2020 to Jan-2021 basis the US crude oil production is probably not going to increase by more than 100 k bl/d unless drilling picks up.
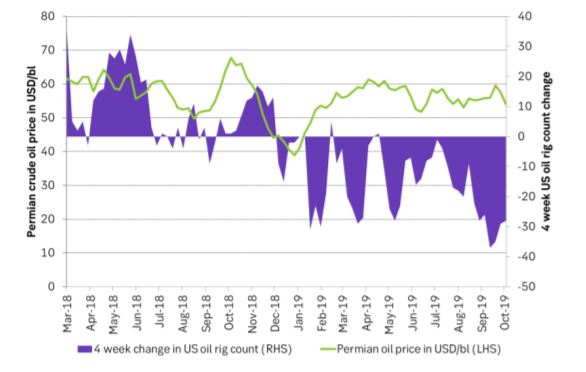
In order to instigate an expansion again in US drilling rig count the shale oil players will need a higher oil price than we have now. The Permian oil price has averaged $56/bl during the oil rig draw-down since January. The WTI price has averaged $57/bl and the 18 month forward WTI price has averaged $55/bl. These prices probably need to move up to $65-70/bl in order to instigate an expansion US shale oil drilling again. Right now we have Permian = $54/bl, WTI 1mth = $53/bl and WTI 18mth = $49.9/bl. I.e. all these prices are today lower than what they have been on average during the rig count draw down since January so further draw down in US oil rig count should be expected.
Ch1: Local Permian oil price in USD/bl versus 4 weeks change in US oil rig count. The Permian oil price has averaged $56/bl during the draw-down phase and probably needs to move up by some $10/bl in order to instigate drilling rig count expansion again. Latest Permian oil price is $54/bl
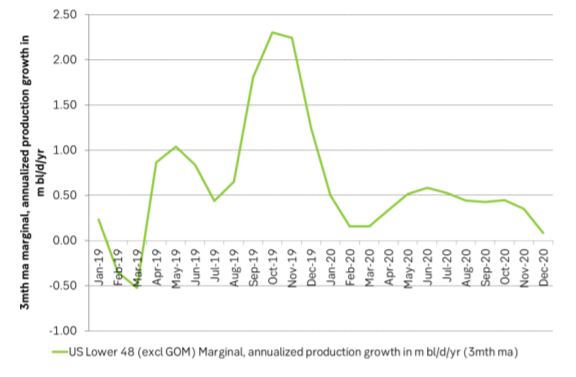
Ch2: The US EIA’s latest STEO report is also forecasting a sharply lower marginal, annualized production growth in US Lower 48 states (excl GOM) which is mostly shale oil production. They are forecasting a marginal, annualized production growth rate of 0.3 m bl/d/yr on average in 2020 versus an average growth rate of 0.84 m bl/d in 2019. Thus the US EIA is also forecasting a sharply slower production growth for US shale next year. However, we do think that their projections are probably too high and needs to be adjusted lower towards zero marginal production growth through 2020.
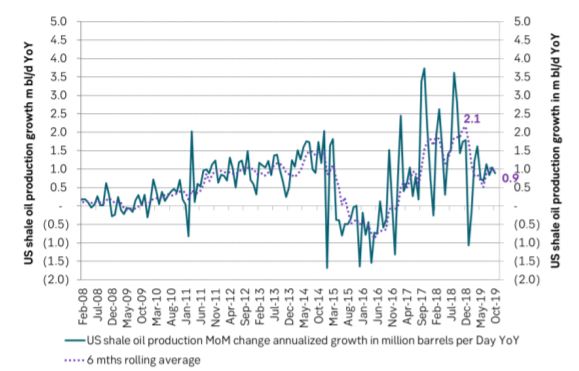
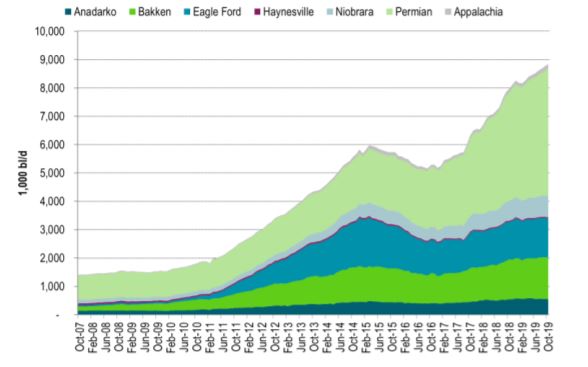
Ch3: US marginal, annualized production growth is still very strong with an annualized growth rate of 0.9 m bl/d according to the US EIA September DPR report. The estimate of 0.9 m bl/d/y for October is probably a bit on the high side. Nonetheless it is in decline. Shale oil players are probably going to start to reduce monthly well completion rates from January onwards as the DUC inventory starts to decline. That will rapidly drive the marginal production growth rate lower
Ch4: The US inventory of DUCs has now been drawing down since April and the draw down is accelerating. It will probably draw down to about 5,500 at around the end of 2020.
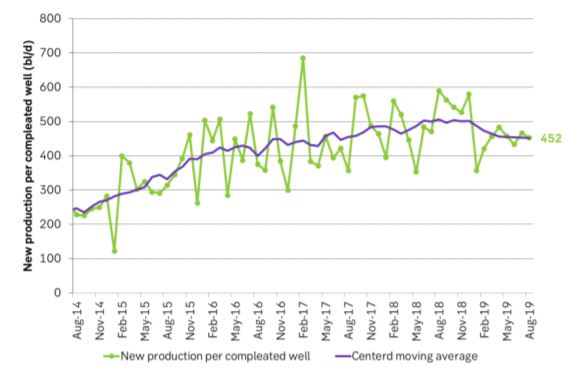
Ch5: US shale oil well productivity has halted its historical relentless productivity growth and has pulled back a little.
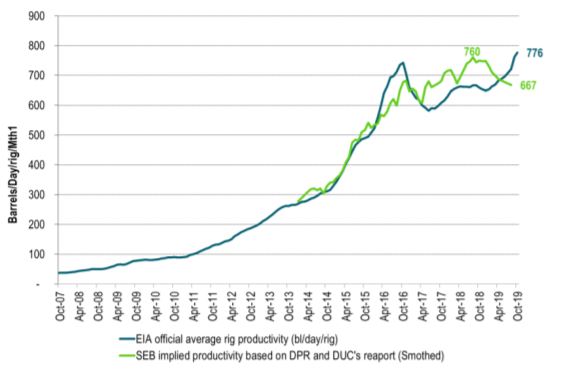
Ch6: Official US EIA drilling rig productivity measure has risen strongly since the end of 2018. In our view this is primarily due to the accelerating draw down in the US DUC inventory which technically is leading to an overestimation in drilling productivity according to the EIA’s methodology of calculating it as [New production at time T]/[Rig count in T-2]. If a significant amount of new production stems for the DUC draw down then production will be high while the rig count number will be low thus leading to an overestimation of the rig productivity
Ch7: US shale oil production is growing strongly but slowing and the slowing will accelerate in March 2020 onwards
Ch8: US production growth is likely to slow sharply in Q2-2020 onwards as well completions are likely to decline along with the declining DUC inventory
Ch9: US oil rig count is falling sharply and the decline seems to accelerate. Completions of shale oil wells per month has managed to hold up due to the DUC inventory but impact is likely to be significant in Q2-2020 leading in the end to lower well completion rates

The latest weekly report from the US DOE showed a substantial drawdown across key petroleum categories, adding more upside potential to the fundamental picture.

Commercial crude inventories (excl. SPR) fell by 5.8 million barrels, bringing total inventories down to 415.1 million barrels. Now sitting 11% below the five-year seasonal norm and placed in the lowest 2015-2022 range (see picture below).
Product inventories also tightened further last week. Gasoline inventories declined by 2.1 million barrels, with reductions seen in both finished gasoline and blending components. Current gasoline levels are about 3% below the five-year average for this time of year.
Among products, the most notable move came in diesel, where inventories dropped by almost 4.1 million barrels, deepening the deficit to around 20% below seasonal norms – continuing to underscore the persistent supply tightness in diesel markets.
The only area of inventory growth was in propane/propylene, which posted a significant 5.1-million-barrel build and now stands 9% above the five-year average.
Total commercial petroleum inventories (crude plus refined products) declined by 4.2 million barrels on the week, reinforcing the overall tightening of US crude and products.


A classic case of “buy the rumor, sell the news” played out in oil markets, as Brent crude has dropped sharply – down nearly USD 10 per barrel since yesterday evening – following Iran’s retaliatory strike on a U.S. air base in Qatar. The immediate reaction was: “That was it?” The strike followed a carefully calibrated, non-escalatory playbook, avoiding direct threats to energy infrastructure or disruption of shipping through the Strait of Hormuz – thus calming worst-case fears.
After Monday morning’s sharp spike to USD 81.4 per barrel, triggered by the U.S. bombing of Iranian nuclear facilities, oil prices drifted sideways in anticipation of a potential Iranian response. That response came with advance warning and caused limited physical damage. Early this morning, both the U.S. President and Iranian state media announced a ceasefire, effectively placing a lid on the immediate conflict risk – at least for now.
As a result, Brent crude has now fallen by a total of USD 12 from Monday’s peak, currently trading around USD 69 per barrel.
Looking beyond geopolitics, the market will now shift its focus to the upcoming OPEC+ meeting in early July. Saudi Arabia’s decision to increase output earlier this year – despite falling prices – has drawn renewed attention considering recent developments. Some suggest this was a response to U.S. pressure to offset potential Iranian supply losses.
However, consensus is that the move was driven more by internal OPEC+ dynamics. After years of curbing production to support prices, Riyadh had grown frustrated with quota-busting by several members (notably Kazakhstan). With Saudi Arabia cutting up to 2 million barrels per day – roughly 2% of global supply – returns were diminishing, and the risk of losing market share was rising. The production increase is widely seen as an effort to reassert leadership and restore discipline within the group.
That said, the FT recently stated that, the Saudis remain wary of past missteps. In 2018, Riyadh ramped up output at Trump’s request ahead of Iran sanctions, only to see prices collapse when the U.S. granted broad waivers – triggering oversupply. Officials have reportedly made it clear they don’t intend to repeat that mistake.
The recent visit by President Trump to Saudi Arabia, which included agreements on AI, defense, and nuclear cooperation, suggests a broader strategic alignment. This has fueled speculation about a quiet “pump-for-politics” deal behind recent production moves.
Looking ahead, oil prices have now retraced the entire rally sparked by the June 13 Israel–Iran escalation. This retreat provides more political and policy space for both the U.S. and Saudi Arabia. Specifically, it makes it easier for Riyadh to scale back its three recent production hikes of 411,000 barrels each, potentially returning to more moderate increases of 137,000 barrels for August and September.
In short: with no major loss of Iranian supply to the market, OPEC+ – led by Saudi Arabia – no longer needs to compensate for a disruption that hasn’t materialized, especially not to please the U.S. at the cost of its own market strategy. As the Saudis themselves have signaled, they are unlikely to repeat previous mistakes.
Conclusion: With Brent now in the high USD 60s, buying oil looks fundamentally justified. The geopolitical premium has deflated, but tensions between Israel and Iran remain unresolved – and the risk of missteps and renewed escalation still lingers. In fact, even this morning, reports have emerged of renewed missile fire despite the declared “truce.” The path forward may be calmer – but it is far from stable.
Analys
A muted price reaction. Market looks relaxed, but it is still on edge waiting for what Iran will do
Brent crossed the 80-line this morning but quickly fell back assigning limited probability for Iran choosing to close the Strait of Hormuz. Brent traded in a range of USD 70.56 – 79.04/b last week as the market fluctuated between ”Iran wants a deal” and ”US is about to attack Iran”. At the end of the week though, Donald Trump managed to convince markets (and probably also Iran) that he would make a decision within two weeks. I.e. no imminent attack. Previously when when he has talked about ”making a decision within two weeks” he has often ended up doing nothing in the end. The oil market relaxed as a result and the week ended at USD 77.01/b which is just USD 6/b above the year to date average of USD 71/b.

Brent jumped to USD 81.4/b this morning, the highest since mid-January, but then quickly fell back to a current price of USD 78.2/b which is only up 1.5% versus the close on Friday. As such the market is pricing a fairly low probability that Iran will actually close the Strait of Hormuz. Probably because it will hurt Iranian oil exports as well as the global oil market.
It was however all smoke and mirrors. Deception. The US attacked Iran on Saturday. The attack involved 125 warplanes, submarines and surface warships and 14 bunker buster bombs were dropped on Iranian nuclear sites including Fordow, Natanz and Isfahan. In response the Iranian Parliament voted in support of closing the Strait of Hormuz where some 17 mb of crude and products is transported to the global market every day plus significant volumes of LNG. This is however merely an advise to the Supreme leader Ayatollah Ali Khamenei and the Supreme National Security Council which sits with the final and actual decision.
No supply of oil is lost yet. It is about the risk of Iran closing the Strait of Hormuz or not. So far not a single drop of oil supply has been lost to the global market. The price at the moment is all about the assessed risk of loss of supply. Will Iran choose to choke of the Strait of Hormuz or not? That is the big question. It would be painful for US consumers, for Donald Trump’s voter base, for the global economy but also for Iran and its population which relies on oil exports and income from selling oil out of that Strait as well. As such it is not a no-brainer choice for Iran to close the Strait for oil exports. And looking at the il price this morning it is clear that the oil market doesn’t assign a very high probability of it happening. It is however probably well within the capability of Iran to close the Strait off with rockets, mines, air-drones and possibly sea-drones. Just look at how Ukraine has been able to control and damage the Russian Black Sea fleet.
What to do about the highly enriched uranium which has gone missing? While the US and Israel can celebrate their destruction of Iranian nuclear facilities they are also scratching their heads over what to do with the lost Iranian nuclear material. Iran had 408 kg of highly enriched uranium (IAEA). Almost weapons grade. Enough for some 10 nuclear warheads. It seems to have been transported out of Fordow before the attack this weekend.
The market is still on edge. USD 80-something/b seems sensible while we wait. The oil market reaction to this weekend’s events is very muted so far. The market is still on edge awaiting what Iran will do. Because Iran will do something. But what and when? An oil price of 80-something seems like a sensible level until something do happen.


Hur säkrar vi Sveriges tillgång till kritiska metaller och mineral i en ny geopolitisk verklighet?

Lundin Mining ska bli en av de tio största kopparproducenterna i världen

Sommarvädret styr elpriset i Sverige

Samtal om flera delar av råvarumarknaden
Tightening fundamentals – bullish inventories from DOE

Stor uppsida i Lappland Guldprospekterings aktie enligt analys
Silverpriset släpar efter guldets utveckling, har mer uppsida

Uppgången i oljepriset planade ut under helgen

Låga elpriser i sommar – men mellersta Sverige får en ökning

Mahvie Minerals växlar spår – satsar fullt ut på guld
-
 Nyheter4 veckor sedan
Stor uppsida i Lappland Guldprospekterings aktie enligt analys
-
 Nyheter4 veckor sedan
Silverpriset släpar efter guldets utveckling, har mer uppsida
-
 Nyheter3 veckor sedan
Uppgången i oljepriset planade ut under helgen
-
 Nyheter3 veckor sedan
Låga elpriser i sommar – men mellersta Sverige får en ökning
-
 Nyheter2 veckor sedan
Mahvie Minerals växlar spår – satsar fullt ut på guld
-
Analys3 veckor sedan
Very relaxed at USD 75/b. Risk barometer will likely fluctuate to higher levels with Brent into the 80ies or higher coming 2-3 weeks
-

 Nyheter1 vecka sedan
Oljan, guldet och marknadens oroande tystnad
-

 Nyheter1 vecka sedan
Jonas Lindvall är tillbaka med ett nytt oljebolag, Perthro, som ska börsnoteras