
Analys
SEB – Råvarukommentarer vecka 15 2012
Sammanfattning: Föregående vecka
 Brett råvaruindex: -0,10 %
UBS Bloomberg CMCI TR Index- Energi: +0,28 %
UBS Bloomberg CMCI Energy TR Index - Ädelmetaller: -2,46 %
UBS Bloomberg CMCI Precious Metals TR Index - Industrimetaller: -0,22 %
UBS Bloomberg CMCI Industrial Metals TR Index - Jordbruk: -0,06 %
UBS Bloomberg CMCI Agriculture TR Index
Kortsiktig marknadsvy:
- Guld: Neutral/köp
- Olja: Neutral/sälj
- Koppar: Sälj
- Majs: Sälj
- Vete: Neutral/sälj
Guld

- Guldpriset föll 1,5 procent förra veckan och nådde på onsdagen tillfälligt 1614 dollar, den lägsta nivån på 12 veckor. Nedtonade förväntningar om ytterligare stimulanser från Federal Reserve fick guldet att falla och dollarn steg mot de flesta övriga valutor.
- Ekonomin utvecklas svagt i Europa, vilket avspeglas i ett svagt inköpschefsindex. Detta låg för mars månad under den nivå som indikerar en industriell expansion.
- Vidare har oron för Spanien tagit fart igen. Landet har svårt att nå tillräckliga besparingar för att få bukt med ett allt för stort budgetunderkott. Detta samtidigt som Tyskland ser en stigande inflation på grund av de största löneökningarna på 20 år.
- I Indien fortsätter juvelerarnas strejk, vilken nu har pågått i två veckor. Strejken är en protest mot en nytillkommen ökning på skatten av obearbetat importerat guld. Kortsiktigt bör dock inte guldpriset påverkas nämnvärt av strejken.
- Fredagens amerikanska arbetsmarknadssiffror kom ut sämre än förväntat och öppnar upp för nya spekulationer avseende ett nytt paket av kvantitativa lättnader i USA. Detta bör kunna ge stöd åt guldet den närmaste tiden.
- Teknisk Analys: Marknaden har utvecklats något svagare under den senaste veckan då vi fallit och stannat under den nedre delen av medelvärdesbanden. Detta förändrar dock ingenting i det större perspektivet varför vi fortsätter vårt sökande efter slutet på innevarande korrektion. För att den långsiktigt positiva bilden ska ändras krävs det att våg C’s botten bryts.

Olja

- Oljepriset föll med 1,6 procent förra veckan. Goda industrisignaler från USA bidrog till att oljepriset lyfte i början av veckan, men oljan backade kraftigt på tisdagen efter dämpade förväntningar om nya penningpolitiska lättnader i landet. Ska ytterligare lättnadsåtgärder behövas i USA anser Fed att ekonomin ska försämras ytterligare och inflationen bör sjunka under två procent.
- Statistik från American Petroleum Institute (API) visade att lagren av amerikansk råolja steg med 7,8 miljoner fat till den högsta nivån sedan juli 2007. Den lagerstatistik som energidepartementet presenterade på onsdagen visade att lagren av råolja steg med 9 miljoner fat.
- Saudiarabien har annonserat att man inte kommer att dra ned på oljeexporten. Detta kommer inte ens ske om man i väst väljer att öppna upp sina strategiska oljereserver. Enligt Reuters producerade Saudiarabien 10 miljoner fat per dag under mars, vilket bidrog till ökade råoljelager.
- Fredagens arbetsmarknadsstatistik från USA för mars blev en besvikelse och antalet sysselsatta ökade med endast 120 000 personer. Förvisso föll arbetslösheten, men förbättringen kan främst relateras till ett lägre arbetsdeltagande. Oljepriset föll tillsammans med aktier och råvaror på denna nyhet.
- Teknisk Analys: Efter det misslyckade brottet upp ur den triangellika formationen (samma som i koppar) har vi nu rört oss nedåt och kommit fram till stöd området. Givet det falska brottet norrut kan vi nog med tillförsikt se an ett brott söderut. Dessutom, i och med den senaste utvecklingen, ser hela formationen ut att ta formen av en rundad topp.

Koppar

- Kopparpriset föll med 3,3 procent förra veckan. Under början av veckan steg dock priset efter oväntat starka PMI-siffror från Kina (53.1 mot förväntat 50.8), men efter att Federal Reserve signalerat om återhållsam penningpolitik föll metallen tillsammans med övriga marknader under den fortsatta veckan.
- Enligt Bloomberg steg LME:s kopparlager förra veckan. Marknaden förväntar sig högre lagernivåer, detta då efterfrågan på koppar från Kina har dämpats den senaste tiden. Kinesisk kopparimport föll i mars jämfört med föregående månad som en konsekvens av höga inhemska kopparlager. Kina står för närvarande för cirka 40 procent av världens kopparkonsumtion.
- Under mars månad överraskade Kinas inflation på uppsidan, detta efter att priserna har stigit med 3.6% under de senaste 12 månaderna. Siffran minskar sannolikheten för ytterligare monetära stimulanser.
- En del befarar nu att den kinesiska ekonomin är på väg mot en kraftigare inbromsning än vad man tidigare förväntat sig. Även om landets export- och importtillväxt är fortsatt positiv god har vi kunnat se en väsentlig inbromsning, vilket tynger kopparpriset. Med detta sagt bibehåller vi vår säljrekommendation.
- Teknisk Analys: Efter att två gånger ha brutit upp ur triangeln och båda gångerna omedelbart tvingats till reträtt får vi nog anse att nedåtrisken för innevarande vecka är stor, ja till och med mycket stor (falska brott ur ett intervall leder ofta till ett brott i motsatt riktning). Så ett varningen finger är nog på sin plats skulle 8131 stödet ge vika.

Majs
 tom april 2012")
- Vår vy om en påskvecka utan tydlig riktning, men med positiva undertoner, visade sig stämma ganska väl. Priset fortsatte på måndagen upp något i efterdyningarna av fredagens kraftiga uppgång, men har sedan dess legat runt 6,5 USD/bushel.
- Enligt Bloomberg ser det denna vecka ljust ut för planteringen av den amerikanska majsskörden. Det varma och torra vädret öppnar upp för en tidig plantering, vilket i regel brukar innebära god avkastning för majsen.
- Enligt det amerikanska jordbruksdepartementet (USDA) har de amerikanska bönderna nu planterat 7 % av sin majs. Förra året hade 3 % planterats vid denna tidpunkt och snittet för de senaste 5 åren ligger på 2 %.
- Även om investerarna efter de senaste veckornas positiva prisutveckling bör återvända till majsmarknaden tror vi inte att detta kommer att kunna ge något starkare stöd åt priset. Man ska inte glömma att den befintliga lagernivån är låg och efterfrågan fortsatt god, men detta bör vara väl inprisat och således ligger risken på nedsidan de kommande veckorna.
- Teknisk Analys: Efter den kraftfulla studsen den 30/3 har marknaden i princip gjort ingenting. För att utlösa någon nämnvärd aktivitet måste nog vi bryta antingen över 675 ¾ eller under 624 ½. Däremellan råder stiltje.

Vete

- Till skillnad från majsen orkade inte vetepriset hålla sig kvar på de nivåer som vi kunde se i början av veckan. Vinsthemtagningar tillsammans med förbättrade utsikter för den amerikanska produktionen av vintervete tryckte priset nedåt.
- Kvaliteten på det amerikanska vintervetet får än så länge anses vara förhållandevis god. Enligt söndagens rapport från USDA är 10 % av skörden dålig eller mycket dålig. Detta kan jämföras med förra året då motsvarande siffra var 36 %. (Vintervetet odlas under hösten/vintern och skördas under sommaren.)
- Planteringen av det amerikanska vårvetet går mycket bra. Enligt USDA:s senaste rapport har 21 % planterats. Förra året hade 3 % av vårvetet planterats vid denna tidpunkt och snittet för de senaste 5 åren ligger på 5 %. (Vårvetet planteras under våren och skördas på sensommaren.)
- Vidare gick den amerikanska exporten av vete ned något under föregående vecka, vilket tyder på en något svagare efterfrågan på vete.
- Fundamentalt bedömer att utsikterna för vete denna vecka är negativa, men de tekniska signalerna gör oss återhållsamma.
- Teknisk Analys: Även ett andra besök i 55dagarsbandet renderade köpande, något som vi lägger på det positiva kontot. Nästa steg bör bli att ta ut 215 motståndet och därefter stör dörren vidöppen för nya trendtoppar.

[box]SEB Veckobrev Veckans råvarukommentar är producerat av SEB Merchant Banking och publiceras i samarbete och med tillstånd på Råvarumarknaden.se[/box]
Disclaimer
The information in this document has been compiled by SEB Merchant Banking, a division within Skandinaviska Enskilda Banken AB (publ) (“SEB”).
Opinions contained in this report represent the bank’s present opinion only and are subject to change without notice. All information contained in this report has been compiled in good faith from sources believed to be reliable. However, no representation or warranty, expressed or implied, is made with respect to the completeness or accuracy of its contents and the information is not to be relied upon as authoritative. Anyone considering taking actions based upon the content of this document is urged to base his or her investment decisions upon such investigations as he or she deems necessary. This document is being provided as information only, and no specific actions are being solicited as a result of it; to the extent permitted by law, no liability whatsoever is accepted for any direct or consequential loss arising from use of this document or its contents.
About SEB
SEB is a public company incorporated in Stockholm, Sweden, with limited liability. It is a participant at major Nordic and other European Regulated Markets and Multilateral Trading Facilities (as well as some non-European equivalent markets) for trading in financial instruments, such as markets operated by NASDAQ OMX, NYSE Euronext, London Stock Exchange, Deutsche Börse, Swiss Exchanges, Turquoise and Chi-X. SEB is authorized and regulated by Finansinspektionen in Sweden; it is authorized and subject to limited regulation by the Financial Services Authority for the conduct of designated investment business in the UK, and is subject to the provisions of relevant regulators in all other jurisdictions where SEB conducts operations. SEB Merchant Banking. All rights reserved.

So far this week, Brent Crude prices have strengthened by USD 1.3 per barrel since Monday’s opening. While macroeconomic concerns persist, they have somewhat abated, resulting in muted price reactions. Fundamentals predominantly influence global oil price developments at present. This week, we’ve observed highs of USD 89 per barrel yesterday morning and lows of USD 85.7 per barrel on Monday morning. Currently, Brent Crude is trading at a stable USD 88.3 per barrel, maintaining this level for the past 24 hours.

Additionally, there has been no significant price reaction to Crude following yesterday’s US inventory report (see page 11 attached):
- US commercial crude inventories (excluding SPR) decreased by 6.4 million barrels from the previous week, standing at 453.6 million barrels, roughly 3% below the five-year average for this time of year.
- Total motor gasoline inventories decreased by 0.6 million barrels, approximately 4% below the five-year average.
- Distillate (diesel) inventories increased by 1.6 million barrels but remain weak historically, about 7% below the five-year average.
- Total commercial petroleum inventories (crude + products) decreased by 3.8 million barrels last week.
Regarding petroleum products, the overall build/withdrawal aligns with seasonal patterns, theoretically exerting limited effect on prices. However, the significant draw in commercial crude inventories counters the seasonality, surpassing market expectations and API figures released on Tuesday, indicating a draw of 3.2 million barrels (compared to Bloomberg consensus of +1.3 million). API numbers for products were more in line with the US DOE.
Against this backdrop, yesterday’s inventory report is bullish, theoretically exerting upward pressure on crude prices.
Yet, the current stability in prices may be attributed to reduced geopolitical risks, balanced against demand concerns. Markets are adopting a wait-and-see approach ahead of Q1 US GDP (today at 14:30) and the Fed’s preferred inflation measure, “core PCE prices” (tomorrow at 14:30). A stronger print could potentially dampen crude prices as market participants worry over the demand outlook.
Geopolitical “risk premiums” have decreased from last week, although concerns persist, highlighted by Ukraine’s strikes on two Russian oil depots in western Russia and Houthis’ claims of targeting shipping off the Yemeni coast yesterday.
With a relatively calmer geopolitical landscape, the market carefully evaluates data and fundamentals. While the supply picture appears clear, demand remains the predominant uncertainty that the market attempts to decode.
Brent crude has fallen USD 3/b since the peak of Iran-Israel concerns last week. Still lots of talk about significant Mid-East risk premium in the current oil price. But OPEC+ is in no way anywhere close to loosing control of the oil market. Thus what will really matter is what OPEC+ decides to do in June with respect to production in Q3-24 and the market knows this very well. Saudi Arabia’s social cost-break-even is estimated at USD 100/b today. Also Saudi Arabia’s purse is hurt by 21% US inflation since Jan 2020. Saudi needs more money to make ends meet. Why shouldn’t they get a higher nominal pay as everyone else. Saudi will ask for it

Brent is down USD 3/b vs. last week as the immediate risk for Iran-Israel has faded. But risk is far from over says experts. The Brent crude oil price has fallen 3% to now USD 87.3/b since it became clear that Israel was willing to restrain itself with only a muted counter attack versus Israel while Iran at the same time totally played down the counterattack by Israel. The hope now is of course that that was the end of it. The real fear has now receded for the scenario where Israeli and Iranian exchanges of rockets and drones would escalate to a point where also the US is dragged into it with Mid East oil supply being hurt in the end. Not everyone are as optimistic. Professor Meir Javedanfar who teaches Iranian-Israeli studies in Israel instead judges that ”this is just the beginning” and that they sooner or later will confront each other again according to NYT. While the the tension between Iran and Israel has faded significantly, the pain and anger spiraling out of destruction of Gaza will however close to guarantee that bombs and military strifes will take place left, right and center in the Middle East going forward.
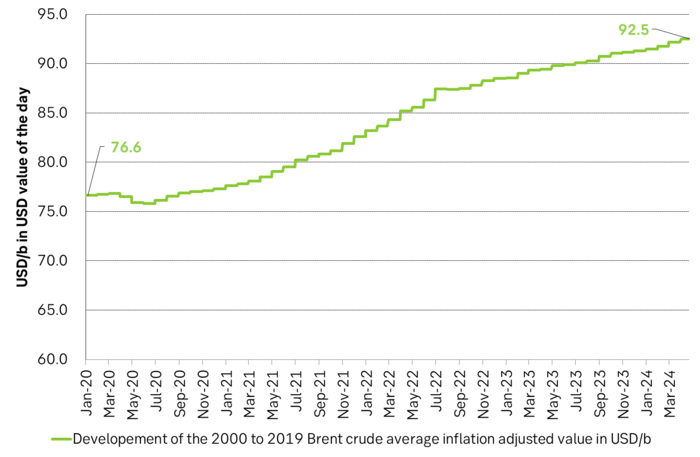
Also OPEC+ wants to get paid. At the start of 2020 the 20 year inflation adjusted average Brent crude price stood at USD 76.6/b. If we keep the averaging period fixed and move forward till today that inflation adjusted average has risen to USD 92.5/b. So when OPEC looks in its purse and income stream it today needs a 21% higher oil price than in January 2020 in order to make ends meet and OPEC(+) is working hard to get it.
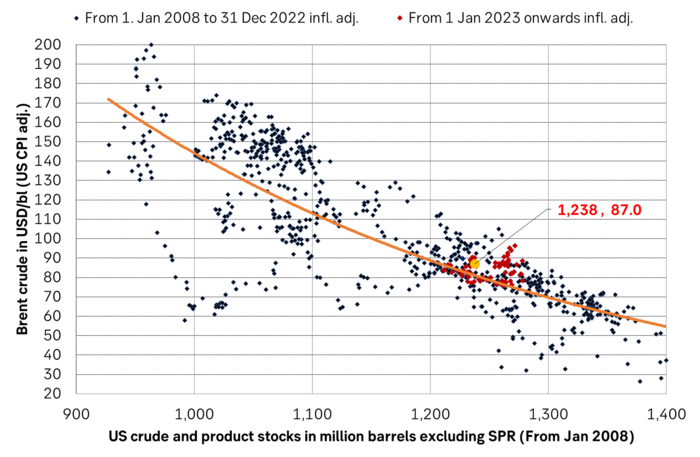
Much talk about Mid-East risk premium of USD 5-10-25/b. But OPEC+ is in control so why does it matter. There is much talk these days that there is a significant risk premium in Brent crude these days and that it could evaporate if the erratic state of the Middle East as well as Ukraine/Russia settles down. With the latest gains in US oil inventories one could maybe argue that there is a USD 5/b risk premium versus total US commercial crude and product inventories in the Brent crude oil price today. But what really matters for the oil price is what OPEC+ decides to do in June with respect to Q3-24 production. We are in no doubt that the group will steer this market to where they want it also in Q3-24. If there is a little bit too much oil in the market versus demand then they will trim supply accordingly.
Also OPEC+ wants to make ends meet. The 20-year real average Brent price from 2000 to 2019 stood at USD 76.6/b in Jan 2020. That same averaging period is today at USD 92.5/b in today’s money value. OPEC+ needs a higher nominal price to make ends meet and they will work hard to get it.
Inflation adjusted Brent crude price versus total US commercial crude and product stocks. A bit above the regression line. Maybe USD 5/b risk premium. But type of inventories matter. Latest big gains were in Propane and Other oils and not so much in crude and products
Total US commercial crude and product stocks usually rise by 4-5 m b per week this time of year. Gains have been very strong lately, but mostly in Propane and Other oils
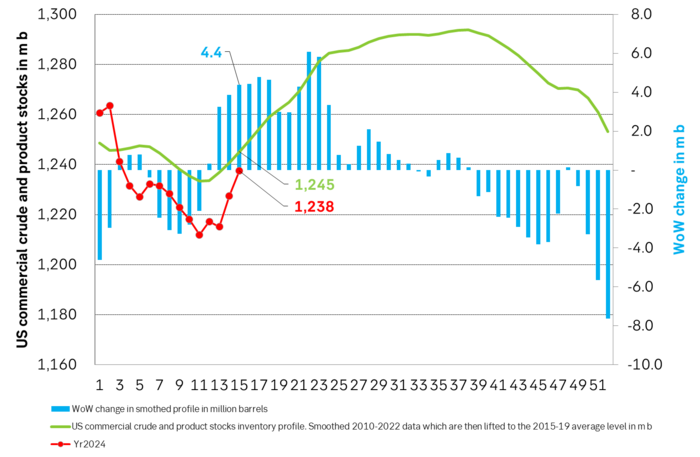
Last week’s US inventory data. Big rise of 10 m b in commercial inventories. What really stands out is the big gains in Propane and Other oils
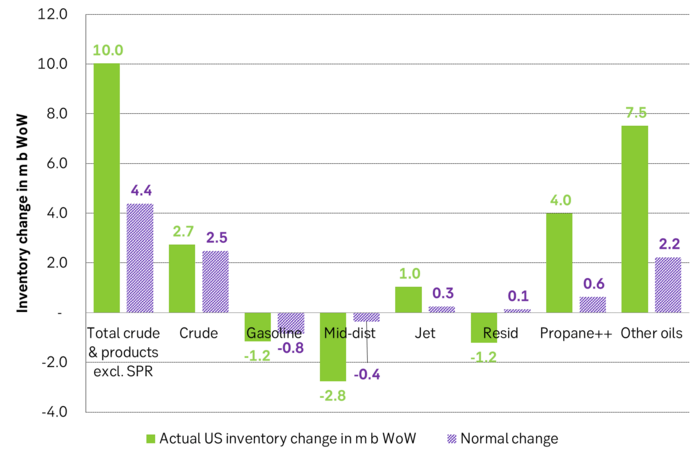
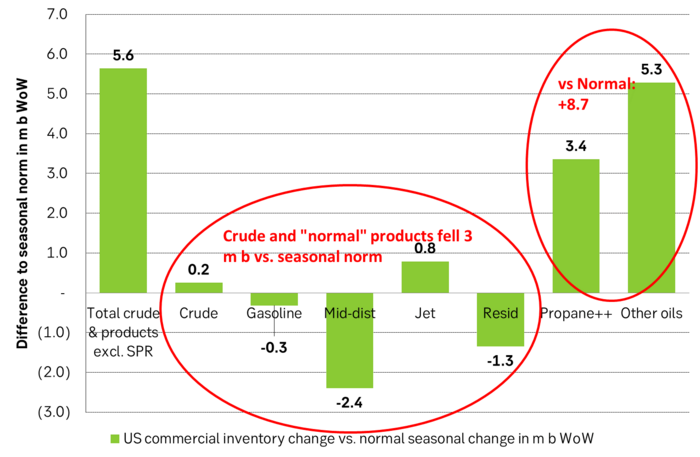
Take actual changes minus normal seasonal changes we find that US commercial crude and regular products like diesel, gasoline, jet and bunker oil actually fell 3 m b versus normal change.
Historically positive Nat gas to EUA correlation will likely switch to negative in 2026/27 onward
Historically there has been a strong, positive correlation between EUAs and nat gas prices. That correlation is still fully intact and possibly even stronger than ever as traders increasingly takes this correlation as a given with possible amplification through trading action.
The correlation broke down in 2022 as nat gas prices went ballistic but overall the relationship has been very strong for quite a few years.
The correlation between nat gas and EUAs should be positive as long as there is a dynamical mix of coal and gas in EU power sector and the EUA market is neither too tight nor too weak:
Nat gas price UP => ”you go black” by using more coal => higher emissions => EUA price UP
But in the future we’ll go beyond the dynamically capacity to flex between nat gas and coal. As the EUA price moves yet higher along with a tightening carbon market the dynamical coal to gas flex will max out. The EUA price will then trade significantly above where this flex technically will occur. There will still be quite a few coal fired power plants running since they are needed for grid stability and supply amid constrained local grids.
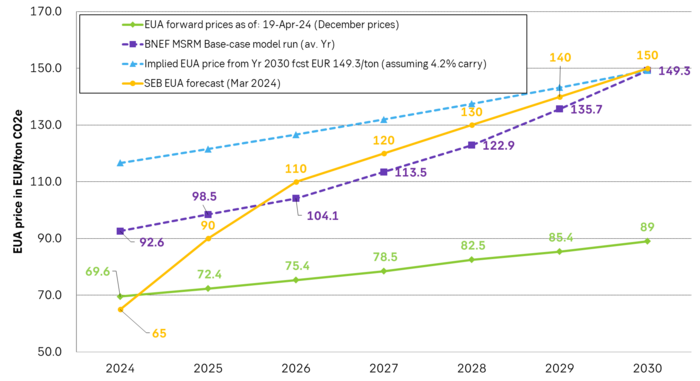
As it looks now we still have such overall coal to gas flex in 2024 and partially in 2025, but come 2026 it could be all maxed out. At least if we look at implied pricing on the forward curves where the forward EUA price for 2026 and 2027 are trading way above technical coal to gas differentials. The current forward pricing implications matches well with what we theoretically expect to see as the EUA market gets tighter and marginal abatement moves from the power sector to the industrial sector. The EUA price should then trade up and way above the technical coal to gas differentials. That is also what we see in current forward prices for 2026 and 2027.
The correlation between nat gas and EUAs should then (2026/27 onward) switch from positive to negative. What is left of coal in the power mix will then no longer be dynamically involved versus nat gas and EUAs. The overall power price will then be ruled by EUA prices, nat gas prices and renewable penetration. There will be pockets with high cost power in the geographical points where there are no other alternatives than coal.
The EUA price is an added cost of energy as long as we consume fossil energy. Thus both today and in future years we’ll have the following as long as we consume fossil energy:
EUA price UP => Pain for consumers of energy => lower energy consumption, faster implementation of energy efficiency and renewable energy => lower emissions
The whole idea with the EUA price is after all that emissions goes down when the EUA price goes up. Either due to reduced energy consumption directly, accelerated energy efficiency measures or faster switch to renewable energy etc.
Let’s say that the coal to gas flex is maxed out with an EUA price way above the technical coal to gas differentials in 2026/27 and later. If the nat gas price then goes up it will no longer be an option to ”go black” and use more coal as the distance to that is too far away price vise due to a tight carbon market and a high EUA price. We’ll then instead have that:
Nat gas higher => higher energy costs with pain for consumers => weaker nat gas / energy demand & stronger drive for energy efficiency implementation & stronger drive for more non-fossil energy => lower emissions => EUA price lower
And if nat gas prices goes down it will give an incentive to consume more nat gas and thus emit more CO2:
Cheaper nat gas => Cheaper energy costs altogether, higher energy and nat gas consumption, less energy efficiency implementations in the broader economy => emissions either goes up or falls slower than before => EUA price UP
Historical and current positive correlation between nat gas and EUA prices should thus not at all be taken for granted for ever and we do expect this correlation to switch to negative some time in 2026/27.
In the UK there is hardly any coal left at all in the power mix. There is thus no option to ”go black” and burn more coal if the nat gas price goes up. A higher nat gas price will instead inflict pain on consumers of energy and lead to lower energy consumption, lower nat gas consumption and lower emissions on the margin. There is still some positive correlation left between nat gas and UKAs but it is very weak and it could relate to correlations between power prices in the UK and the continent as well as some correlations between UKAs and EUAs.
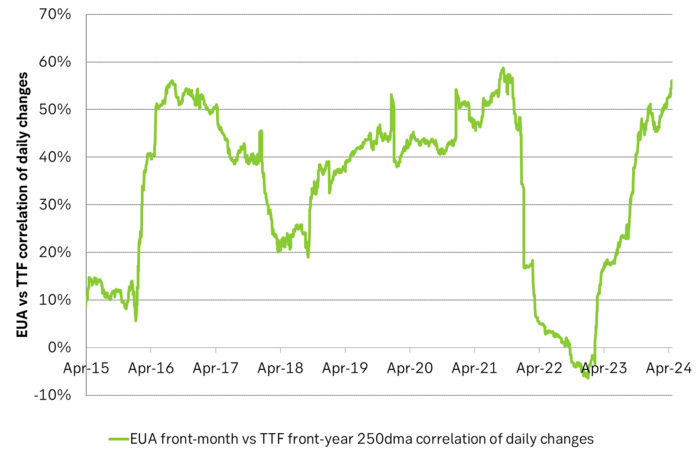
Correlation of daily changes in front month EUA prices and front-year TTF nat gas prices, 250dma correlation.
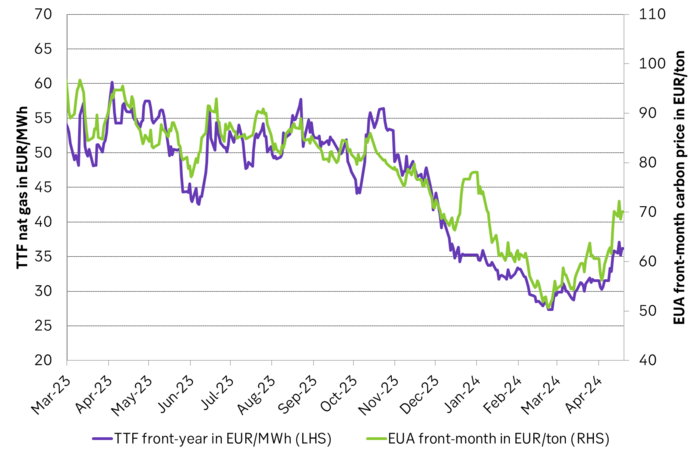
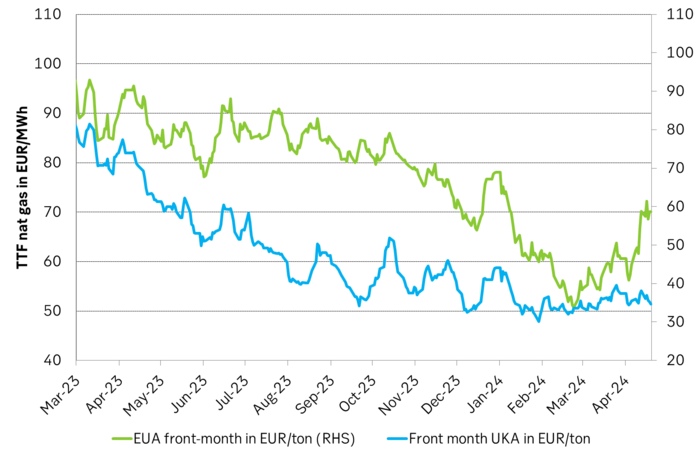
EUA price vs front-year TTF nat gas price since March 2023
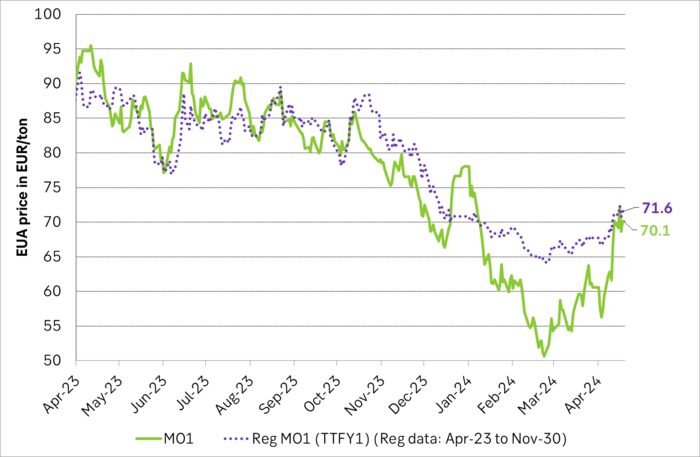
Front-month EUA price vs regression function of EUA price vs. nat gas derived from data from Apr to Nov last year.
The EUA price vs the UKA price. Correlations previously, but not much any more.
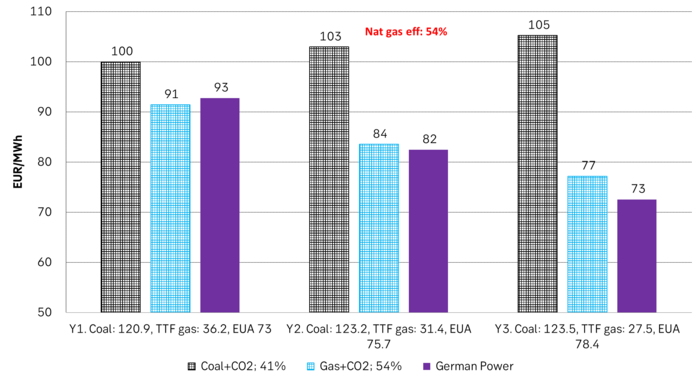
Forward German power prices versus clean cost of coal and clean cost of gas power. Coal is totally priced out vs power and nat gas on a forward 2026/27 basis.
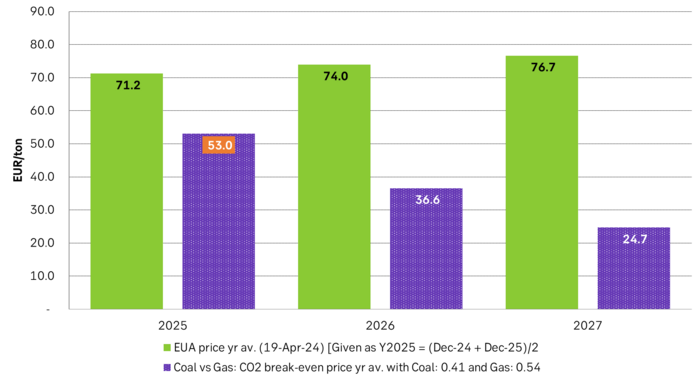
Forward price of EUAs versus technical level where dynamical coal to gas flex typically takes place. EUA price for 2026/27 is at a level where there is no longer any price dynamical interaction or flex between coal and nat gas. The EUA price should/could then start to be negatively correlated to nat gas.
Forward EAU price vs. BNEF base model run (look for new update will come in late April), SEB’s EUA price forecast.


Londons roll som ett globalt nav inom råvaruhandeln
’wait and see’ mode
Also OPEC+ wants to get compensation for inflation

Oljan letar efter en högre botten

Börsveckan ger en köprekommendation till aktien i oljeservicebolaget Beerenberg

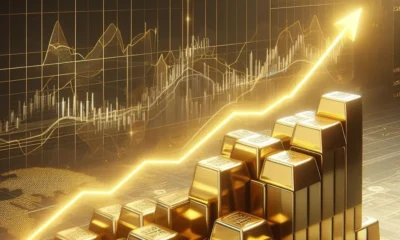
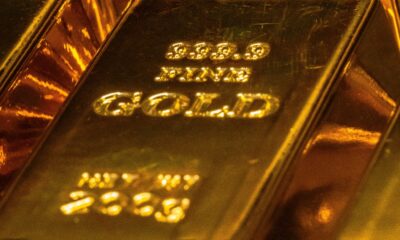
Guldpriset når nytt all time high och bryter igenom 2300 USD

USAs stigande konsumtion av naturgas

Centralbanker fortsatte att köpa guld under februari

Kakaomarknaden är extrem för tillfället

Hur mår den svenska skogsbraschen? Två favoritaktier
-
 Nyheter3 veckor sedan
Guldpriset når nytt all time high och bryter igenom 2300 USD
-
 Nyheter3 veckor sedan
USAs stigande konsumtion av naturgas
-
 Nyheter3 veckor sedan
Centralbanker fortsatte att köpa guld under februari
-
 Nyheter3 veckor sedan
Kakaomarknaden är extrem för tillfället
-
 Nyheter3 veckor sedan
Hur mår den svenska skogsbraschen? Två favoritaktier
-
 Nyheter4 veckor sedan
Boliden på 20 minuter
-

 Nyheter3 veckor sedan
Betydande underskott i utbudet av olja kan få priset att blossa upp
-

 Nyheter4 veckor sedan
Myten om guld – Den magiska metallen född från stjärnstoft
Ragnar
10 april, 2012 vid 19:00
Här kommer det ut matnyttigheter må jag säga, har gjort er sida till min startsida för jag får allt jag behöver om råvaror på ett och samma ställe. Tack för det