

Analys
SEB – Råvarukommentarer, 9 juni 2014

Rekommendationer
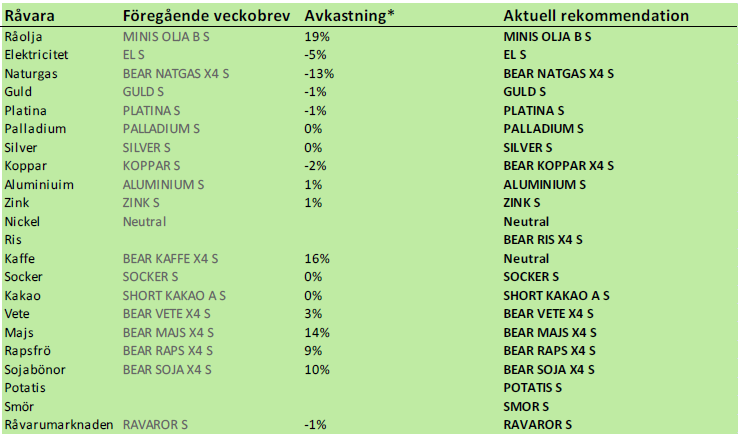
Kort sammanfattning
Den här veckan finns tre nya råvaror att placera i. Det är ris, potatis och smör. Vi rekommenderar sälj på ris, och köp på potatis och smör, alltså BEAR RIS X4 S, POTATIS S och SMOR S.
Nyheterna på kopparmarknaden är kortsiktigt negativa, men långsiktigt positiva. I övrigt var det ganska lugnt på basmetallmarknaden. På ädelmetallmarknaden noterar vi ett fall i guldpriset, men styrka i silver, platina och palladium. Vi tror att prisfallet i guld berodde på en stor säljorder vars påverkan på marknaden kanske ännu inte är slut.
Vi har sett stora prisfall på spannmål och oljeväxter. Jag tror att prisfallet fortsätter på raps och sojabönor, medan det kan bli en rekyl uppåt på vete och majs. Globalt odlingsväder är överlag bra, men priserna har justerats ner och det börjar dyka upp orosmoln på väderhimlen.
Råolja – Brent
Marknadsbedömare har den senaste tiden varit tämligen positiva till olja, som dock genbördat genom att sjunka i pris. Oljepriset tycks vara stadigt etablerat inom ett intervall om 105 – 112 dollar per fat.
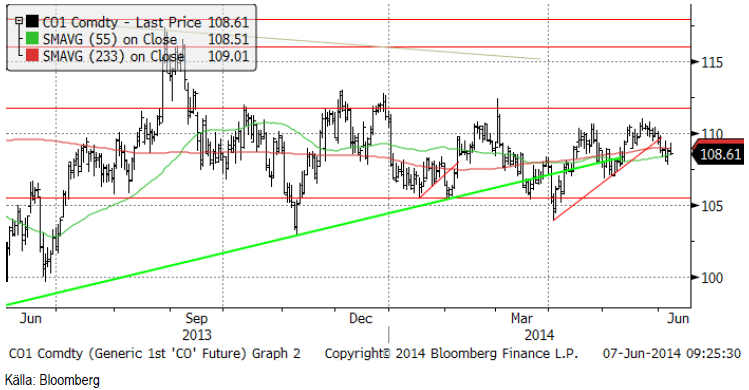
Råoljelagren fortsätter att minska, enligt säsongens kända mönster. Lagren är dock i nivå med förra årets rekordhöga nivåer.
Vi rekommenderar en kort position i olja, t ex med MINIS OLJA B S eller MINIS OLJA A S.
Elektricitet
Fjärde kvartalets eltermin får vi studera nu, när certifikatens underliggande terminskontrakt är rullat in i den. Nedan ser vi ett kursdiagram. Brottet uppåt följdes inte av en ny trend uppåt, utan var en ur teknisk synvinkel så kallat falskt utbrott. Besvikelsen över sådana brukar kunna leda till en (över) reaktion åt andra hållet, i det här fallet nedåt. Vi har sett marknaden sjunka förra veckan och stöd finns precis under. Skulle detta brytas, kan vi nog få en lite längre nedgång kanske mot 31 euro från 32.26 i fredags.
GFS-prognosen för nederbörden de kommande två veckorna visar som vi ser nedan under Odlingsväder, ökad nederbörd över de norska och svenska fjällen.
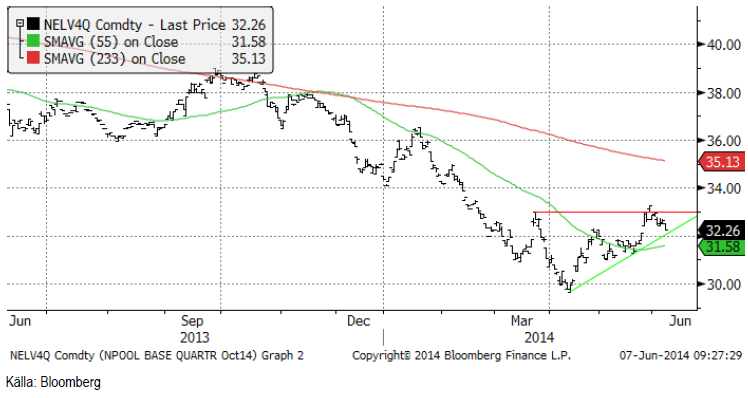
Vi behåller köprekommendationen, men skulle det tekniska stödet (grön linje i diagrammet ovan) brytas, går vi över till neutral.
Naturgas
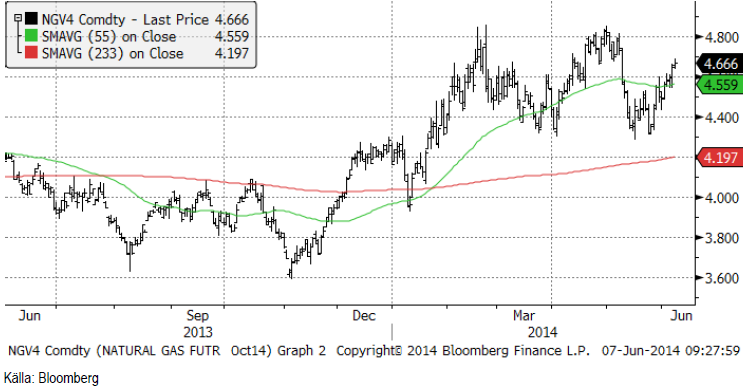
Vi lämnar nu julikontraktet på naturgas och tittar på oktoberkontraktet, NGV4. Detta ser ut att vara på väg uppåt, kanske till 4.80 dollar per MMBtu. Där tror vi det kan vara läge att sälja naturgas.
Koppar
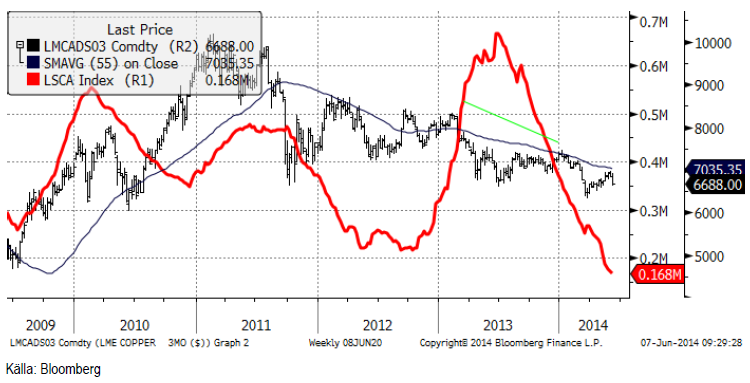
Tremånadersterminen föll med 2% i veckan som gick. Orsaken är att hamnen i Qingdao i Kina har inlett undersökning av metall som är pantsatt som säkerhet för de ”finansieringsaffärer”. Misstanken är att metall i lager pantsatts i mer än en finansieringsaffär. Det är mycket populärt att belåna råvaror i lager i Kina och stora mängder råvaror, allt från sojabönor till järnmalm är lagrade mot billig finansiering på det här sättet. Det är något förvånande att detta sker, eftersom det inte finns något terminspåslag i flera av de här råvarorna längre. Det borde alltså inte gå att tjäna pengar på att låna pengar, köpa metall och sälja den på termin. Undersökningen av hamnen i Qingdao kanske är början på slutet på den här metallefterfrågan – och det fick alltså kopparmarknaden på fall. Ungefär 1 miljon ton koppar kan ligga ”låst” i kinesiska finansieringsaffärer (utanför LME:s och Shanghaibörsens lager) enligt Goldman Sachs.
Den andra stora nyheten på kopparmarknaden har mer långsiktiga implikationer. Chefen för det chilenska statliga koppargruvebolaget Codelco fick sparken av styrelsen i veckan som gick. Styrelsen representerar den nya socialistiska regeringen som tillträdde i april under ledning av Bachelet. VD:n för Codelco Thomas Keller som tillträdde för två år sedan ville effektivisera gruvdriften, hålla lönekostnaderna under kontroll och genomföra det största investeringsprogrammet sedan Codelco bildades 1976 med syfte att behålla produktionen intakt. Bland annat ville han utveckla underjordsdrift vid dagbrottsgruvan Chuquicamata, en gruva som dåvarande presidenten Salvador Allende exproprierade (stal med andra ord) år 1971 från de båda amerikanska gruvbolagen Anaconda Corp och Kennecott Corp.
Vinsterna från Codelco (med av ovan beskrivna förklarliga skäl lågt ”capex”) har till mindre del gått till återinvestering i gruvproduktionen. Huvuddelen har gått till sociala projekt i landet och en viss del har fonderats, på liknande sätt som många oljeländer gjort. Priset på koppar har dock sedan 2011 fallit så lågt att Codelco bara nätt och jämnt går runt, vilket skapat en politiskt svår situation. Den nya regeringen prioriterar uppenbarligen ett kassaflöde från bolaget på bekostnad av framtida intäkter.
Detta borde återspegla sig i högre terminspriser för leverans i framtiden.
Av dessa två nyheter i veckan, är Kinas undersökning av finansieringsaffärerna kortsiktigt negativ, men den Chilenska historien positiv. Det innebär, tycker vi, att man ska utnyttja kortsiktig svaghet i marknaden till att gå lång.
Tekniskt ser det ut som kopparmarknadens uppgång är över. Det är möjligt att priset faller ner till botten för året och testar den nivån. Kortsiktigt bör man undvika att sälja och vi rekommenderar neutral eller en kort position i t ex BEAR KOPPAR X4 S.
Aluminium
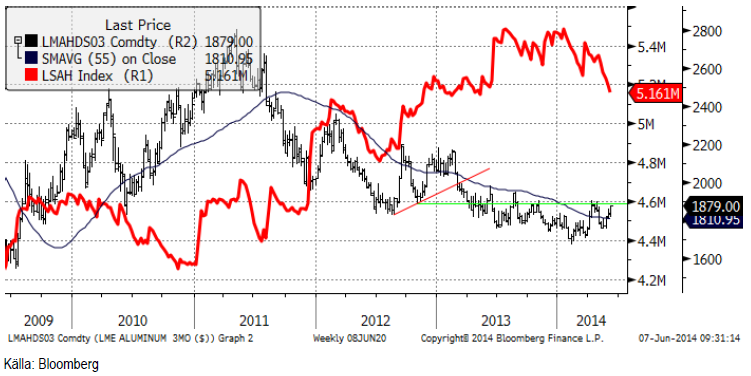
Aluminium har tagit sig upp till motståndet vid 1900 dollar per ton. Lagren vid LME minskar kraftigt, men från mycket hög nivå.
Vi fortsätter alltså med köprekommendation på ALUMINIUM S.
Zink
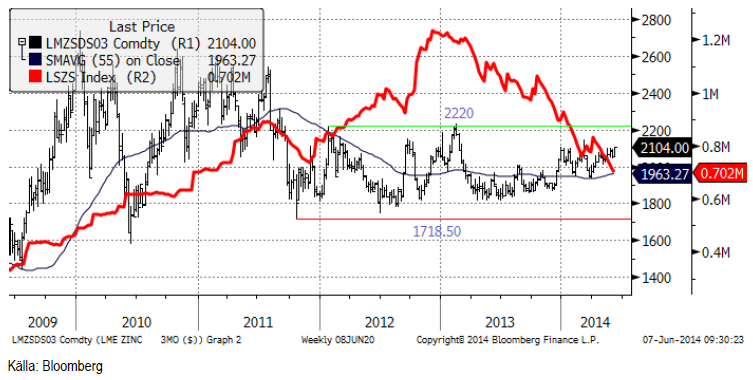
Zinkmarknaden stärktes i veckan som gick, samtidigt som lagren fortsatte falla. Vi behåller köprekommendationen på zink och rekommendationen av ZINK S.
Nickel
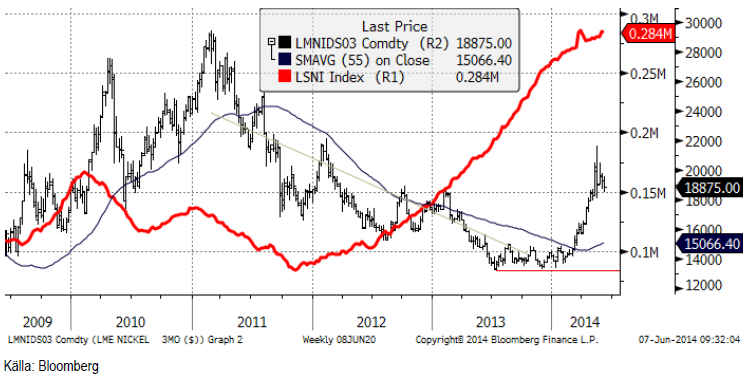
Nedan ser vi hur nickelpriset utvecklat sig de senaste fem åren. Efter den uppgång som blev följden av Indonesiens exportstopp, har marknaden lugnat ner sig. Även om exportstoppet innebar att den traditionella metoden att tillverka rostfritt stål som innebär priser på minst 16,000 dollar per ton på nickel är motiverat, har priset kommit upp så pass mycket att det i det korta perspektivet kan ha en del fallhöjd på 18,875 dollar per ton. Den lugna marknaden kanske bara är lugnet före stormen igen, så vi väljer att hålla fast vid förra veckobrevets neutral-rekommendation.
Guld
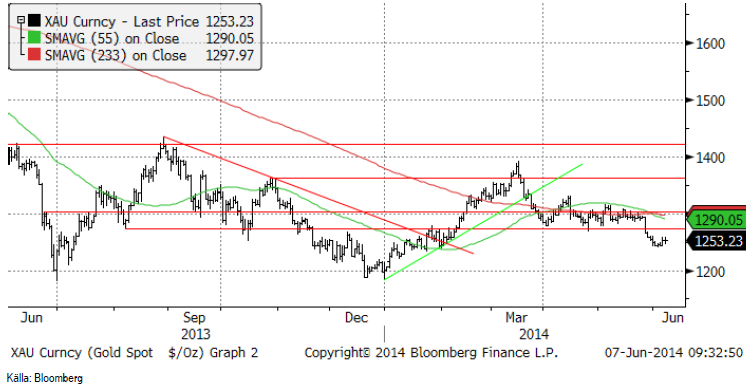
Guldmarknaden föll kraftigt för en dryg vecka sedan. Beteendet i marknaden tyder på att det var en stor försäljning från någon aktör, troligtvis en spekulant, eftersom både guld och platina påverkades samtidigt, men bara de två. Silver och palladium påverkades inte alls vid detta tillfälle. Vi tror inte att det var ett gruvbolag som sålde, eftersom de normalt sett inte prissäkrar och vanligtvis inte producerar både guld och platina. Vi tror alltså att nedgången från 1300 på guldet beror på ”market impact” från en kundorder. Frågan är om denna ”market impact” är historia nu, eller om det finns ytterligare lite nedsida.
När ECB sänkte räntan till negativ (men behöll reporäntan över nollan) i veckan, fick det guldpriset att stiga – i dollar. Euron föll först kraftigt mot dollarn men återhämtade sig sedan helt. Att guldpriset steg beror på att det finns de som tolkade ECB:s beslut som att ECB inte riktigt har kontroll över situationen i EU. Budgetunderskottet i t ex Frankrike beter sig precis som för ett år sedan, nästan exakt. Det syns alltså inte alls några tecken på någon sparsamhet. Räntorna i Spanien och Italien är dock tillbaka nere på riktigt låga nivåer, som om allt var säkert igen. Några i guldmarknaden tyckte inte det, och handlade upp guldet i torsdags och fredags.
Vi tycker inte att något har förändrats i grund och botten och är fortsatt försiktigt positiva till guldet.
Vi rekommenderar köp av GULD S.
Silver
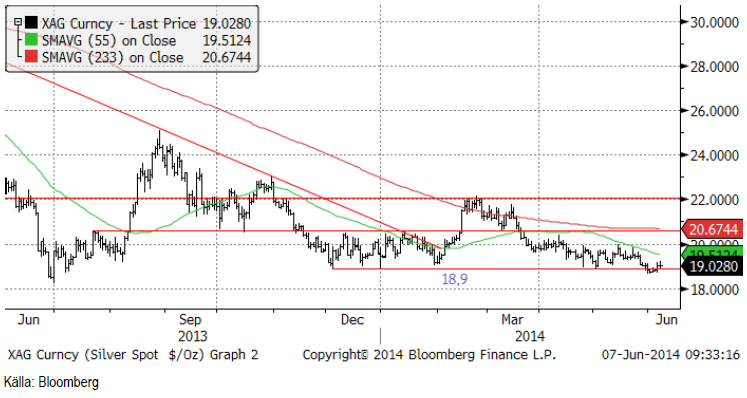
Silverpriset gick ner till stödet på 18.90 dollar per uns. Trots ett litet genombrott, föll inte priset, utan fyndköpare kom in och lyfte upp marknaden i samband med ECB:s räntebeslut. Vi tror att det var rätt och att man bör köpa silver nu.
Nedan ser vi ett diagram över priset på guld uttryckt i silver. Silver, som är billigt i förhållande till guld, har vunnit mark i förhållande till guldet. Vi tycker dock fortfarande att silver är mer köpvärt än guld.
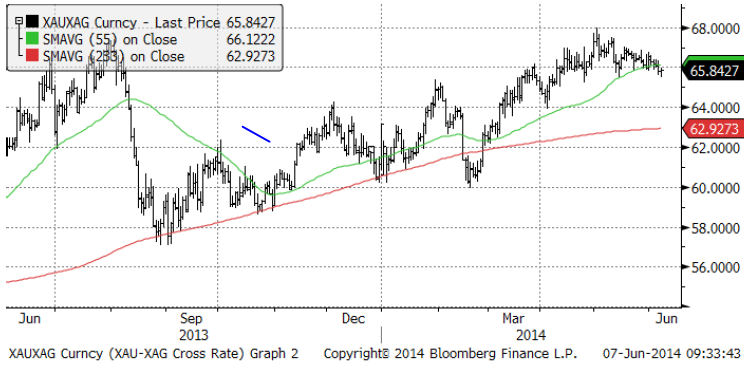
Vi anser att silver är mer köpvärt än guld och skulle vilja köpa på de här nivåerna. Vi rekommenderar köp av SILVER S.
Platina & Palladium
Strejkerna pågår fortfarande i Sydafrika. ECB-beslutet fick priset på platina att vända uppåt. Vi är fortsatt positiva till platina.
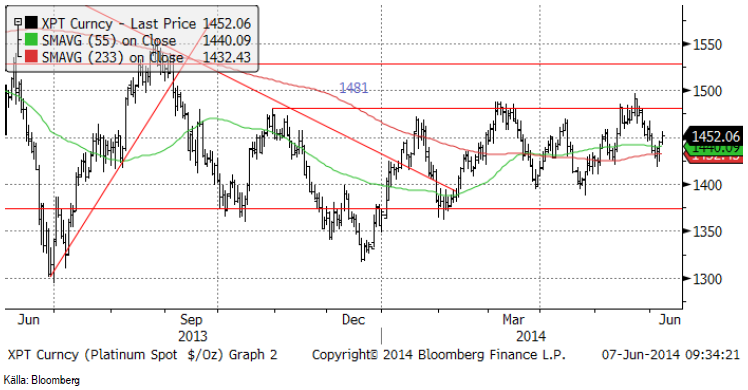
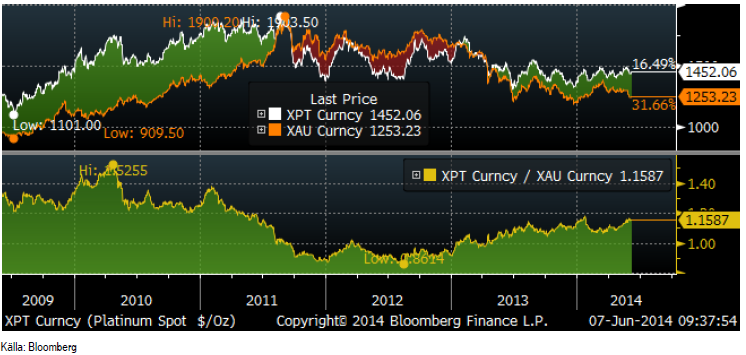
I diagrammet nedan ser vi hur platinapriset utvecklat sig i förhållande till guldpriset. Sedan 2012 har platina varit en bättre placering än guld.
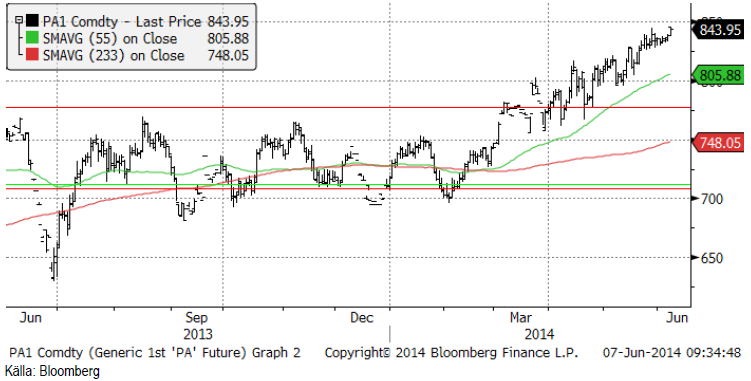
Prisdiagrammet på palladium ser vi nedan. Analytikern William Tankard från GFMS sade vid ett lunchseminarium på SEB att han trodde att palladium skulle handlas på samma nivå som platina om några år.
Nedanför ser vi fem års historik på skillnaden mellan platina och palladium. Vi ser att platina har gått från att vara 5 gånger dyrare än palladium. Just nu är försprånget 72%, men GFMS väntar sig att detta ska försvinna helt inom några år.
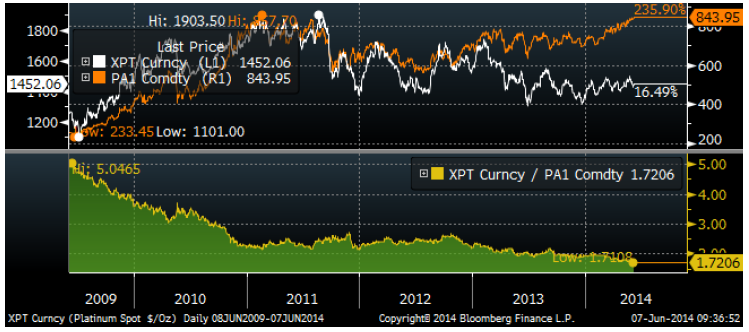
Vi rekommenderar köp av PLATINA S och PALLADIUM S.
Ris
Priset på ris (novemberkontraktet på CME) inledde juni månad med ett kraftigt prisfall från 14.50 till 14 cent per pund. Bakom ligger statistik om hög produktion både i Thailand och att USA:s ris är i utmärkt kondition.
Thailands export av ris under 2014 kommer att stiga till 9 miljoner ton enligt estimat från Thai Rice Exporters Association. I februari estimerades exporten till 7.5 miljoner ton. Om detta besannas kommer Thailand att gå om Indien som världens största exportör av ris.
USA:s risskörd var enligt crop condition-rapporten i månadags till 69% i good/excellent kondition.
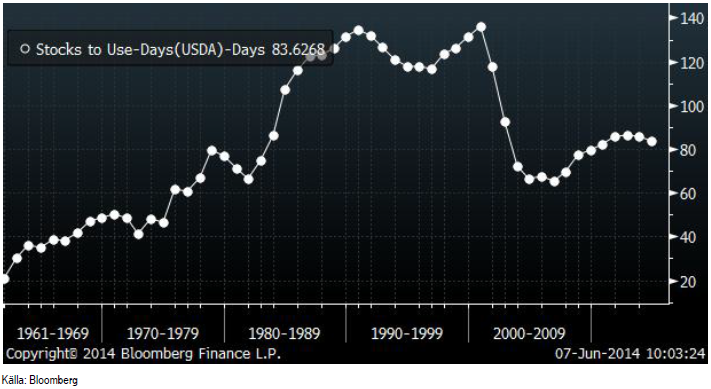
Globala lager innan årets skörd på norra halvklotet kommer redan att vara på den högsta nivån på 12 år enligt USDA:s senaste WASDE-rapport förra månaden. Priset på 5% brutna korn Thailändskt vitt ris, den asiatiska marknadens bechmark, har fallit med 28% det senaste året och med 62% från pristoppen år 2008.
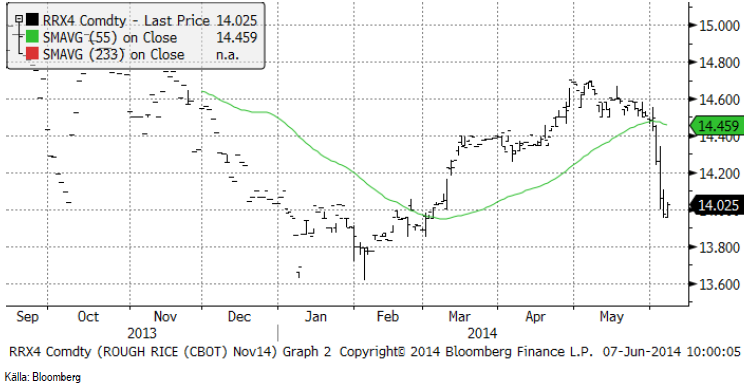
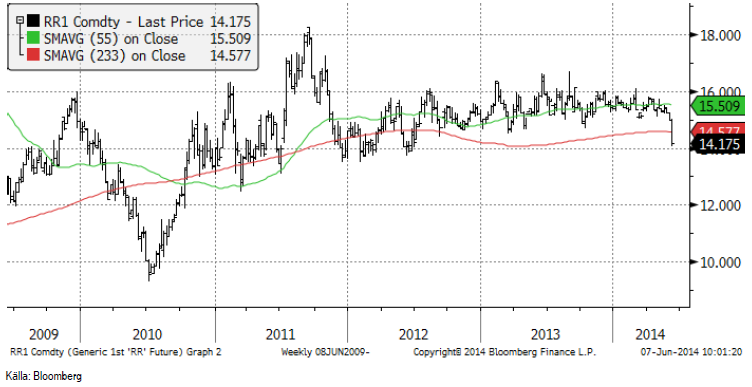
Nedan ser vi ett veckochart över prisutvecklingen de senaste fem åren. Som vi ser har priset varit ganska stabilt ända fram till förra veckan.
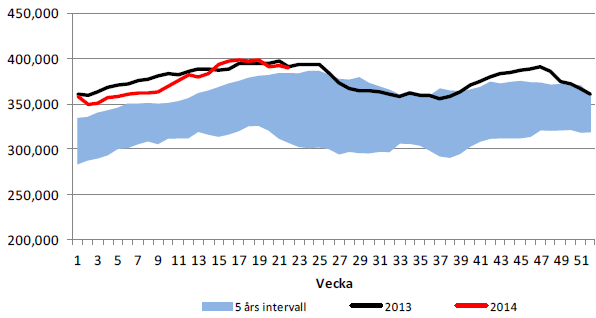
Nedan ser vi globala utgående lager i antal dagars konsumtion. Den sista punkten är baserad på estimatet i den senaste WASDE-rapporten från USDA (förra månaden).
Vi inleder bevakningen av rismarknaden med att rekommendera köp av BEAR RIS X4 S.
Kaffe
Den brasilianska kaffeskörden som började lite smått i april är nu i full fart. ”Vädret är idealiskt för att skörda, torka och rensa” rapporterar Flavour Coffee från Rio. Kaffebönderna har sålt en hel del av skörden, och det rapporteras från lokala firmor att de i veckan varit mindre intresserade av att sälja, eftersom priset gått ner.
Jordbruksdepartementet i Brasilien sade i tisdags att de första skörderapporterna tyder på att skörden kan bli högre än de 44.6 miljoner säckar som CONAB rapporterade vid förra månadens uppdatering av estimatet. Nederbörden den senaste månaden tycks ha minskat skadeverkningarna av torkan som drabbade Minas Gerais och Espirito Santo i januari och februari, den värsta torkan på 50 år. Jordbruksministern sade också att odlarna har tagit väl hand om sina kaffeträd, så Brasilien får en rekordskörd nästa år”.
Det finns också nyheter som är mer positiva för priset. Volcafé publicerade en rapport i veckan med ett estimat att kaffemarknaden går mot ett underskott på 11.3 miljoner säckar för marknadsföringsåret 2014/15, vilket huvudsakligen beror på den lägre produktionen av arabica i Brasilien. De estimerar att lagren faller från 51.5 miljoner säckar 2013/14 till 40.2 miljoner. Global produktion sjunker från 153.4 miljoner säckar 2013/14 till 140.2 miljoner säckar 2014/15. Samtidigt stiger konsumtionen från 148.7 till 151.5 miljoner säckar. Volcafé avslutar rapporten med att säga att kaffeefterfrågan stiger så fort att lagren vid slutet av 2014/15 kommer att vara på historiskt låga nivåer. Volcafés analytiker heter Kona Haque och vi har stort förtroende för henne, men hon har också haft en tendens att extrapolera trender lite för länge. T ex höll hon kvar säljrekommendationen på kaffe ganska länge i vintras, när andra började köpa för att kaffe var billigt i ett fundamentalt perspektiv.
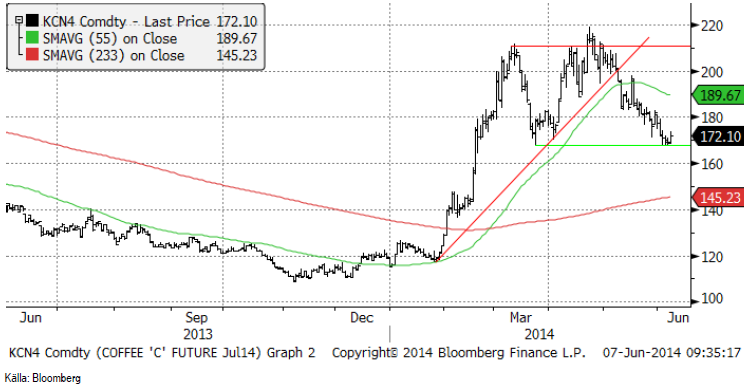
Tekniskt har stödet vid 168 cent hållit för juli-terminen och fredagens handel innebar kanske starten på en rekyl uppåt. Prisuppgången på kaffemarknaden har inte riktigt slagit igenom i konsumentledet och därmed inte heller påverkat konsumtionen, trots att det nästan är ett halvår sedan torkan drabbade Brasilien. Om det stämmer att bönderna inte vill sälja (just nu) vid 170 cent, så kanske priset kan gå upp lite grand.
Vi har haft en försiktig säljrekommendation, men går nu över till neutral.
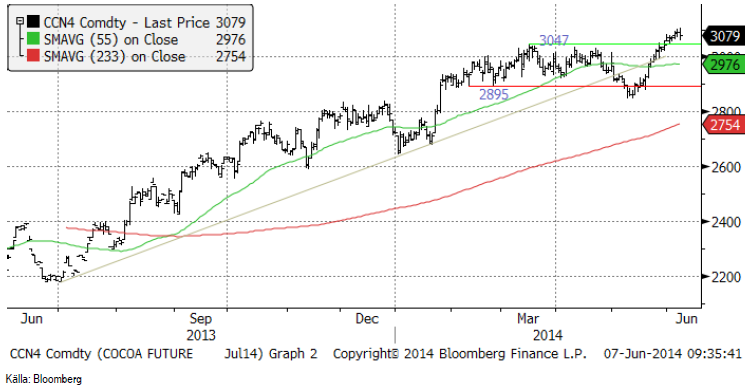
Kakao
Det höga priset på kakao lockar fram mer produktion och export. Indonesia Cocoa Association rapporterade i måndags (2 juni) att exporten från Sulawesi ökar från 3,919.8 ton i maj, upp från 3867.4 ton i april. Sulawesi står för huvuddelen av Indonesiens kakaoproduktion och Indonesien är världens tredje största producent efter Ghana och Elfenbenskusten.
Även från Ghana, världens näst största producent kom statistik på ökad produktion, upp med 5.9% till 900,000 ton, den högsta nivån på tre år. Perioden avser året som slutar den 30 september. Det tidigare estimatet på årets produktion var 850,000 ton.
Vi rekommenderar köp av SHORT KAKAO A S, som har en hävstång strax under -1.
Läs även SEB Jordbruksprodukter för fler analyser.
[box]SEB Veckobrev Veckans råvarukommentar är producerat av SEB Merchant Banking och publiceras i samarbete och med tillstånd på Råvarumarknaden.se[/box]
Disclaimer
The information in this document has been compiled by SEB Merchant Banking, a division within Skandinaviska Enskilda Banken AB (publ) (“SEB”).
Opinions contained in this report represent the bank’s present opinion only and are subject to change without notice. All information contained in this report has been compiled in good faith from sources believed to be reliable. However, no representation or warranty, expressed or implied, is made with respect to the completeness or accuracy of its contents and the information is not to be relied upon as authoritative. Anyone considering taking actions based upon the content of this document is urged to base his or her investment decisions upon such investigations as he or she deems necessary. This document is being provided as information only, and no specific actions are being solicited as a result of it; to the extent permitted by law, no liability whatsoever is accepted for any direct or consequential loss arising from use of this document or its contents.
About SEB
SEB is a public company incorporated in Stockholm, Sweden, with limited liability. It is a participant at major Nordic and other European Regulated Markets and Multilateral Trading Facilities (as well as some non-European equivalent markets) for trading in financial instruments, such as markets operated by NASDAQ OMX, NYSE Euronext, London Stock Exchange, Deutsche Börse, Swiss Exchanges, Turquoise and Chi-X. SEB is authorized and regulated by Finansinspektionen in Sweden; it is authorized and subject to limited regulation by the Financial Services Authority for the conduct of designated investment business in the UK, and is subject to the provisions of relevant regulators in all other jurisdictions where SEB conducts operations. SEB Merchant Banking. All rights reserved.

When it starts to move lower it moves rather quickly. Gaza, China, IEA. Brent crude is down 2.1% today to $62/b after having traded as high as $66.58/b last Thursday and above $70/b in late September. The sell-off follows the truce/peace in Gaze, a flareup in US-China trade and yet another bearish oil outlook from the IEA.

A lasting peace in Gaze could drive crude oil at sea to onshore stocks. A lasting peace in Gaza would probably calm down the Houthis and thus allow more normal shipments of crude oil to sail through the Suez Canal, the Red Sea and out through the Bab-el-Mandeb Strait. Crude oil at sea has risen from 48 mb in April to now 91 mb versus a pre-Covid normal of about 50-60 mb. The rise to 91 mb is probably the result of crude sailing around Africa to be shot to pieces by the Houthis. If sailings were to normalize through the Suez Canal, then it could free up some 40 mb in transit at sea moving onshore into stocks.
The US-China trade conflict is of course bearish for demand if it continues.
Bearish IEA yet again. Getting closer to 2026. Credibility rises. We expect OPEC to cut end of 2025. The bearish monthly report from the IEA is what it is, but the closer we get to 2026, the more likely the IEA is of being ball-park right in its outlook. In its monthly report today the IEA estimates that the need for crude oil from OPEC in 2026 will be 25.4 mb/d versus production by the group in September of 29.1 mb/d. The group thus needs to do some serious cutting at the end of 2025 if it wants to keep the market balanced and avoid inventories from skyrocketing. Given that IEA is correct that is. We do however expect OPEC to implement cuts to avoid a large increase in inventories in Q1-26. The group will probably revert to cuts either at its early December meeting when they discuss production for January or in early January when they discuss production for February. The oil price will likely head yet lower until the group reverts to cuts.
Dubai: The Mid-East anchor dragging crude oil lower. Surplus emerging in Mid-East pricing. Crude oil prices held surprisingly strong all through the summer. A sign and a key source of that strength came from the strength in the front-end backwardation of the Dubai crude oil curve. It held out strong from mid-June and all until late September with an average 1-3mth time-spread premium of $1.8/b from mid-June to end of September. The 1-3mth time-spreads for Brent and WTI however were in steady deterioration from late June while their flat prices probably were held up by the strength coming from the Persian Gulf. Then in late September the strength in the Dubai curve suddenly collapsed. Since the start of October it has been weaker than both the Brent and the WTI curves. The Dubai 1-3mth time-spread now only stands at $0.25/b. The Middle East is now exporting more as it is producing more and also consuming less following elevated summer crude burn for power (Aircon) etc.
The only bear-element missing is a sudden and solid rise in OECD stocks. The only thing that is missing for the bear-case everyone have been waiting for is a solid, visible rise in OECD stocks in general and US oil stocks specifically. So watch out for US API indications tomorrow and official US oil inventories on Thursday.
No sign of any kind of fire-sale of oil from Saudi Arabia yet. To what we can see, Saudi Arabia is not at all struggling to sell its oil. It only lowered its Official Selling Prices (OSPs) to Asia marginally for November. A surplus market + Saudi determination to sell its oil to the market would normally lead to a sharp lowering of Saudi OSPs to Asia. Not yet at least and not for November.
The 5yr contract close to fixed at $68/b. Of importance with respect to how far down oil can/will go. When the oil market moves into a surplus then the spot price starts to trade in a large discount to the 5yr contract. Typically $10-15/b below the 5yr contract on average in bear-years (2009, 2015, 2016, 2020). But the 5yr contract is usually pulled lower as well thus making this approach a moving target. But the 5yr contract price has now been rock solidly been pegged to $68/b since 2022. And in the 2022 bull-year (Brent spot average $99/b), the 5yr contract only went to $72/b on average. If we assume that the same goes for the downside and that 2026 is a bear-year then the 5yr goes to $64/b while the spot is trading at a $10-15/b discount to that. That would imply an average spot price next year of $49-54/b. But that is if OPEC doesn’t revert to cuts and instead keeps production flowing. We think OPEC(+) will trim/cut production as needed into 2026 to prevent a huge build-up in global oil stocks and a crash in prices. But for now we are still heading lower. Into the $50ies/b.
Some rebound but not much. Brent crude rebounded 1.5% yesterday to $65.47/b. This morning it is inching 0.2% up to $65.6/b. The lowest close last week was on Thursday at $64.11/b.
The curve structure is almost as week as it was before the weekend. The rebound we now have gotten post the message from OPEC+ over the weekend is to a large degree a rebound along the curve rather than much strengthening at the front-end of the curve. That part of the curve structure is almost as weak as it was last Thursday.
We are still on a weakening path. The message from OPEC+ over the weekend was we are still on a weakening path with rising supply from the group. It is just not as rapidly weakening as was feared ahead of the weekend when a quota hike of 500 kb/d/mth for November was discussed.
The Brent curve is on its way to full contango with Brent dipping into the $50ies/b. Thus the ongoing weakening we have had in the crude curve since the start of the year, and especially since early June, will continue until the Brent crude oil forward curve is in full contango along with visibly rising US and OECD oil inventories. The front-month Brent contract will then flip down towards the $60/b-line and below into the $50ies/b.
At what point will OPEC+ turn to cuts? The big question then becomes: When will OPEC+ turn around to make some cuts? At what (price) point will they choose to stabilize the market? Because for sure they will. Higher oil inventories, some more shedding of drilling rigs in US shale and Brent into the 50ies somewhere is probably where the group will step in.
There is nothing we have seen from the group so far which indicates that they will close their eyes, let the world drown in oil and the oil price crash to $40/b or below.
The message from OPEC+ is also about balance and stability. The world won’t drown in oil in 2026. The message from the group as far as we manage to interpret it is twofold: 1) Taking back market share which requires a lower price for non-OPEC+ to back off a bit, and 2) Oil market stability and balance. It is not just about 1. Thus fretting about how we are all going to drown in oil in 2026 is totally off the mark by just focusing on point 1.
When to buy cal 2026? Before Christmas when Brent hits $55/b and before OPEC+ holds its last meeting of the year which is likely to be in early December.
Brent crude oil prices have rebounded a bit along the forward curve. Not much strengthening in the structure of the curve. The front-end backwardation is not much stronger today than on its weakest level so far this year which was on Thursday last week.

The front-end backwardation fell to its weakest level so far this year on Thursday last week. A slight pickup yesterday and today, but still very close to the weakest year to date. More oil from OPEC+ in the coming months and softer demand and rising inventories. We are heading for yet softer levels.

Down to the lowest since early May. Brent crude has fallen sharply the latest four days. It closed at USD 64.11/b yesterday which is the lowest since early May. It is staging a 1.3% rebound this morning along with gains in both equities and industrial metals with an added touch of support from a softer USD on top.
What stands out the most to us this week is the collapse in the Dubai one to three months time-spread.
Dubai is medium sour crude. OPEC+ is in general medium sour crude production. Asian refineries are predominantly designed to process medium sour crude. So Dubai is the real measure of the balance between OPEC+ holding back or not versus Asian oil demand for consumption and stock building.
A sharp weakening of the front-end of the Dubai curve. The front-end of the Dubai crude curve has been holding out very solidly throughout this summer while the front-end of the Brent and WTI curves have been steadily softening. But the strength in the Dubai curve in our view was carrying the crude oil market in general. A source of strength in the crude oil market. The core of the strength.
The now finally sharp decline of the front-end of the Dubai crude curve is thus a strong shift. Weakness in the Dubai crude marker is weakness in the core of the oil market. The core which has helped to hold the oil market elevated.
Facts supports the weakening. Add in facts of Iraq lifting production from Kurdistan through Turkey. Saudi Arabia lifting production to 10 mb/d in September (normal production level) and lifting exports as well as domestic demand for oil for power for air con is fading along with summer heat. Add also in counter seasonal rise in US crude and product stocks last week. US oil stocks usually decline by 1.3 mb/week this time of year. Last week they instead rose 6.4 mb/week (+7.2 mb if including SPR). Total US commercial oil stocks are now only 2.1 mb below the 2015-19 seasonal average. US oil stocks normally decline from now to Christmas. If they instead continue to rise, then it will be strongly counter seasonal rise and will create a very strong bearish pressure on oil prices.
Will OPEC+ lift its voluntary quotas by zero, 137 kb/d, 500 kb/d or 1.5 mb/d? On Sunday of course OPEC+ will decide on how much to unwind of the remaining 1.5 mb/d of voluntary quotas for November. Will it be 137 kb/d yet again as for October? Will it be 500 kb/d as was talked about earlier this week? Or will it be a full unwind in one go of 1.5 mb/d? We think most likely now it will be at least 500 kb/d and possibly a full unwind. We discussed this in a not earlier this week: ”500 kb/d of voluntary quotas in October. But a full unwind of 1.5 mb/d”
The strength in the front-end of the Dubai curve held out through summer while Brent and WTI curve structures weakened steadily. That core strength helped to keep flat crude oil prices elevated close to the 70-line. Now also the Dubai curve has given in.

Brent crude oil forward curves

Total US commercial stocks now close to normal. Counter seasonal rise last week. Rest of year?

Total US crude and product stocks on a steady trend higher.


The Mid-East anchor dragging crude oil lower

Samtal om sällsynta jordartsmetaller, guld och silver

Brookfield köper bränsleceller för 5 miljarder USD av Bloom Energy för att driva AI-datacenter

Teck Resources kan förse Nordamerika och kanske hela G7 med all germanium som behövs

Leading Edge Materials är på rätt plats i rätt tid

Kinas elproduktion slog nytt rekord i augusti, vilket även kolkraft gjorde

Tyskland har så höga elpriser att företag inte har råd att använda elektricitet

OPEC+ missar produktionsmål, stöder oljepriserna

Ett samtal om guld, olja, fjärrvärme och förnybar energi
Brent crude ticks higher on tension, but market structure stays soft
-
 Nyheter4 veckor sedan
Kinas elproduktion slog nytt rekord i augusti, vilket även kolkraft gjorde
-
Nyheter4 veckor sedan
Tyskland har så höga elpriser att företag inte har råd att använda elektricitet
-
 Nyheter3 veckor sedan
OPEC+ missar produktionsmål, stöder oljepriserna
-
 Nyheter3 veckor sedan
Ett samtal om guld, olja, fjärrvärme och förnybar energi
-
Analys4 veckor sedan
Brent crude ticks higher on tension, but market structure stays soft
-
Analys3 veckor sedan
Are Ukraine’s attacks on Russian energy infrastructure working?
-

 Nyheter2 veckor sedan
Guld nära 4000 USD och silver 50 USD, därför kan de fortsätta stiga
-

 Nyheter3 veckor sedan
Guldpriset uppe på nya höjder, nu 3750 USD