

Analys
SEB – Råvarukommentarer, 7 januari 2014

Rekommendationer
Inledning
Precis före Julhelgen meddelade FED att man inleder ”tapering”, dvs att man minskar intensiteten i den monetära stimulansen. Istället för att trycka 1000 miljarder dollar vare år, kommer man att bara trycka 900 miljarder. De finansiella marknaderna har sedan ”tapering” – ordet yppades vid ett möte i april, präglats av oron för att perioden av massiv ökning av penningmängden skulle leda till ett slut på flödet av pengar till tillgångsmarknaderna, där pengarna parkerades. Men om man ser minskningen i expansionen som 900 miljarder dollar i ökad penningmängd istället för 1000 miljarder, så förefaller det vara nästan som att inte FED hade gjort något alls.
Milton Friedman sade en gång att ”inflation is always and everywhere a monetary phenomenon”. Det stämmer på lång sikt, men inte på kort sikt. De senaste åren har snarare präglats av Keynes ”liquidity trap”. De nytryckta pengarna har sparats i tillgångar av olika slag, istället för att konsumeras, som var FED:s målsättning. Japan är ett exempel på ett sådant land, som sedan tidigt 1990-talet inte lyckats ta sig ur fällan. Nu hade de bara ca två år kvar till bankrutt och var tvingade att devalvera valutan medan de själva kunde. Flera länder skulle nog behöva göra samma sak, men alla kan inte göra det samtidigt. Prisuppgången på råvaror under 00-talet var inte orsakat av en ökning av penningmängden, utan av en efterfrågeboom med demografiska orsaker, på samma sätt som prisrevolutioner de senaste tusen åren alltid varit orsakade av emografiska faktorer och inte av inflation. Inflation gör dock råvaror dyrare i nominella termer och kan vara en anledning till att fortsätta vara investerad i råvaror, även efter att motorn Kina bakom 00-talets boom varvade ner för ett par år sedan.
Förra året fortsatte priset på en del råvaror att gå riktigt dåligt. Dit hör t ex socker och elektricitet. Andra hade sitt första riktigt dåliga år på 12 år och dit hör guld. Några kanske står inför ett riktigt dåligt år. Dit hör kanske olja. Andra återigen, håller på att ta sig upp igen och dit hör antagligen kaffe, koppar, zink och kanske socker och elektricitet.
Råolja – Brent
Oljepriset stängde i princip på samma pris den sista december som det började året på. I torsdags och fredags föll dock priset mycket kraftigt. Vi har inte kunnat hitta en bra förklaring till detta i nyhetsflödet. Det kanske handlar om en större prissäkringsaffär, som pressar priserna. Det kanske också handlar om att FED inleder ”tapering”, vilket kan minska takten i ekonomins återhämtning – och därmed i återhämtningen i oljeefterfrågan.
DOE-statistiken i fredags visade på en större minskning av lagren i USA än förväntat på 7 miljoner fat. Det var förväntat att lagren skulle minska med 2 – 3 miljoner fat innan rapporten kom. Detta fick prisfallet att dämpas något. Det är dock helt naturligt att lagren minskas vid årsskiftet, eftersom olja som finns i lager vid årsskiftet beskattas.
En hel del av nyhetsflödet den senaste tiden har handlat om tillväxten i oljeproduktionen i USA. Att oljekonsumtionen i USA nådde en ny topp i oktober, har marknaden inte fokuserat så mycket på. Att oljeproduktionen i USA ökat till 8.12 mbpd, den högsta nivån sedan 1988 och att produktionen gått om importen för första gången sedan 1995, enligt fredagens siffror, är mer del av den mega-trend, som troligtvis kommer att prägla oljemarknaden under 2014. Importen till USA (exklusive strategiska reserver) och räknat som ett snitt över fyra veckor, var den lägsta på 16 år. Det talas nu även i Kongressen om att slopa exportförbudet avseende råolja.
Från Libyen rapporteras dock att oljehamnarna hålls stängda eftersom de blockeras av protesterande. Oljefältat Al Sharara kunde dock återöppnas den 2 januari efter att protestanter dragit sig tillbaka därifrån i två veckor. Total meddelade i fredags att man återupptar prospekteringen på Libyens territorium, efter att detta stoppats för tre år sedan när inbördeskriget bröt ut. Libyens väg tillbaka som oljeland verkar gå framåt, men under stor dramatik.
Agência Nacional do Petróleo, Gás Natural e Biocombustíveis, den brasilianska motsvarigheten till DOE, rapporterade i veckan att Brasiliens produktion av olja fortsatt att öka till lite drygt 2 mbpd i november. Det är en ökning med 1.8% i årstakt. Produktionen av gas ökade med 7.8%. Total produktion av olja och gas motsvarar drygt 2.5 mbpd och ökar med 2.9% i årstakt. Landet som sådant rapporterade också ett rekordstort bytesbalansunderskott i november, så landet har stort behov av inkomster från oljan, men en BRICs-driven efterfrågeboom rimmar sämre med den statistiken.
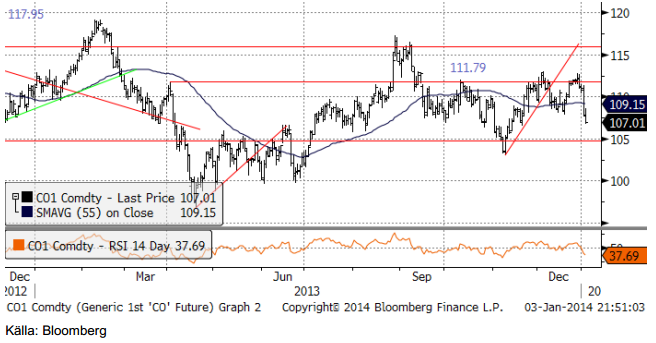
Mexikanska PEMEX redovisade sjunkande produktion för nionde året i rad, vilket understryker betydelsen av regeringens nyligen fattade beslut att sänka produktionsskatten från 99.5% och tillåta privata bolag för att vända den trenden. Ser vi till det längre perspektivet, som i diagrammet nedan, ser vi genast att triangelformationen ännu inte är bruten. Den tekniska analysen säger att när triangeln bryts, inleds en nya stor trend. Vi vet ännu inte om triangeln bryts på uppsidan, i så fall kanske motiverat av ökat global efterfrågan på olja i takt med att världsekonomin återhämtar tillväxttakten. Eller om den bryts på nedsidan, motiverat av ökande oljeproduktion. Jag tror att vi kommer att få se ett brott på nedsidan och därmed ett start på en trend med fallande priser, motiverat av allt högre produktion i världen. Men bäst är att vänta på brottet, som är mycket nära förestående.
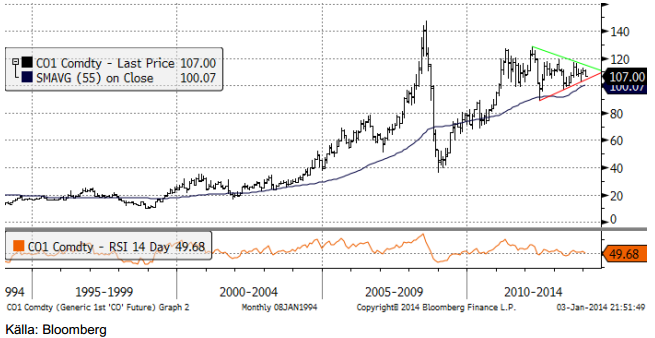
Vi lade oss neutrala i det senaste veckobrevet, men uteslöt inte ytterligare nedgång. Vi tror att priset kan gå ner ytterligare lite, inom triangelformationen, men om den då bryts, vill vi vara köpta BEAR. Vi lutar så mycket åt det hållet att vi går tillbaka till att rekommendera BEAR igen.
Du har väl sett att vi nu också har minifutures med mycket hög hävstång? MINIS OLJA B S är en ”mini short” med nästan 7 gångers hävstång på nedsidan.
Om oljepriset går ner med 1%, ökar värdet på den här mini-futuren med nästan 7% (och olyckligtvis vice versa om oljepriset stiger med 1%).
Elektricitet
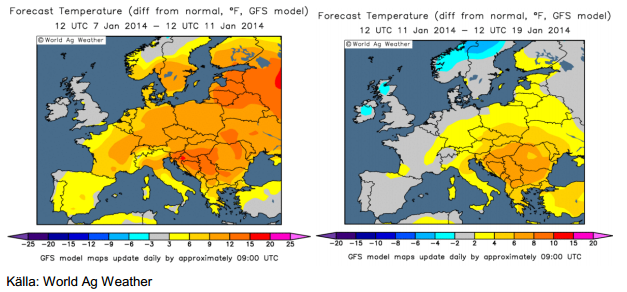
Elpriset som fallit kraftigt på det ovanligt mildra och blöta vädret i december, gick ner ytterligare från vårt förra veckobrev i mitten av december. Det nya året inleddes dock med prisuppgångar. Det börjar komma in kallare väder i prognoserna. Eftersom marknaden verkar ta så stort intryck av väder just nu, trots att det handlar om vad elpriset kommer att vara i april, maj och juni, tror vi på en prisuppgång, åtminstone som en rekyl på kort sikt, upp mot 32 euro per MWh.
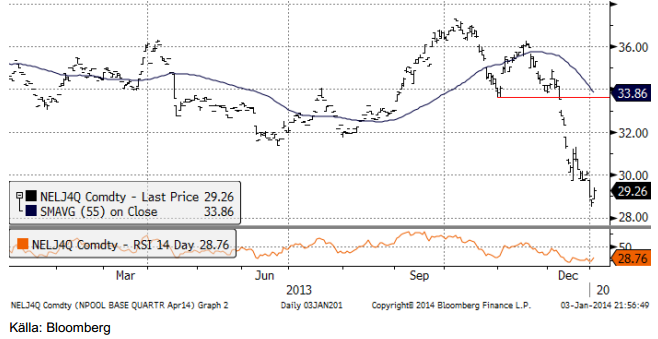
Som nämnt ovan: Det varma vädret väntas bestå under nästa vecka, men i prognosfönstret för 11 januari till 19 januari, väntas temperaturen falla till något under det normala i ”börsområdet”, dvs Norden, liksom i stora delar av Västeuropa.
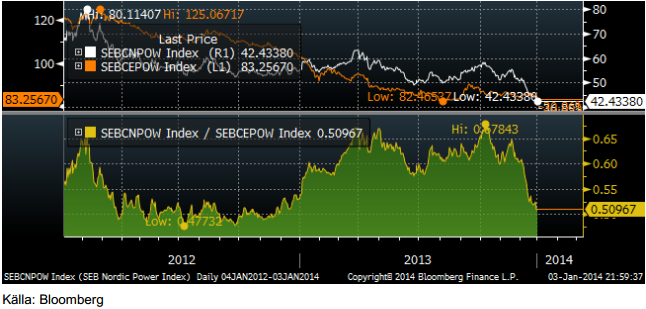
Det nordiska elpriset har fortsatt att falla i förhållande till det kontinentala elpriset. SEB har index som följer avkastningen på en investering i kvartalskontrakt på el. Indexen beräknas av NasdaqOMX. Vi ser kvoten mellan SEBCNPOW (nordiska terminer) och SEBCEPOW (kontinentala elterminer) nedan.
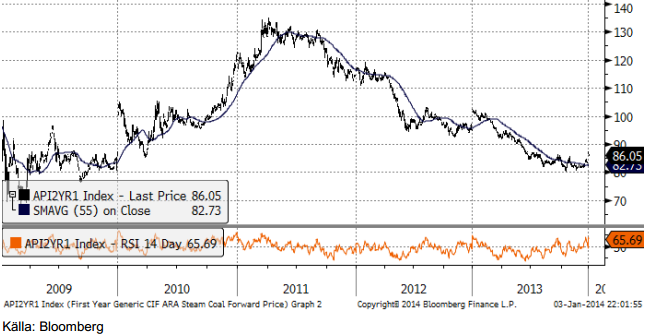
Nedan ser vi priset på energikol, det närmaste årets leveranstermin för de senaste fem åren. Notera att priset ligger lite högre nu än i december och det beror helt enkelt på att diagrammet hämtar priset från ”nästa” terminskontrakt. I december avsåg terminen leverans under 2014 och nu i januari leverans under 2015. Priset har dock, trots allt, inte gått under 80 dollar per ton under hösten, utan hållit sig över den nivån.
Vi rekommenderar köp av EL S både på lång och kort sikt.
SEB är ensam om att erbjuda mini futures på el. Mini futures har inte daglig hävstång, utan beter sig som en värdepapperiserad depå, som innehåller en del av en termin i position och kontanter. Om positionen går emot, och stop-loss utlöses, går minifuturen till förtidslösen. Samma underliggande termin som EL S.
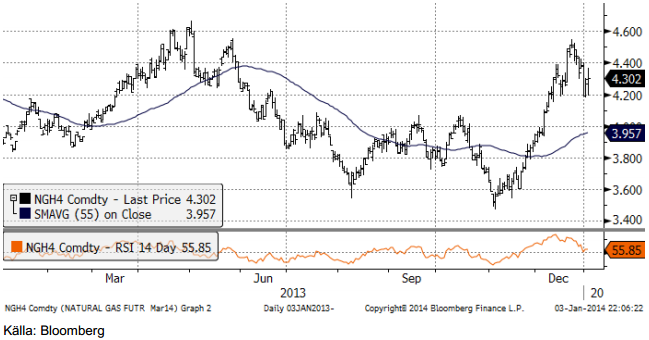
Naturgas
Naturgaspriset i USA har handlats upp på det kalla vädret. Det har varit och är just nu extremt kallt i USA, men mildare väder kom in i prognosfönstret redan för någon vecka sedan. Detta fick då priserna på terminer på naturgas att falla tillbaka.
Koppar
Kopparpriset på London Metal Exchange steg kraftigt strax innan året tog slut. Priset nådde den högsta nivån sedan före sommaren. Vi tror att prisuppgången kan fortsätta, i det korta perspektivet åtminstone till 7500 dollar / ton.
Som vi har skrivit förut, har priset varit precis över den nivå där den dominerande producenten Codelco inte gör vinst längre. Codelco kan mycket väl svara med att minska produktionen för att hålla priset på lönsam nivå. Att marknaden är nära botten på priserna är därför helt tydligt. Frågan är om de senaste dagarnas pigga handel är början på en ny uppgångsfas?
Notera också att lagren vid LME (röd linje) minskar stadigt.
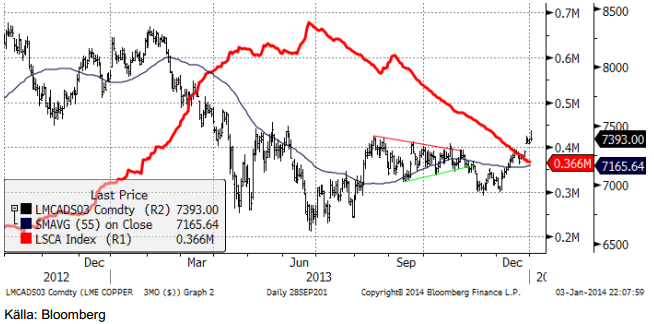
Vi rekommenderar köp av KOPPAR S.
Aluminium
Vad som sagts om koppar, gäller inte för aluminium. Lagren har fortsatt att stiga. Marknaden lider av överkapacitet på produktionssidan och Kina verkar vara nöjda med att fortsätta ha det så.
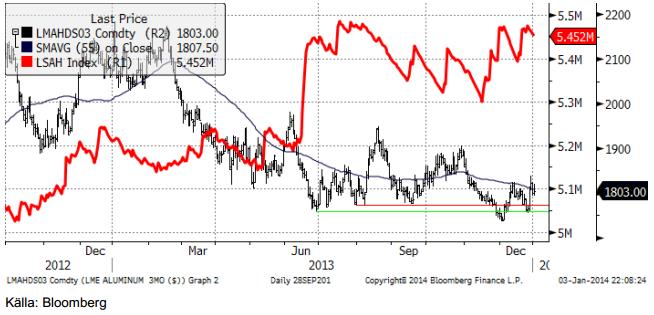
Vi fortsätter med neutral rekommendation på aluminium.
Zink
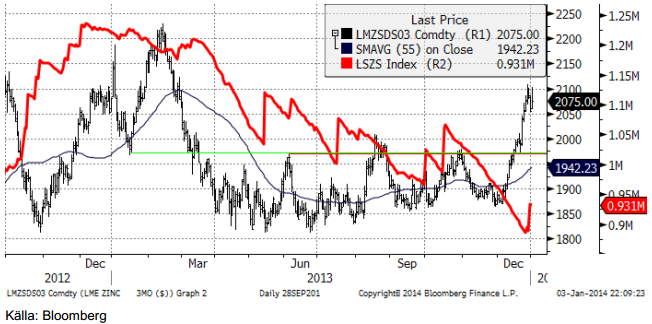
Zinkpriset har gått som en raket, från 1900 dollar till 2100 dollar på en månad. Vi tror att uppgången är klar och överdriven, så vi väljer att kliva av och lägga oss neutrala i väntan på att kunna gå in på en lägre nivå igen. Uppgången i sig, som bröt alla motstånd för sommarens konsolideringsfas, signalerar att trenden har vänt uppåt.
Vi såg en liten inleverans till LME:s lagerhus sent i december, men trenden är att lagren minskar vid LME och det tar vi fasta på. Vi är alltså positiva till zink, men vill bara komma in på bättre nivå igen.
Nickel
Till skillnad från koppar och zink har inte nickel lyckats ta sig ur sommarens konsolideringsfas. Förhoppningarna om ett indonesiskt exportstopp av nickelmalm (till Kina) har minskat. Visserligen kommer exportförbudet att införas, men det antas nu allmänt att realpolitiken kommer att medföra undantag. Landet behöver pengarna. Kinas tillverkare av rostfritt stål har också tillräckliga lager (upp till 6 månaders behov) att exporten av metall från Indonesien bör ha kommit igång när lagren är avbetade. Som vi ser av LME-lagerutvecklingen som röd kurva i diagrammet neda, fortsätter lagren av metall som ingen anser sig behöva, att öka.
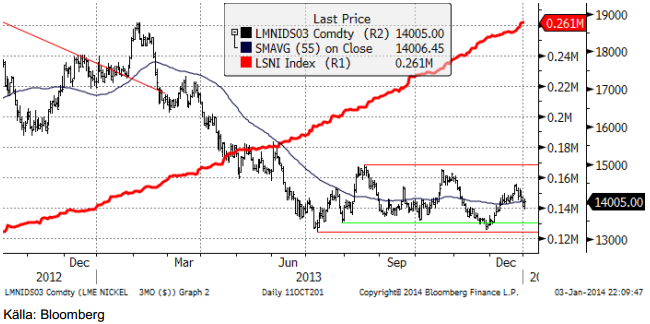
Nickel är fortfarande en metall som handlas i ett intervall, där man bör försöka köpa i botten av det intervallet, vid 13,500 dollar och sälja i det övre, vid 14,500 dollar. Priset ligger just nu nästan exakt mitt i, så då blir rekommendationen ”neutral”.
Guld
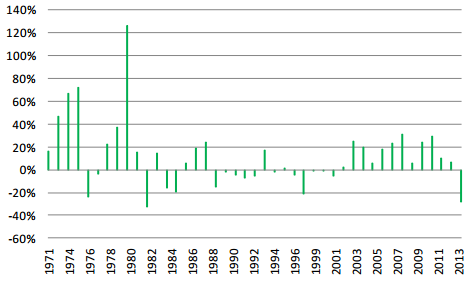
Landets flesta tidningar och etermedia har under Julhelgen rapporterat om guldprisets baisse under förra året, 2013. Nedan ser vi prisförändringen på guld per år (i dollartermer). Prisfallet under förra året på -28% är alltså det första sedan år 2000 och det största sedan 1981, när guldpriset rasade med 33%. Den gången följdes raset av en uppgång med 15%. Det är emellertid inte det typiska året efter att ett baisse-år. Det typiska är att året efter det första året med en prisnedgång också blir ett år med fallande pris. Detta har hänt fyra gånger sedan 1971. Tre gånger har nedgångsåret följts av uppgångar, men endast ett av dem, år 1982, var uppgången större än ett par procent. Historiens spår förskräcker.
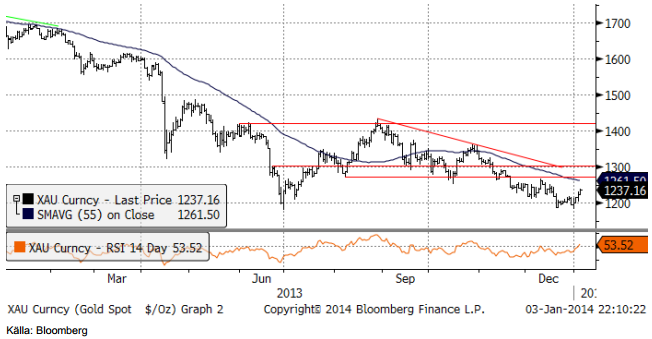
En del tycker att guld är intressant att köpa på kort sikt nu, eftersom priset är tillbaka på sommarens bottennivå vid 1200 dollar per ton. Året har också börjat med prisuppgång, men vi har ingen teknisk köpsignal, annat än att 1200 dollar har hållit. Det räcker inte för att ur teknisk synvinkel motivera en köprekommendation.
Utflödena ur börshandlade fonder på guld och silver har fortsatt. För guld har utflödet varit stadigt, men flykten från silver-ETF:er accellererade mot slutet av december.
I april började det talas om att minska den monetära stimulansen i USA. Detta kallas allmänt för ”tapering”. Den amerikanska 30-åriga obligationsräntan har sedan botten i april, när talet om ”tapering” började, gått upp från 2.8% till 3.92% i fredags. Guldpriset har fört sig spegelvänt mot ränteutvecklingen. Visserligen signalerar högre räntor också en högre framtida inflationstakt och statsskulden, men högre räntor gör också att alternativkostnaden för att investera i guld ökar.
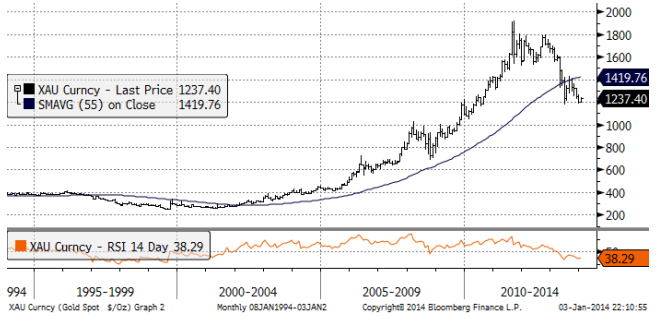
Ser vi på ett lite längre kursdiagram på guld, ser vi att 1200 dollar är ganska svagt, som tekniskt stöd betraktat. 1000 dollar ser mer ut att kunna fungera som ett riktigt stöd. Hela höstens rekyl uppåt ser i det här perspektivet ut som inget annat än en rekyl.
Vi fortsätter tills vidare med neutral vy på guld, men förbereder oss för att gå kort på riktigt igen vid ett brott av 1200 dollar på nedsidan.
Silver
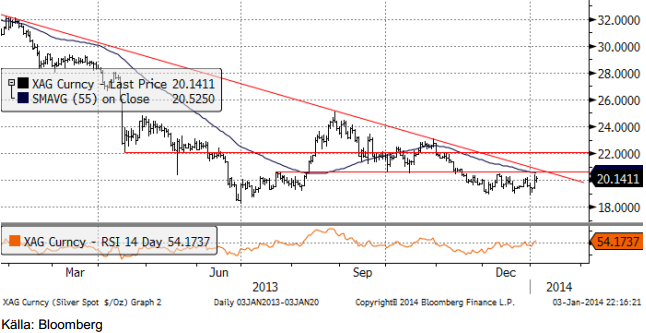
Silver har till skillnad från guld, redan nått sitt ”ordentliga stöd”, som är 1000 dollar för guld. För silver är det 20 dollar. Å andra sidan, skulle det inte vara det, får man gå ända ner till 10 dollar för att hitta nästa avgörande stöd. Vi är hellre köpare av silver idag än av guld, men vi köper som sagt inte någon av dem. Silver ligger dock väldigt nära att bryta den motståndet för den fallande pristrenden. I diagrammet över det senaste årets kursutveckling nedan ser vi den motståndslinjen som den diagonala nedåt lutande röda linjen.
Nedan ser vi prisutvecklingen i ett längre perspektiv, där 20 och 10 dollar framträder tydligt som tekniska stödnivåer.
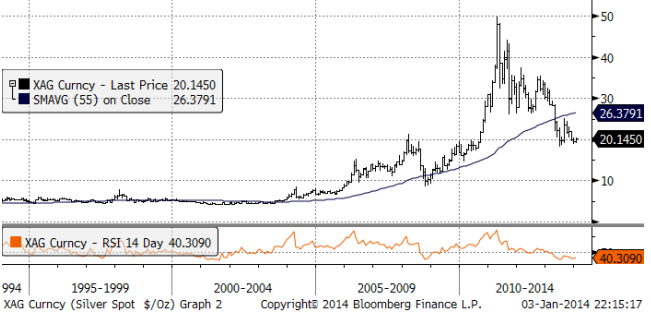
Vi går alltså över till neutral på silver. Det kan komma en prisuppgång.
Platina & Palladium
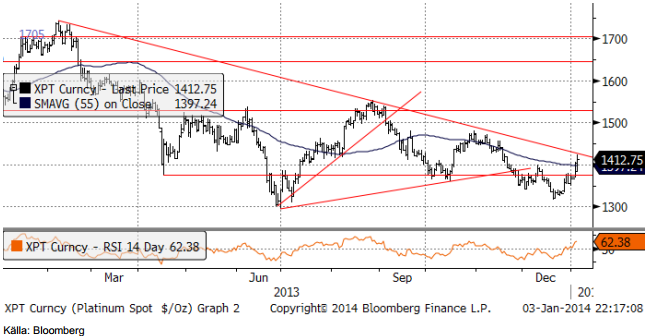
Platina uppvisar samma mönster som silver – dvs marknaden är nära ett brott av fallande trendlinje. Till den positiva, men obekräftade bilden, hör att prisfallet, som vi väntat oss efter brottet nedåt i slutet av november, inte infriades.
Palladium har fortsatt att handlas sidledes, utan någon tydlig trend alls.
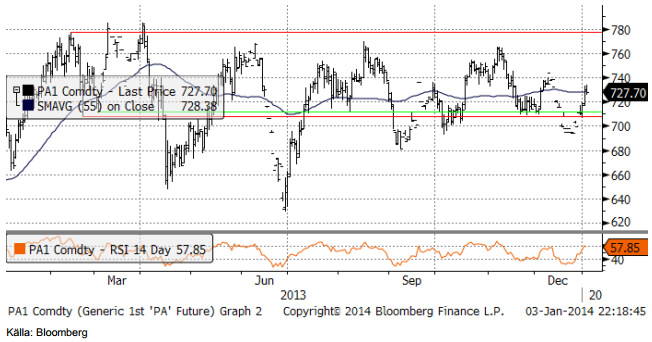
Vi behåller våra neutrala rekommendationer på palladium och platina.
Kaffe
Kaffepriset tycks ha etablerat en botten strax över 100 cent. Vi rekommenderar köp av kaffe, men vill samtidigt varna för att prisuppgångar sällan sker utan rekyler, i synnerhet inte efter att så långt prisfall som tre år. 120 cent är ett tekniskt motstånd och en naturlig nivå som man kan förvänta sig kan locka fram såväl prissäkrande producenter som köpare som vill ta hem vinster. 110 cent är antagligen en bra nivå att komma in på.
Kaffemarknaden var extremt stark i fredags och priset gick upp på ett sådant sätt som den bara kan göra med riktiga köpare i ryggen. Dynamiken är tydligt på uppsidan i marknaden.
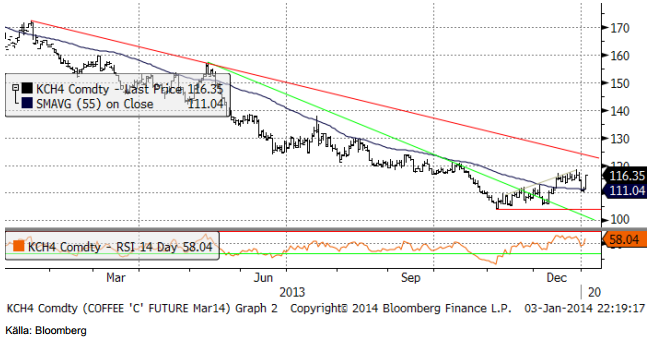
Vi rekommenderar alltså köp av KAFFE S, eller BULL KAFFE X4 S för den som vill ta mer risk.
Det finns nu också mini futures på kaffe, som erbjuder 6.2 gångers hävstång.
[box]SEB Veckobrev Veckans råvarukommentar är producerat av SEB Merchant Banking och publiceras i samarbete och med tillstånd på Råvarumarknaden.se[/box]
Disclaimer
The information in this document has been compiled by SEB Merchant Banking, a division within Skandinaviska Enskilda Banken AB (publ) (“SEB”).
Opinions contained in this report represent the bank’s present opinion only and are subject to change without notice. All information contained in this report has been compiled in good faith from sources believed to be reliable. However, no representation or warranty, expressed or implied, is made with respect to the completeness or accuracy of its contents and the information is not to be relied upon as authoritative. Anyone considering taking actions based upon the content of this document is urged to base his or her investment decisions upon such investigations as he or she deems necessary. This document is being provided as information only, and no specific actions are being solicited as a result of it; to the extent permitted by law, no liability whatsoever is accepted for any direct or consequential loss arising from use of this document or its contents.
About SEB
SEB is a public company incorporated in Stockholm, Sweden, with limited liability. It is a participant at major Nordic and other European Regulated Markets and Multilateral Trading Facilities (as well as some non-European equivalent markets) for trading in financial instruments, such as markets operated by NASDAQ OMX, NYSE Euronext, London Stock Exchange, Deutsche Börse, Swiss Exchanges, Turquoise and Chi-X. SEB is authorized and regulated by Finansinspektionen in Sweden; it is authorized and subject to limited regulation by the Financial Services Authority for the conduct of designated investment business in the UK, and is subject to the provisions of relevant regulators in all other jurisdictions where SEB conducts operations. SEB Merchant Banking. All rights reserved.


The latest weekly report from the US DOE showed a substantial drawdown across key petroleum categories, adding more upside potential to the fundamental picture.

Commercial crude inventories (excl. SPR) fell by 5.8 million barrels, bringing total inventories down to 415.1 million barrels. Now sitting 11% below the five-year seasonal norm and placed in the lowest 2015-2022 range (see picture below).
Product inventories also tightened further last week. Gasoline inventories declined by 2.1 million barrels, with reductions seen in both finished gasoline and blending components. Current gasoline levels are about 3% below the five-year average for this time of year.
Among products, the most notable move came in diesel, where inventories dropped by almost 4.1 million barrels, deepening the deficit to around 20% below seasonal norms – continuing to underscore the persistent supply tightness in diesel markets.
The only area of inventory growth was in propane/propylene, which posted a significant 5.1-million-barrel build and now stands 9% above the five-year average.
Total commercial petroleum inventories (crude plus refined products) declined by 4.2 million barrels on the week, reinforcing the overall tightening of US crude and products.


A classic case of “buy the rumor, sell the news” played out in oil markets, as Brent crude has dropped sharply – down nearly USD 10 per barrel since yesterday evening – following Iran’s retaliatory strike on a U.S. air base in Qatar. The immediate reaction was: “That was it?” The strike followed a carefully calibrated, non-escalatory playbook, avoiding direct threats to energy infrastructure or disruption of shipping through the Strait of Hormuz – thus calming worst-case fears.
After Monday morning’s sharp spike to USD 81.4 per barrel, triggered by the U.S. bombing of Iranian nuclear facilities, oil prices drifted sideways in anticipation of a potential Iranian response. That response came with advance warning and caused limited physical damage. Early this morning, both the U.S. President and Iranian state media announced a ceasefire, effectively placing a lid on the immediate conflict risk – at least for now.
As a result, Brent crude has now fallen by a total of USD 12 from Monday’s peak, currently trading around USD 69 per barrel.
Looking beyond geopolitics, the market will now shift its focus to the upcoming OPEC+ meeting in early July. Saudi Arabia’s decision to increase output earlier this year – despite falling prices – has drawn renewed attention considering recent developments. Some suggest this was a response to U.S. pressure to offset potential Iranian supply losses.
However, consensus is that the move was driven more by internal OPEC+ dynamics. After years of curbing production to support prices, Riyadh had grown frustrated with quota-busting by several members (notably Kazakhstan). With Saudi Arabia cutting up to 2 million barrels per day – roughly 2% of global supply – returns were diminishing, and the risk of losing market share was rising. The production increase is widely seen as an effort to reassert leadership and restore discipline within the group.
That said, the FT recently stated that, the Saudis remain wary of past missteps. In 2018, Riyadh ramped up output at Trump’s request ahead of Iran sanctions, only to see prices collapse when the U.S. granted broad waivers – triggering oversupply. Officials have reportedly made it clear they don’t intend to repeat that mistake.
The recent visit by President Trump to Saudi Arabia, which included agreements on AI, defense, and nuclear cooperation, suggests a broader strategic alignment. This has fueled speculation about a quiet “pump-for-politics” deal behind recent production moves.
Looking ahead, oil prices have now retraced the entire rally sparked by the June 13 Israel–Iran escalation. This retreat provides more political and policy space for both the U.S. and Saudi Arabia. Specifically, it makes it easier for Riyadh to scale back its three recent production hikes of 411,000 barrels each, potentially returning to more moderate increases of 137,000 barrels for August and September.
In short: with no major loss of Iranian supply to the market, OPEC+ – led by Saudi Arabia – no longer needs to compensate for a disruption that hasn’t materialized, especially not to please the U.S. at the cost of its own market strategy. As the Saudis themselves have signaled, they are unlikely to repeat previous mistakes.
Conclusion: With Brent now in the high USD 60s, buying oil looks fundamentally justified. The geopolitical premium has deflated, but tensions between Israel and Iran remain unresolved – and the risk of missteps and renewed escalation still lingers. In fact, even this morning, reports have emerged of renewed missile fire despite the declared “truce.” The path forward may be calmer – but it is far from stable.
Analys
A muted price reaction. Market looks relaxed, but it is still on edge waiting for what Iran will do
Brent crossed the 80-line this morning but quickly fell back assigning limited probability for Iran choosing to close the Strait of Hormuz. Brent traded in a range of USD 70.56 – 79.04/b last week as the market fluctuated between ”Iran wants a deal” and ”US is about to attack Iran”. At the end of the week though, Donald Trump managed to convince markets (and probably also Iran) that he would make a decision within two weeks. I.e. no imminent attack. Previously when when he has talked about ”making a decision within two weeks” he has often ended up doing nothing in the end. The oil market relaxed as a result and the week ended at USD 77.01/b which is just USD 6/b above the year to date average of USD 71/b.

Brent jumped to USD 81.4/b this morning, the highest since mid-January, but then quickly fell back to a current price of USD 78.2/b which is only up 1.5% versus the close on Friday. As such the market is pricing a fairly low probability that Iran will actually close the Strait of Hormuz. Probably because it will hurt Iranian oil exports as well as the global oil market.
It was however all smoke and mirrors. Deception. The US attacked Iran on Saturday. The attack involved 125 warplanes, submarines and surface warships and 14 bunker buster bombs were dropped on Iranian nuclear sites including Fordow, Natanz and Isfahan. In response the Iranian Parliament voted in support of closing the Strait of Hormuz where some 17 mb of crude and products is transported to the global market every day plus significant volumes of LNG. This is however merely an advise to the Supreme leader Ayatollah Ali Khamenei and the Supreme National Security Council which sits with the final and actual decision.
No supply of oil is lost yet. It is about the risk of Iran closing the Strait of Hormuz or not. So far not a single drop of oil supply has been lost to the global market. The price at the moment is all about the assessed risk of loss of supply. Will Iran choose to choke of the Strait of Hormuz or not? That is the big question. It would be painful for US consumers, for Donald Trump’s voter base, for the global economy but also for Iran and its population which relies on oil exports and income from selling oil out of that Strait as well. As such it is not a no-brainer choice for Iran to close the Strait for oil exports. And looking at the il price this morning it is clear that the oil market doesn’t assign a very high probability of it happening. It is however probably well within the capability of Iran to close the Strait off with rockets, mines, air-drones and possibly sea-drones. Just look at how Ukraine has been able to control and damage the Russian Black Sea fleet.
What to do about the highly enriched uranium which has gone missing? While the US and Israel can celebrate their destruction of Iranian nuclear facilities they are also scratching their heads over what to do with the lost Iranian nuclear material. Iran had 408 kg of highly enriched uranium (IAEA). Almost weapons grade. Enough for some 10 nuclear warheads. It seems to have been transported out of Fordow before the attack this weekend.
The market is still on edge. USD 80-something/b seems sensible while we wait. The oil market reaction to this weekend’s events is very muted so far. The market is still on edge awaiting what Iran will do. Because Iran will do something. But what and when? An oil price of 80-something seems like a sensible level until something do happen.


Sommarvädret styr elpriset i Sverige

Samtal om flera delar av råvarumarknaden
Tightening fundamentals – bullish inventories from DOE

Jonas Lindvall är tillbaka med ett nytt oljebolag, Perthro, som ska börsnoteras

Oljan, guldet och marknadens oroande tystnad

Stor uppsida i Lappland Guldprospekterings aktie enligt analys

Brookfield ska bygga ett AI-datacenter på hela 750 MW i Strängnäs
Silverpriset släpar efter guldets utveckling, har mer uppsida

Uppgången i oljepriset planade ut under helgen

Låga elpriser i sommar – men mellersta Sverige får en ökning
-
 Nyheter3 veckor sedan
Stor uppsida i Lappland Guldprospekterings aktie enligt analys
-
 Nyheter4 veckor sedan
Brookfield ska bygga ett AI-datacenter på hela 750 MW i Strängnäs
-
 Nyheter3 veckor sedan
Silverpriset släpar efter guldets utveckling, har mer uppsida
-
 Nyheter3 veckor sedan
Uppgången i oljepriset planade ut under helgen
-
 Nyheter3 veckor sedan
Låga elpriser i sommar – men mellersta Sverige får en ökning
-
Analys3 veckor sedan
Very relaxed at USD 75/b. Risk barometer will likely fluctuate to higher levels with Brent into the 80ies or higher coming 2-3 weeks
-

 Nyheter2 veckor sedan
Mahvie Minerals växlar spår – satsar fullt ut på guld
-
 Nyheter1 vecka sedan
Oljan, guldet och marknadens oroande tystnad