

Analys
SEB – Råvarukommentarer, 6 oktober 2014

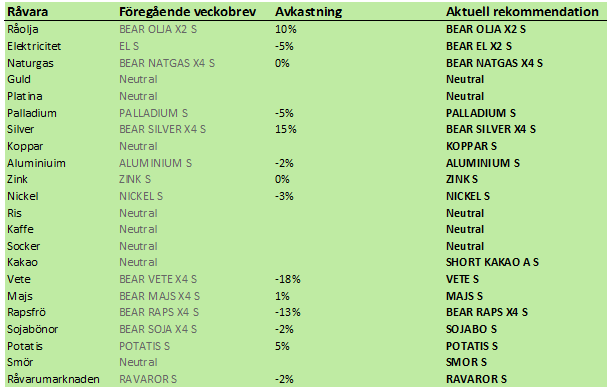
Rekommendationer
Sedan det förra veckobrevet för två veckor sedan, har råvarumarknaderna generellt sett fortsatt i fallande pristrend, med några undantag. Dollarn har fortsatt att stärkas och kronan och euron försvagas mot denna. Tillväxten i Kina väcker oro eftersom ledningen för landet får sin legitimitet från ”7.5% tillväxt”. Den kinesiska ledningen utmanas också av studentupproret i Hong Kong, vilket också skapade viss oro. Kina har för övrigt firat en nationell helgdag den senaste veckan, vilket också kanske påverkat marknaderna negativt, med den största köparen av framförallt metaller och olja / kol borta från marknaden.
Det har alltså varit stora makrofaktorer som präglat marknaden. Fundamentala utbuds/efterfråge-faktorer för de olika råvarorna har det kommit mindre av, särskilt när det gäller metaller. För oljemarknaden har dock en avgörande ledtråd för framtidens oljemarknad kommit och för jordbruksprodukterna har också viss viktig information kommit.
Dollarns styrka och kronans / eurons svaghet är ingen slump. Statistiken från USA i fredags visade den lägsta arbetslösheten, 5.9%, sedan juli 2008 (alltså före finanskrisen). Handelsunderskottet krympte också i augusti till 40.1 miljarder dollar. Båda dessa var bättre än förväntat och stärkte därmed dollarn (och sänkte guldet). EU och Sverige förefaller till stor del ha en övertygelse om att bedriva ekonomisk politik som inte främjar tillväxt. Den starkare dollarn / svagare kronan innebär att alla råvaror blir dyrare, allt annat lika. De prisfall vi ser gäller i dollar, i regel och ser inte nödvändigtvis likadant ut i kronor, vilket förklarar varför en del av 1:1-certifikaten trots allt inte gett så dålig avkastning som om de vore vad en del emittenter kallar ”valutsskyddade”.
Generellt sett tycker jag att man nu kan börja köpa jordbruksprodukter som potatis, mjölk, spannmål och oljeväxter. De har fallit till långt under produktionskostnad i spåren av produktionsöverskotten för att tvinga ner dessa. När detta är gjort måste priset stiga för att långsiktigt ligga vid högre i förhållande till produktionskostnad.
Oljemarknaden är i grunden förändrad i och med innovationen av ”fracking”, vilket innebär att OPEC och ett fåtal andra lyckligt lottade oljenationer har möjlighet att ta ut en ’economic rent’. Eftersom upp till 80% av oljepriset består av produktionsskatt, ’economic rent’ finns en betydande fallhöjd i oljepriset. Terminsmarknaden betalar dessutom investerare för att vara sålda oljepriset eftersom det råder contango (terminer med längre löptid handlas till högre pris än terminer med kortare löptid).
Om Kina fortsätter att ha lägre tillväxt än vad målsättningen är, får metallerna (alla) svårt att inta en positiv trend. Tillväxt i USA leder inte alls på samma sätt till ökad råvaruefterfrågan, som om tillväxt sker i Kina eller Indien, som är inte redan ”har allt”.
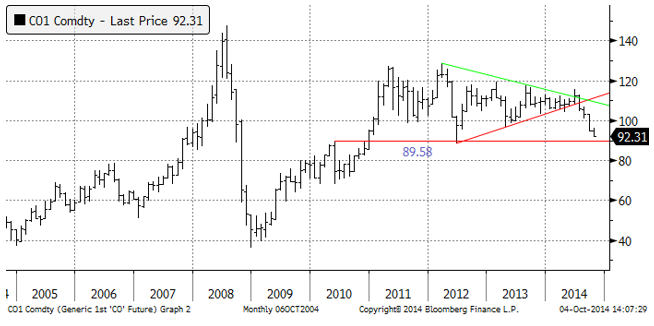
Råolja – Brent
Den nya tekniken att utvinna olja ur tidigare värdelösa reserver, kallad “fracking”, börjar få effekt på OPEC. Saudiarabiens statliga oljebolag Saudi Aramco meddelade i onsdags att deras Official Selling Price (OSP) för oljelaster under november kommer att ligga 1.05 dollar under prisindexet för Oman/Dubai. I januari sålde Aramco sin Arab Light 3.75 dollar över benchmarkpriset.
Saudiarbien sätter inte sitt eget pris, utan har alltid angett sitt pris i relation till ett prisindex, i det här fallet Platt’s index för Oman/Dubai. Det mest populära benchmarket i världen är förstås Brent.
1.05 dollar under prisindexet är den lägsta nivån sedan 2008. Beslutet ska ses mot bakgrund av Irans och Iraks aggressiva marknadsföring och som en förberedelse inför OPEC-mötet den 27 november. Irans kärnkraft/vapen-förhandlingar har också den 24 november som deadline och om den slår ”väl” ut kan Iran slå på exporten.
Jag tror dock inte att man ska tolka detta allt för närsynt, utan mot bakgrund till ett större skeende, med mycket större konsekvenser.
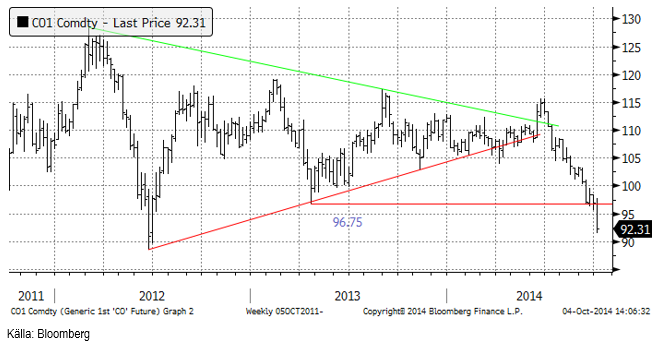
Nedan ser vi ett månadschart för de senaste tio åren. Vi ser att priset har brutit en triangelformation för tre månader sedan. Det är enligt handboken i tekniska analys, en negativ signal. Vi ser också att priset är nere vid det tekniska stödet på 89.58 dollar och det är möjligt att det blir en rekyl uppåt från den här nivån. En sådan rekyl är i så fall ett nytt säljtillfälle.
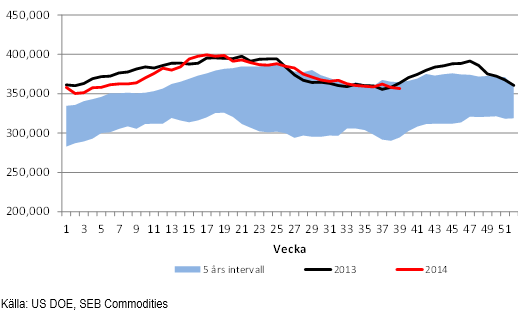
Råoljelagren i USA ligger nu något under förra årets nivå, som vi ser av nedanstående diagram. Importen till USA låg på 7.28 mbpd, som är 1.1 miljoner fat mindre än förra året. Den siffran motsvarar också den årliga ökningstakten i USA:s oljeproduktion, ungefär 1 miljon fat per dag mer produktion per år.
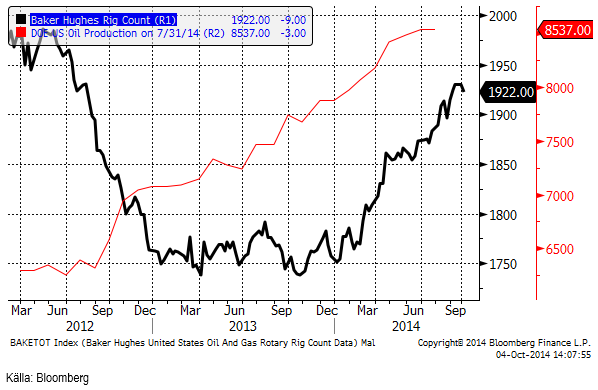
Nedan ser vi ett diagram på antalet oljeriggar i USA, enligt Baker Hughes statistik (svart) och USA:s oljeproduktion enligt US DOE på 8.357 mbpd. Antalet borr-riggar har minskat från 1931 till 1922. Detta kan bero på det lite lägre oljepriset, men är förmodligen bara en slump.
Den allmänna uppfattningen i världen är att USA slutar importera olja åren 2030 – 2040. Det är fortfarande betryggande långt in i framtiden. Den allmänna uppfattningen är också att USA:s intresse för att bevara stabilitet i MENA hänger ihop med deras roll som oljeproducenter och att den dagen USA är oberoende av importerad olja kommer att förändra den rollen.
USA kan inte exportera olja pga den över 100 år gamla Jones Act, men kan exportera oljeprodukter. Amerikanska raffinaderier är nuförtiden mycket konkurrenskraftiga därför att de har tillgång till billigt bränsle i form av billig naturgas och billigt väte (för uppgradering av tyngre kolväten) också i form av billig naturgas. Nedan ser vi en graf över USA:s import av olja ( i miljoner fat / dag) och export av oljeprodukter.
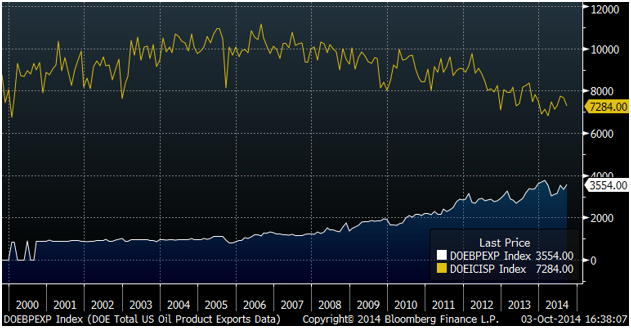
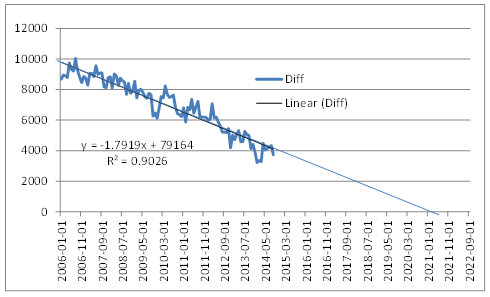
Vi ser att exporten av oljeprodukter börjar närma sig importen av olja (och oljeprodukter). Tittar vi på skillnaden mellan import och export, för att tydligare se hur balansen utvecklar sig, och anpassar en linjär linje till kurvan, ser vi att USA med största sannolikhet når oljeoberoende år 2021, alltså om 7 år (se diagrammet nedan). Den som tittar närmare ser att kurvan är lite konkav. Det datumet kan alltså inträffa tidigare än år 2021.
Det råder ett contango i oljemarknaden på 7% på årsbasis för närvarande. Den som lägger sig kort genom att t ex köpa tjänar alltså 7% på att ligga kort, per år. Med två gångers hävstång, som i en BEAR OLJA X2 S, blir förväntad intäkt 14%.
Vi rekommenderar alltså på kort sikt en försiktig kortposition t ex med BEAR OLJA X2 S, men varnar för att en kortsiktig rekyl uppåt kan komma eftersom priset ligger så nära det tekniska stödet på 89.58 dollar per fat.
Elektricitet
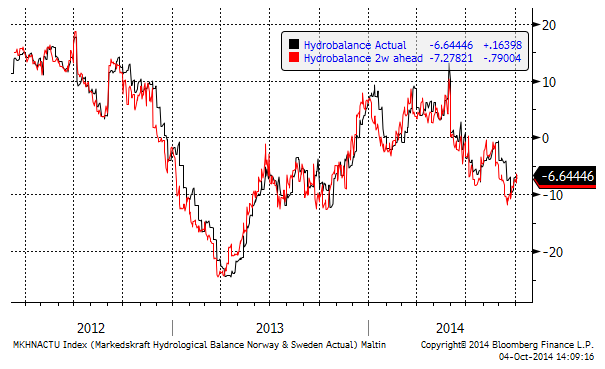
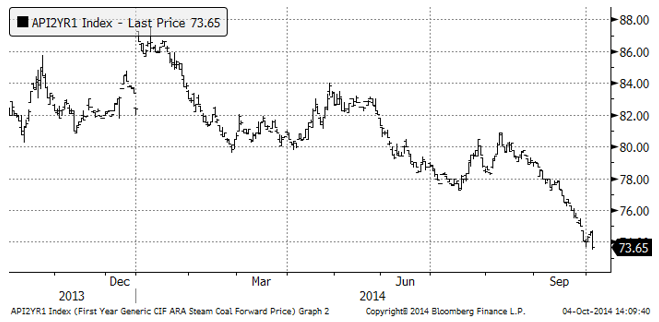
Priset på el har brutit den stigande pristrenden med ett stort prisfall i fredags som följd. Alla kärnkraftreaktorer som ska vara i drift kommer att vara åter i produktion i veckan som kommer. Det är förvisso ett litet underskott i den hydrologiska balansen, men väderleksprognosen pekar på fortsatt mycket nederbörd. Kolpriset föll till en ny bottennotering på kontinenten. Ingen vet ännu hur kallt det blir i vinter, men just nu ser det mest negativt ut för elpriset. Den nya regeringen i Sverige har hunnit deklarera att de vill ha 100% förnybar elproduktion i Sverige, vilket blir ohyggligt dyrt, men kostnaden faller på skattebetalare och på nätavgifter, medan elpriset i sig självt pressas av subventionerat utbud av el som har noll i rörlig kostnad att producera.
Hydrologisk balans har enligt 2-veckors prognosen vänt uppåt, som vi ser i diagrammet nedan.
Nedan ser vi terminspriset för kalenderåret 2015 avseende energikol.
Vi rekommenderar kort position i el.
Naturgas
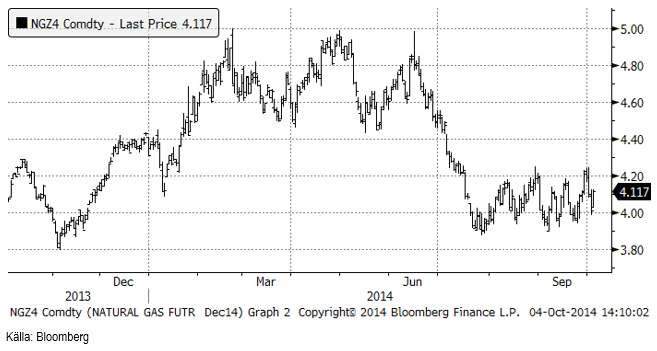
Naturgaspriset (decemberkontraktet) fortsatte att pendla inom det intervall vi noterat tidigare, som har ett golv vid 3.90 och ett tak vid 4.20. Vi har noterat högre toppar och högre bottnar sedan början av december, men det finns ingen kraft i uppgången. Det tyder på att nästa stora rörelse kommer att vara nedåt. Vi fortsätter därmed att rekommendera köp av BEAR NATGAS X4 S.
Koppar
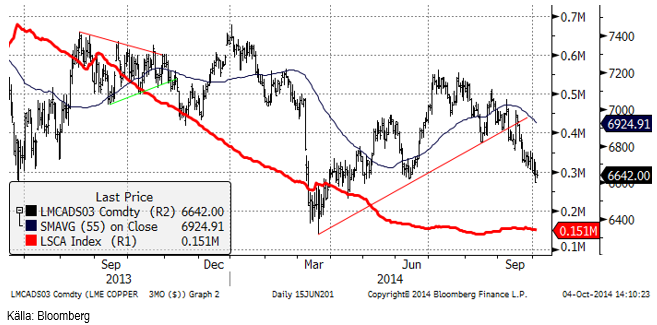
Som vi har påpekat förut, skiljer sig koppar från de andra stora basmetallerna, i det att marknaden för koppar har varit i underskott i flera år och verkar vara på väg mot överskott. Å andra sidan har jag också skrivit att den största producenten, Codelco:s, produktionskostnad ligger vid den nivå på 6600 dollar som koppar just nu handlas vid. Codelco producerar 1/5-del av all koppar i världen och är därmed helt avgörande för marknaden. Just nu handlas faktiskt koppar i backwardation, vilket tyder på att det är en kortsiktig brist på koppar i förhållande till vad marknaden förväntar sig om framtiden. Det är i regel inte ett negativt tecken.
Enligt Metal Bulletin finns tecken på att efterfrågan försvagas i de traditionella sektorerna som telekommunikation och byggande. Men detta kompenseras av högre efterfrågan från biltillverkare, luftkonditioneringstillverkare och statliga kraftnätsbolag. ’Energiewende’ i Tyskland kräver t ex en massiv utbyggnad av nätet, som nu håller på att ske. Apropå det, krävde Bayerns CDU i fredags ett stopp på denna utbyggnad i delstaten; det är både ett tecken på att kulmen på ’Energiewende’ och på den omfattning som den har kan ha nåtts. Den nya regeringen i Sverige sade å andra sidan i fredags att Sverige ska ha 100% förnybar energiproduktion, vilket även här innebär ett behov av att bygga ut kraftnätet ytterligare (vilket inte påverkar elpriset, men väl nätavgiften och förmodligen inkomstskatten). Från SEB:s sida ser vi faktiskt högre pris på koppar nästa år, baserat på konsumtionen utanför Kina.
På den här prisnivån talar både kostnadsnivån hos Codelco och efterfrågesituationen utanför Kina för ett köp av metallen. Vi rekommenderar köp av KOPPAR S.
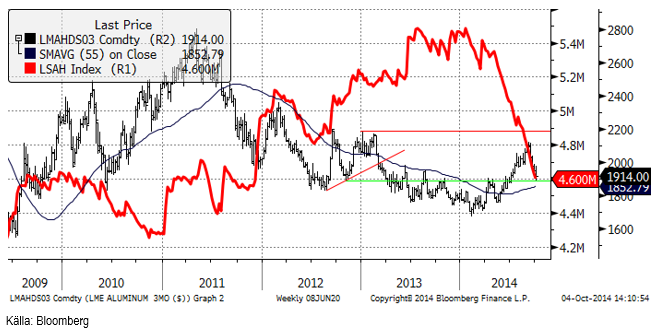
Aluminium
De senaste veckorna har vi sett priset sjunka från en topp på över 2100 dollar till fredagens 1914. Samtidigt rasar lagernivån hos LME vidare. Det ger stöd för tanken att prisnedgången handlar om en rekyl. Frågan är när rekylen är över och det är dags att köpa igen. Tekniskt ser vi att 1900 är en stödnivå, och därför är det förmodligen inte en dum idé att köpa nu. Det är intressant att notera styrkan i marknaden sent på fredagen när dollarn var ännu mer stark efter arbetsmarknadsstatistiken från USA.
Med en vecka hit eller dit, rekommenderar vi köp av ALUMINIUM S.
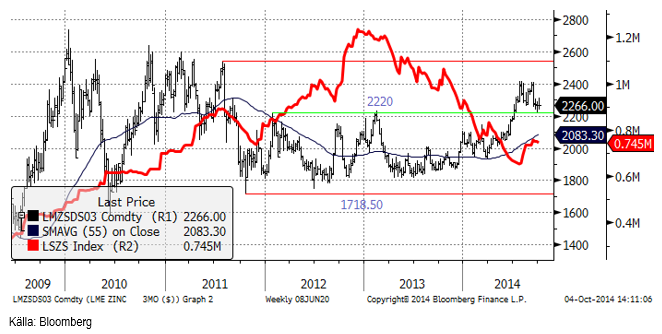
Zink
Oron för den kinesiska efterfrågan ökar. Det gör även utbudet av metall från samma region. Underskottet i zinkmarknaden under det första halvåret väntas ha vänts till ett överskott under det tredje kvartalet. Den ökning i LME-lagren vi har sett (röd linje, se nedan) verkar stödja detta. Vi ser samma scenario för zink som för aluminium, dvs att trenden mot en starkare marknad tar en paus under det tredje kvartalet. För både aluminium och zink väntar vi dock oss att trenden fortsätter under det fjärde kvartalet.
Om vi blickar framåt mot 2015 väntas ytterligare stängning av gruvor och en fortsättning på minskningen av utbudet. Nedsidan i priset borde vara begränsad.
Tekniskt ser vi att 2200 dollar varit en viktig nivå tidigare. Rekylen nedåt har studsat en gång på den nivån och det är inte otänkbart att den nivån håller även för ett andra test. Kommer priset ner till den nivån är det förmodligen ett bra köptillfälle.
Vi rekommenderar köp av ZINK S.
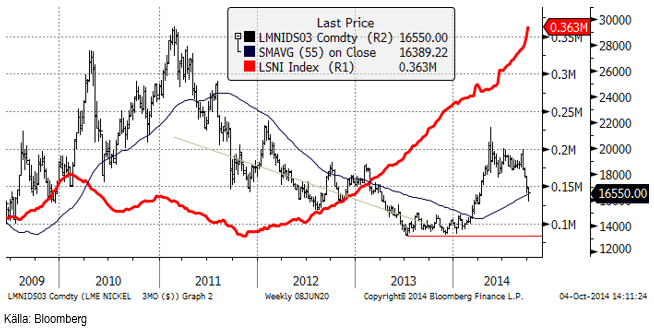
Nickel
Till stor besvikelse för de flesta har nickelpriset fallit kraftigt de senaste veckorna. Vi har dock sagt att uppgången är uttagen i förtid, och prisfallet är på något sätt en korrektion av en allt för tidig diskontering av en utbuds / efterfrågebalans som är ett positivt framtidsscenario. LME:s lager av metall ökar för var dag med ca 1500 ton. Det finns olika teorier om varifrån metallen kommer. Men metallen kommer och den klassiska tolkningen av det är att marknaden är i överskott just nu, till dagens pris. Frågan är förstås hur priset har påverkat utbud och efterfrågan om några månader eller om ett år.
Det hölls en nickelkonferens i Jakarta förra veckan och vår trader Jacek Lupinski var där. Det här är hans kommentarer:
- Indonesien är fast i sitt exportstopp och kommer att bygga infrastruktur för att attrahera investeringar för smältverk.
- Mindre smältverk har redan startat i Indonesien.
- 50 företag har visar intresse för investering i smältverk, men bara ett fåtal har signerat Memorandum of Understandings (MOUs).
- Några kommer antagligen att vara i produktion nästa år, men de flesta kommer antagligen att behöva mer tid för att komma i mål.
- Filippinerna har skeppat så mycket malm som de kan under sommarmånaderna.
- Kinesiska NPI-producenter har blandat filippinsk malm med den indonesiska de har i lager.
- Den filippinska malmen har mindre nickel och järninnehåll. Producenter av rostfritt stål (baserad på den här malmen) motiverar ett pris på 20,000 dollar / ton.
- Regnperioden är i antågande, vilket kan leda till betydligt mindre export från Filippinerna under det fjärde kvartalet och det första nästa år.
- Utan den indonesiska malmen, skulle kinesiska producenter vara beroende av filippinsk malm, som motiverar ett högre pris på primärnickel. När den indonesiska malmen är slut i lager hos kineserna, kommer de att vända sig till LME.s lager av primärnickel, vilket motiverar ett högre nickelpris.
Vi tycker sammantaget att de kommande veckorna kan ge möjlighet att komma in på den långa sidan och rekommenderar köp av NICKEL S.
Guld
Guldpriset i dollar har fallit ner till 1191 dollar, som bara är en hårsmån från det tekniska stödet vid 1180 dollar. Jag tycker att man ska avvakta om det stödet håller innan man köper och vill man spekulera i att stödet håller, bör man vara beredd att ta en stop-loss om det bryts. Tekniskt ser det ut som det är hög sannolikhet att stödet bryts.
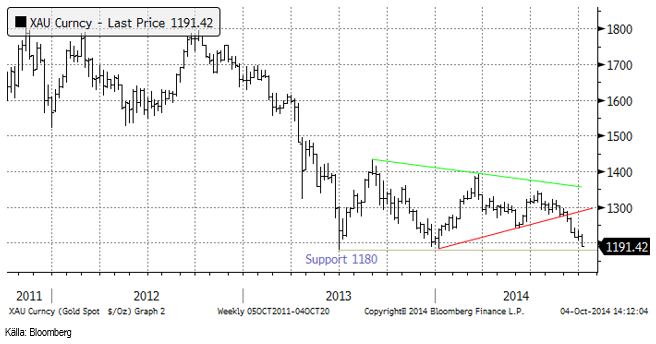
Chartet för guld i kronor (och i euro med för den delen) ser inte alls lika negativt ut. Visserligen kan ett brott av 1180 dollar per uns i dollarchartet leda till en nedgång krontermer också. Där finns stöd på 8000 kr, en liten bit under dagens pris på 8680 kr per uns.
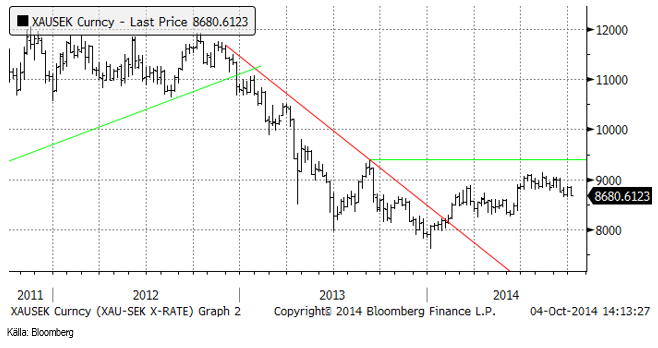
Det känns allt mindre positivt kring guld, och vi rekommenderar neutral position.
Silver
Silverpriset har fortsatt att rasa de senaste två veckorna och är nere på 16.84 dollar per uns. Det finns inget som tyder på att prisfallet inte skulle fortsätta.
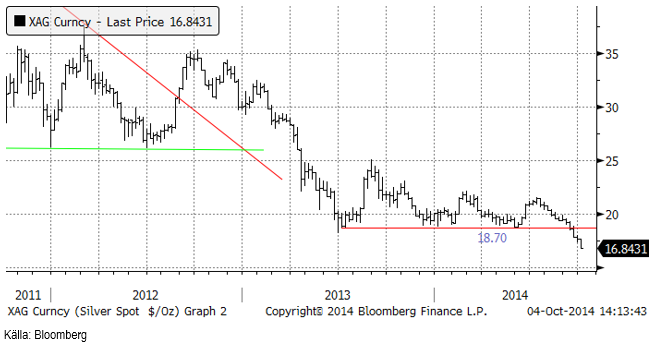
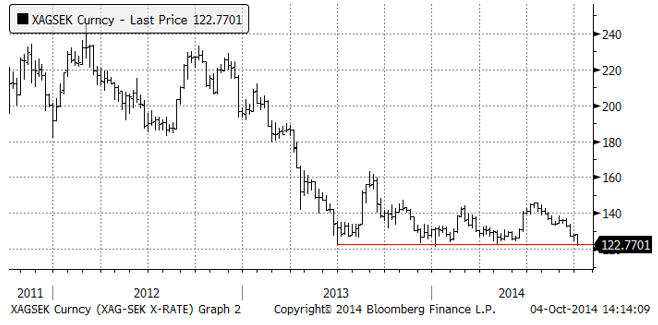
Silverpriset i svenska kronor ligger precis på sitt tekniska stöd, som markerat botten för prisrörelserna i drygt ett år. Bryts den här nivån, är det fritt fall nedåt som väntar och man bör i så fall vara kort även i kron-termer.
Investerare fortsätter att flockas till silver, som vi ser i diagrammet nedan över antalet utestående fondandelar i IShares silver ETF och GLD, den största guld-ETF:en.
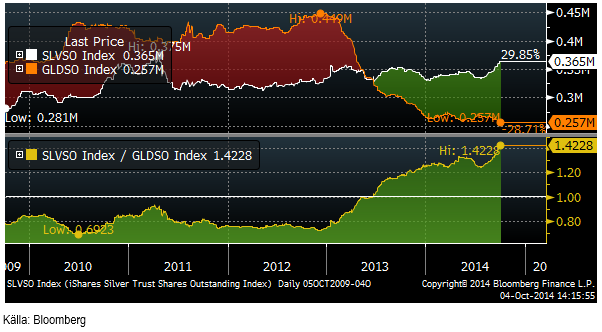
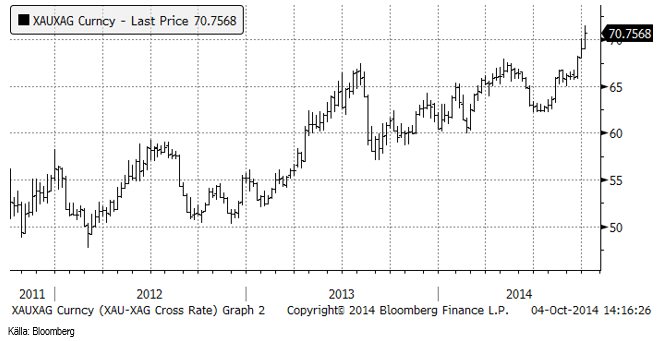
Anledningen till att investerare köper silver, men förhåller sig neutrala till guld, är naturligtvis att silver är historiskt billigt i förhållande till guld. Kvoten mellan guld och silverpriset har nått rekordnivåer på nästan 75 gånger. På längre sikt är förmodligen ett byte från guld till silver i portföljen en god idé, men kortsiktigt kan det vara farligt.
Vi fortsätter att på kort sikt rekommendera en kort position i silver med köp av BEAR SILVER X4 S.
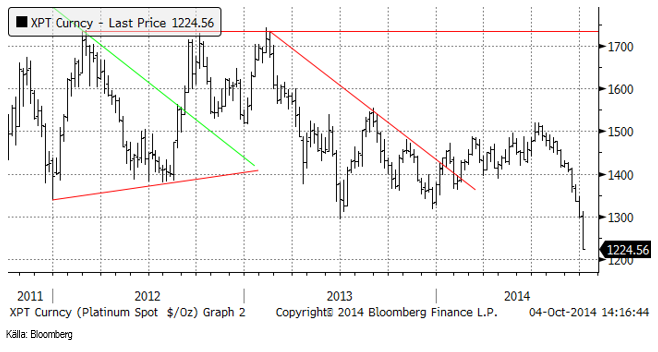
Platina & Palladium
Investerare verkar ha tappat sugen på platina och en liten nedgång, som blev starkare, har de senaste två veckorna övergått i en baisse.
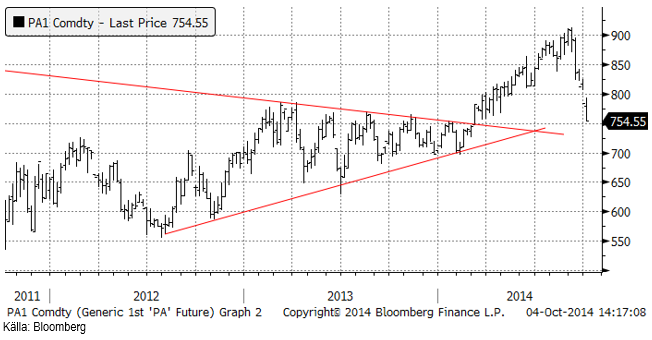
Palladium har fallit hela vägen ner till utbrottsnivån från den stora konsolideringen. Stödet vid 800 dollar passerades förra veckan och priset är nere på 754.55 dollar.
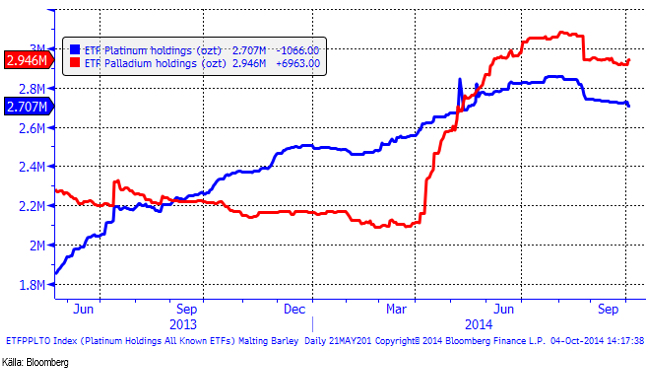
Nedanför ser vi hur mycket metall som finns i börshandlade fonder för platina respektive palladium. Medan investerare börjar sälja en del platina, har de faktiskt köpt palladium de senaste dagarna. Det är också så jag ser det. Platina ska man hålla sig undan på kort sikt, medan palladium KAN få stöd vid dagens nivå, eftersom priset är tillbaka på utbrottsnivån varifrån uppgången började.
Vi fortsätter med neutral rekommendation på platina, men rekommenderar köp av palladium via t ex PALLADIUM S.
Ris
Det har inte kommit några nyheter om rismarknaden som förmått förändra marknadsläget. Situationen är oförändrad. Vi fortsätter med neutral rekommendation och är beredda att köpa BEAR RIS X4 S om priset skulle notera nytt årslägsta.
Vi fortsätter med neutral rekommendation, men förbereder oss för att gå kort.
Kaffe
Kaffepriset har stigit drygt 10% från 180 till 206 sedan slutet av september efter att det verkar som om nederbörden missar viktiga odlingsområden i Minas Gerais i Brasilien. Enligt MDA Weather Services kommer inte regnen att nå kaffeodlingarna förrän i mitten av oktober. Oktober är månaden när kaffebuskarna blommar och är det torrt under blomningen faller blommorna av utan att befruktas och bli kaffebönor. Markfukten i den södra delen av kaffeodlingsområdet är ca 70 – 85% lägre än normalt de senaste två månaderna. I norra delen av kaffeodlingsområdet har nederbörden de två senaste månaderna varit 85-100% lägre än normalt.
Det finns ett starkt motstånd vid 220 cent och just nu tror vi att detta håller. Skulle det brytas, kan man på mycket kort sikt ta en köpt position.
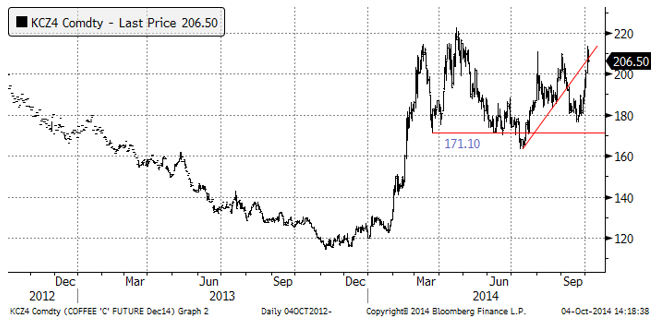
Vi rekommenderar neutral position i kaffe.
Kakao
Att ebola-smittan kan nå Ghana och Elfenbenskusten är något som alla varit medvetna om en längre tid. Men så kom en artikel i Bloomberg för ett par veckor sedan, som behandlade detta. När det kom svart på vitt (eller i Bloomberg faktiskt vitt på svart), orkade inte de som varit korta hålla emot längre och täckte sig genom att köpa. Fundamentalt borde nämligen priset gå ner. Elfenbenskusten får en rekordskörd i år och priset är i ett historiskt perspektiv mycket högt. Uppgången blev därför snabb och kortvarig. När short covering var över vände priset ner igen, lika fort, eftersom köparna hade tömt ut sitt behov.
Det är fortfarande rätt mycket osäkerhet om huruvida ebola sprider sig till grannländerna och vilka konsekvenser detta skulle få. Man kan nog också tänka sig att konsumtionen av choklad i världen minskar om kakaoproduktionen drabbas av ebola. Det är inte givet att priset stiger i en sådan situation.
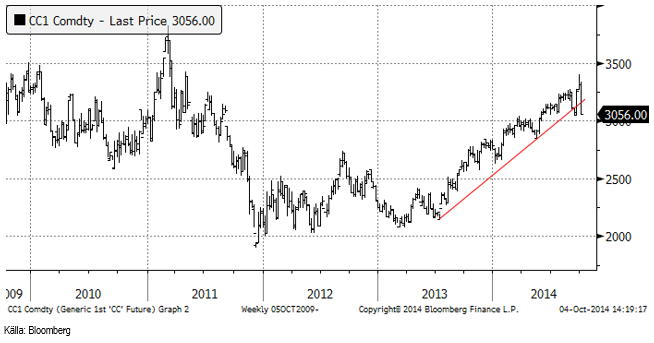
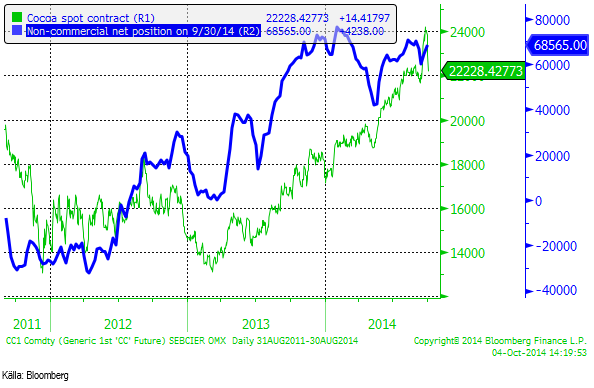
Spekulativ position steg något efter ebola-skräcken. Sannolikt kommer vi se säljtryck från spekulantkollektivet framöver.
Det är lite vågat, men vi går över till att rekommendera en kort position i kakao igen, köp av SHORT KAKAO A S.
För fler analyser på jordbruksprodukter se SEBs andra analysbrev.
[box]SEB Veckobrev Veckans råvarukommentar är producerat av SEB Merchant Banking och publiceras i samarbete och med tillstånd på Råvarumarknaden.se[/box]
Disclaimer
The information in this document has been compiled by SEB Merchant Banking, a division within Skandinaviska Enskilda Banken AB (publ) (“SEB”).
Opinions contained in this report represent the bank’s present opinion only and are subject to change without notice. All information contained in this report has been compiled in good faith from sources believed to be reliable. However, no representation or warranty, expressed or implied, is made with respect to the completeness or accuracy of its contents and the information is not to be relied upon as authoritative. Anyone considering taking actions based upon the content of this document is urged to base his or her investment decisions upon such investigations as he or she deems necessary. This document is being provided as information only, and no specific actions are being solicited as a result of it; to the extent permitted by law, no liability whatsoever is accepted for any direct or consequential loss arising from use of this document or its contents.
About SEB
SEB is a public company incorporated in Stockholm, Sweden, with limited liability. It is a participant at major Nordic and other European Regulated Markets and Multilateral Trading Facilities (as well as some non-European equivalent markets) for trading in financial instruments, such as markets operated by NASDAQ OMX, NYSE Euronext, London Stock Exchange, Deutsche Börse, Swiss Exchanges, Turquoise and Chi-X. SEB is authorized and regulated by Finansinspektionen in Sweden; it is authorized and subject to limited regulation by the Financial Services Authority for the conduct of designated investment business in the UK, and is subject to the provisions of relevant regulators in all other jurisdictions where SEB conducts operations. SEB Merchant Banking. All rights reserved.


The latest weekly report from the US DOE showed a substantial drawdown across key petroleum categories, adding more upside potential to the fundamental picture.

Commercial crude inventories (excl. SPR) fell by 5.8 million barrels, bringing total inventories down to 415.1 million barrels. Now sitting 11% below the five-year seasonal norm and placed in the lowest 2015-2022 range (see picture below).
Product inventories also tightened further last week. Gasoline inventories declined by 2.1 million barrels, with reductions seen in both finished gasoline and blending components. Current gasoline levels are about 3% below the five-year average for this time of year.
Among products, the most notable move came in diesel, where inventories dropped by almost 4.1 million barrels, deepening the deficit to around 20% below seasonal norms – continuing to underscore the persistent supply tightness in diesel markets.
The only area of inventory growth was in propane/propylene, which posted a significant 5.1-million-barrel build and now stands 9% above the five-year average.
Total commercial petroleum inventories (crude plus refined products) declined by 4.2 million barrels on the week, reinforcing the overall tightening of US crude and products.


A classic case of “buy the rumor, sell the news” played out in oil markets, as Brent crude has dropped sharply – down nearly USD 10 per barrel since yesterday evening – following Iran’s retaliatory strike on a U.S. air base in Qatar. The immediate reaction was: “That was it?” The strike followed a carefully calibrated, non-escalatory playbook, avoiding direct threats to energy infrastructure or disruption of shipping through the Strait of Hormuz – thus calming worst-case fears.
After Monday morning’s sharp spike to USD 81.4 per barrel, triggered by the U.S. bombing of Iranian nuclear facilities, oil prices drifted sideways in anticipation of a potential Iranian response. That response came with advance warning and caused limited physical damage. Early this morning, both the U.S. President and Iranian state media announced a ceasefire, effectively placing a lid on the immediate conflict risk – at least for now.
As a result, Brent crude has now fallen by a total of USD 12 from Monday’s peak, currently trading around USD 69 per barrel.
Looking beyond geopolitics, the market will now shift its focus to the upcoming OPEC+ meeting in early July. Saudi Arabia’s decision to increase output earlier this year – despite falling prices – has drawn renewed attention considering recent developments. Some suggest this was a response to U.S. pressure to offset potential Iranian supply losses.
However, consensus is that the move was driven more by internal OPEC+ dynamics. After years of curbing production to support prices, Riyadh had grown frustrated with quota-busting by several members (notably Kazakhstan). With Saudi Arabia cutting up to 2 million barrels per day – roughly 2% of global supply – returns were diminishing, and the risk of losing market share was rising. The production increase is widely seen as an effort to reassert leadership and restore discipline within the group.
That said, the FT recently stated that, the Saudis remain wary of past missteps. In 2018, Riyadh ramped up output at Trump’s request ahead of Iran sanctions, only to see prices collapse when the U.S. granted broad waivers – triggering oversupply. Officials have reportedly made it clear they don’t intend to repeat that mistake.
The recent visit by President Trump to Saudi Arabia, which included agreements on AI, defense, and nuclear cooperation, suggests a broader strategic alignment. This has fueled speculation about a quiet “pump-for-politics” deal behind recent production moves.
Looking ahead, oil prices have now retraced the entire rally sparked by the June 13 Israel–Iran escalation. This retreat provides more political and policy space for both the U.S. and Saudi Arabia. Specifically, it makes it easier for Riyadh to scale back its three recent production hikes of 411,000 barrels each, potentially returning to more moderate increases of 137,000 barrels for August and September.
In short: with no major loss of Iranian supply to the market, OPEC+ – led by Saudi Arabia – no longer needs to compensate for a disruption that hasn’t materialized, especially not to please the U.S. at the cost of its own market strategy. As the Saudis themselves have signaled, they are unlikely to repeat previous mistakes.
Conclusion: With Brent now in the high USD 60s, buying oil looks fundamentally justified. The geopolitical premium has deflated, but tensions between Israel and Iran remain unresolved – and the risk of missteps and renewed escalation still lingers. In fact, even this morning, reports have emerged of renewed missile fire despite the declared “truce.” The path forward may be calmer – but it is far from stable.
Analys
A muted price reaction. Market looks relaxed, but it is still on edge waiting for what Iran will do
Brent crossed the 80-line this morning but quickly fell back assigning limited probability for Iran choosing to close the Strait of Hormuz. Brent traded in a range of USD 70.56 – 79.04/b last week as the market fluctuated between ”Iran wants a deal” and ”US is about to attack Iran”. At the end of the week though, Donald Trump managed to convince markets (and probably also Iran) that he would make a decision within two weeks. I.e. no imminent attack. Previously when when he has talked about ”making a decision within two weeks” he has often ended up doing nothing in the end. The oil market relaxed as a result and the week ended at USD 77.01/b which is just USD 6/b above the year to date average of USD 71/b.

Brent jumped to USD 81.4/b this morning, the highest since mid-January, but then quickly fell back to a current price of USD 78.2/b which is only up 1.5% versus the close on Friday. As such the market is pricing a fairly low probability that Iran will actually close the Strait of Hormuz. Probably because it will hurt Iranian oil exports as well as the global oil market.
It was however all smoke and mirrors. Deception. The US attacked Iran on Saturday. The attack involved 125 warplanes, submarines and surface warships and 14 bunker buster bombs were dropped on Iranian nuclear sites including Fordow, Natanz and Isfahan. In response the Iranian Parliament voted in support of closing the Strait of Hormuz where some 17 mb of crude and products is transported to the global market every day plus significant volumes of LNG. This is however merely an advise to the Supreme leader Ayatollah Ali Khamenei and the Supreme National Security Council which sits with the final and actual decision.
No supply of oil is lost yet. It is about the risk of Iran closing the Strait of Hormuz or not. So far not a single drop of oil supply has been lost to the global market. The price at the moment is all about the assessed risk of loss of supply. Will Iran choose to choke of the Strait of Hormuz or not? That is the big question. It would be painful for US consumers, for Donald Trump’s voter base, for the global economy but also for Iran and its population which relies on oil exports and income from selling oil out of that Strait as well. As such it is not a no-brainer choice for Iran to close the Strait for oil exports. And looking at the il price this morning it is clear that the oil market doesn’t assign a very high probability of it happening. It is however probably well within the capability of Iran to close the Strait off with rockets, mines, air-drones and possibly sea-drones. Just look at how Ukraine has been able to control and damage the Russian Black Sea fleet.
What to do about the highly enriched uranium which has gone missing? While the US and Israel can celebrate their destruction of Iranian nuclear facilities they are also scratching their heads over what to do with the lost Iranian nuclear material. Iran had 408 kg of highly enriched uranium (IAEA). Almost weapons grade. Enough for some 10 nuclear warheads. It seems to have been transported out of Fordow before the attack this weekend.
The market is still on edge. USD 80-something/b seems sensible while we wait. The oil market reaction to this weekend’s events is very muted so far. The market is still on edge awaiting what Iran will do. Because Iran will do something. But what and when? An oil price of 80-something seems like a sensible level until something do happen.


USA ska införa 50 procent tull på koppar

Ryska staten siktar på att konfiskera en av landets största guldproducenter

Hur säkrar vi Sveriges tillgång till kritiska metaller och mineral i en ny geopolitisk verklighet?

Lundin Mining ska bli en av de tio största kopparproducenterna i världen

Sommarvädret styr elpriset i Sverige

Mahvie Minerals växlar spår – satsar fullt ut på guld

Uppgången i oljepriset planade ut under helgen

Låga elpriser i sommar – men mellersta Sverige får en ökning

Oljan, guldet och marknadens oroande tystnad
A muted price reaction. Market looks relaxed, but it is still on edge waiting for what Iran will do
-
 Nyheter3 veckor sedan
Mahvie Minerals växlar spår – satsar fullt ut på guld
-
 Nyheter4 veckor sedan
Uppgången i oljepriset planade ut under helgen
-
 Nyheter4 veckor sedan
Låga elpriser i sommar – men mellersta Sverige får en ökning
-
 Nyheter3 veckor sedan
Oljan, guldet och marknadens oroande tystnad
-
Analys3 veckor sedan
A muted price reaction. Market looks relaxed, but it is still on edge waiting for what Iran will do
-

 Nyheter3 veckor sedan
Jonas Lindvall är tillbaka med ett nytt oljebolag, Perthro, som ska börsnoteras
-
Analys4 veckor sedan
Very relaxed at USD 75/b. Risk barometer will likely fluctuate to higher levels with Brent into the 80ies or higher coming 2-3 weeks
-

 Nyheter3 veckor sedan
Domstolen ger klartecken till Lappland Guldprospektering