

Analys
SEB – Råvarukommentarer, 28 januari 2013
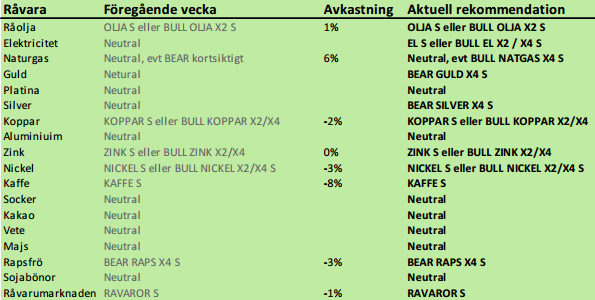
Rekommendationer
Inledning
SEB:s råvaruindex var oförändrat i veckan som gick. Däremot föll dollarn, vilket medförde att certifikatet RAVAROR S, som följer indexet, föll med 1%.
Det var få råvaror som steg i pris förra veckan. Olja och raps lyckades stiga. Elpriset föll kraftigt, liksom kaffe. I båda de fallen ser vi prisfallen som rekyler i marknader som befunnit sig i konsolidering efter stora prisfall och nyligen brutit uppåt i vad som vi tror är början på en längre trend. Det är så klart många som ifrågasätter om det verkligen är dags för de här råvarorna att stiga i pris. BEAR EL X4 S steg med 22% till 105 kr per certifikat.
Elpriset föll ordentligt i veckan under påverkan av det ännu kratigare fallande tyska elpriset. Det föll i sin tur på grund av fallande produktionskostnad. Priset på utsläppsrätter nådde all time low för den här perioden. Utsläppsrätterna är nu nära nog värdelösa. Den som hoppas på högre elpriser har här ett argument. Utsläppsrätterna kan i vart fall inte längre ha en negativ inverkan på elpriset.
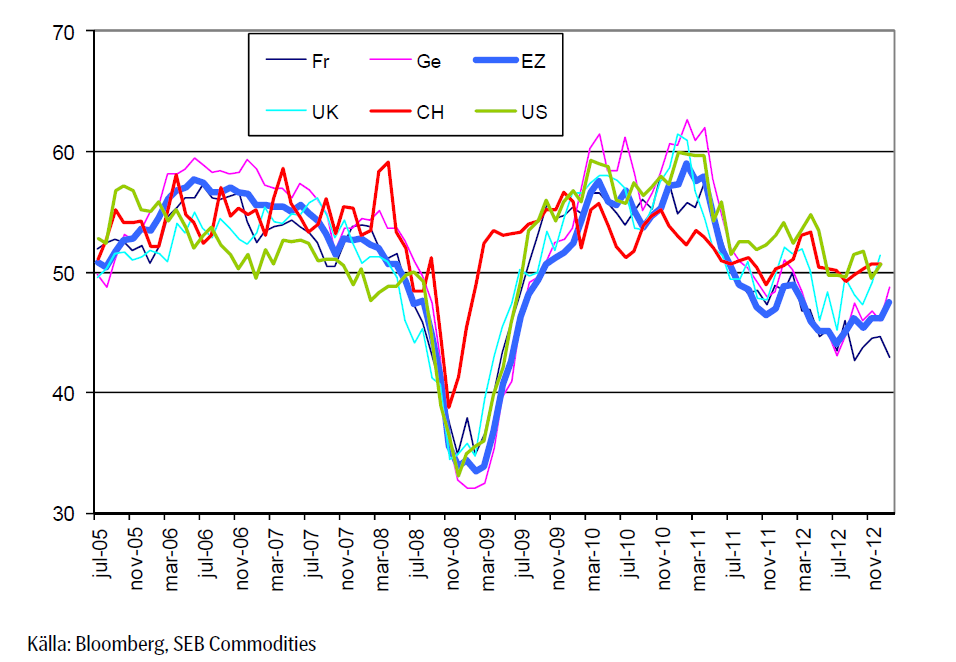
Inköpschefsindex, en framåtblickande “konfidensindikator” ser vi nedan för olika Eurozonen (EZ), Kina (CH), USA, Tyskland, Frankrike och Storbritannien. Generellt sett ser det ut som om väldsekonomin befinner sig ett stadium av “sen recession”. Med undantag för Hollandes socialistiska Frankrike, som fortsätter att falla. “Sen recession” innebär att framförallt energi (råolja) och industrimetaller ökar i efterfrågan. Liksom i förra veckobrevet vill vi gärna lyfta fram råolja och basmetaller / industrimetaller som marknader som kan stå inför en konjunkturell uppgång.
Råolja – Brent
Efter att ha brutit den nedåtgående motståndslinjen för över en vecka sedan, fortsatte oljepriset att stiga. Nästa motstånd väntar vid 116.89 dollar. Huvudmotståndet ligger som vi ser i diagrammet nedan vid 117.95 dollar. Fundamentalt ger den ökning i efterfrågan man kan förvänta sig när global ekonomi hämtar sig. Som vi sett ovan visar PMI-statistiken en bild som stämmer överens med ”sen recession”. Saudiarabiens produktionsminskning ger stöd. Goda inkomster i Saudiarabien, och övriga delar av den arabiska delen av OPEC, kallat AOPEC, ger möjligheter att skydda länderna mot de upprorsbrasor som uppstår här och var i den arabiska världen.
På ”bear”-sidan hittar vi den teknikrevolution som framförallt sker i USA. Ett välkänt faktum inom oljeindustrin är att bästa chansen att hitta olja har man i ett oljefält. Fracking-tekniken passar mycket bra in i den historiska erfarenheten. Sveriges ledande råvaruekonom Marian Radetzki visade i en artikel i Energy Policy juli förra året, att en stor del av oljeprisuppgången sedan 1980-talet beror på att oljeproducerande stater successivt ökat sina produktionsskatter. Därigenom har kostnaden ökat för producenterna, vilket gjort att jämviktspriset stigit på marknaden. Det intressanta med frackingtekniken är också att den sker i USA, som saknar höga produktionsskatter. En ny tekniks bättre produktionsekonomi kan slå igenom direkt i ökad produktion och därmed lägre världsmarknadspriser. Mexiko är ett land som gått längst i att mjölka ur den gamla oljeindustrin.
PEMEX har dränerats på kapital så till den milda grad att oljeriggar står obrukbara och oljeläckor fortgår på ett sätt som skulle fått BP att gå under i stämningar. Mexikos möjligheter att hantera hotet från USA är obefintliga. Det enda Saudiarabien kan göra är att minska produktionen, som de gjort. Men de kan inte göra det hur mycket som helst, då minskar intäkterna och skyddet mot en arabisk vår på hemmaplan minskar dramatiskt. Produktionsminskningen är ett kortsiktig lösning på en teknologisk innovation.
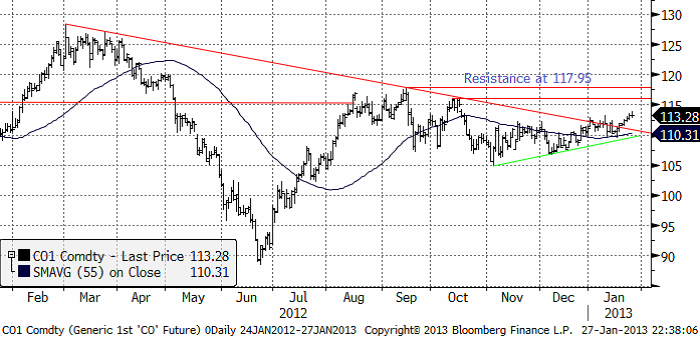
Med det sagt, är det på kort sikt i alla fall uppåt, som trenden pekar. Den som inte har köpt kan kanske vänta på en rekyl, som säkert kommer och försöka komma in i t ex OLJA S vid ett oljepris motsvarande ca 112 dollar.
Elektricitet
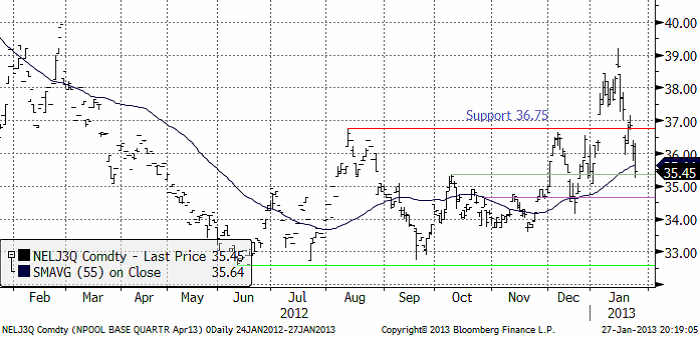
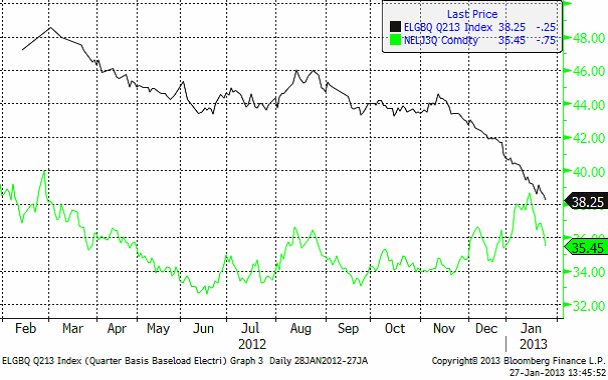
Elpriset, för det andra kvartalet har fallit kraftigt. Marginalkostnaden för att producera el med kol (som är en viktig fixpunkt för NordPool-priset), har som vi tidigare visat fallit kraftigt en längre tid. Den har fortsatt att falla, som vi ser i diagrammet för andra kvartalets terminskontrakt nedan. Priset hamnade i fredags på en stödnivå. Det ger en viss vägledning om att den kraftiga rekylen kanske vänds i uppgång den här veckan. Det är en mycket volatil marknad för elkraft just nu.
Elpriset i Tyskland (den svarta linjen nedan), speglar prisfallet på kol. Vi ser att prisfallet i Tyskland nu fått ner priset så pass att det börjar tynga priset på NordPool (grön linje). Båda kontrakten avser andra kvartalet och priserna är båda i euro per MWh.
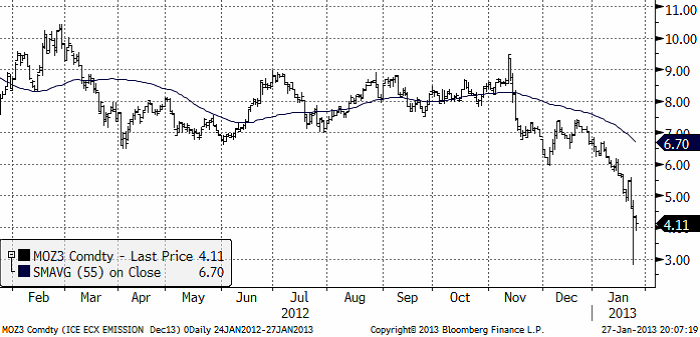
Nedan ser vi terminspriset på utsläppsrätter (euro per ton koldioxid). Som vi ser har priset varit fallande en längre tid, men drabbades av en riktig genomklappning i veckan med själva ”krisen” i torsdags. Det finns ett över skott av utsläppsrätter i Europa och får man inte spara dem in i ”nästa” period, bör priset rationellt sett falla till noll. Prisfallet gör naturligtvis att det blivit ännu billigare att producera el med kol i Europa.
Källa: Bloomberg
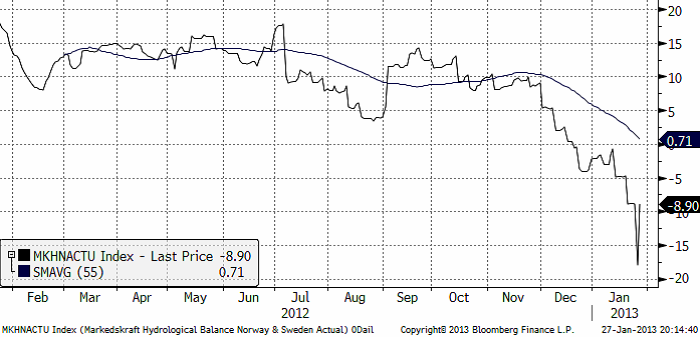
Baksidan av prisfallet i utsläppsrätterna är att potentialen för ytterligare prisfall är begränsad av nollan. Det ger också ett visst stöd för marknaden. Den hydrologiska balansen föll i veckan ner mot -18 TWh, men ligger nu enligt Markedskraft på -8.9 TWh.
Sammanfattningsvis. CO2-marknaden ligger väldigt nära nollan och kan inte verka sänkande på elpriset längre (i någon större omfattning). Konjunkturen i världen ser ut att hämta sig, vilket kan ge stöd för kolmarknaden. Den hydrologiska balansen visar ett underskott för ”vårflodskontraktet” andra kvartalet. Det finns alltså vissa positiva faktorer som marknaden kanske väljer att ta fasta på den kommande veckan. Vi rekommenderar alltså kortsiktigt köp, för den modige.
Naturgas
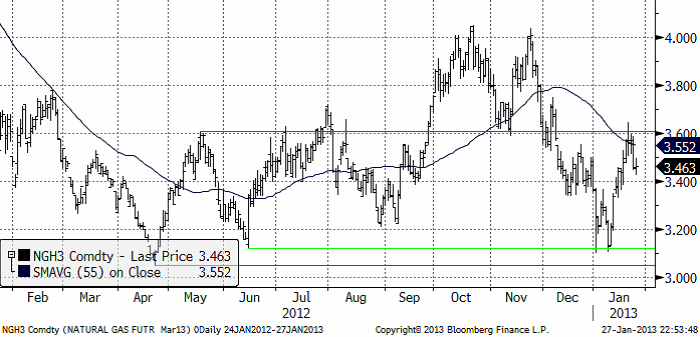
Naturgasterminen på NYMEX (mars 2013) föll så som vi förutspådde förra veckan tillbaka från motståndet vid 3.60 dollar per MMBtu. Stöd finns dock vid 3.40 och det kan vara ett köptillfälle på kort sikt. Vi ser att det stora prisfallet som ägt rum i spåren av fracking-teknikens spridning i USA har stannat av vid 3 dollar. Det senaste året har priset rört sig mellan 3 och 4 dollar. 3.40 är en nivå under mitten av det intervallet. Även om det inte är i botten, ser det trots allt ut som en attraktiv prisnivå. Det europeiska gaspriset är mer än dubbelt så högt och om tillstånd för export av amerikansk LNG ges, finns en viss potential för priset i USA att hamna på en högre nivå på längre sikt.
Den som kortsiktigt vill prova på att handla naturgas, kan kanske försöka sig på ett mycket kortsiktigt inhopp i BEAR NATGAS X4 S. På längre sikt tror vi att man bör vara neutral.
Guld och Silver
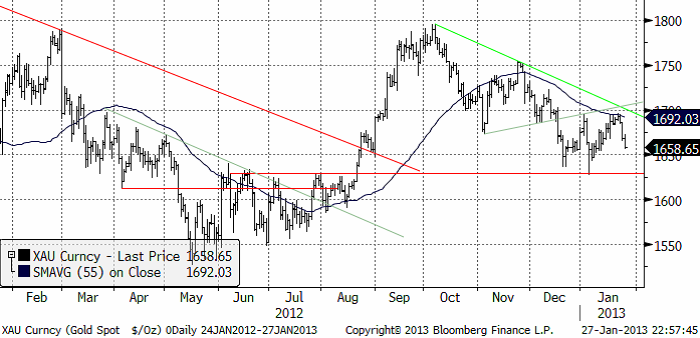
Precis som vi skrev förra veckan, följde guldpriset handboksexemplen i teknisk analys och föll ner från spetsen på den triangelformation som bildades mellan september och december. Brottet var på nersidan och förrförra veckans uppgång var en klassisk rekyl upp till utbrottsnivån. Detta signalerar att ytterligare prisfall på guld är att vänta. Vi går därför över till kortsiktig säljrekommendation på guld. Stödet finns på 1629 dollar per ozt och dit i första hand tror vi priset går.
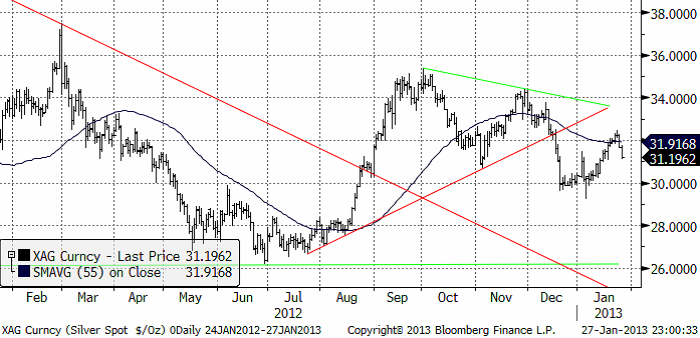
Nedan ser vi kursdiagrammet för silver i dollar per troy ounce. Situationen är snarlik den för guld. Rekyl ner till 30 dollar är att vänta. Kortsiktig BEAR-rekommendation för silver också.
Platina
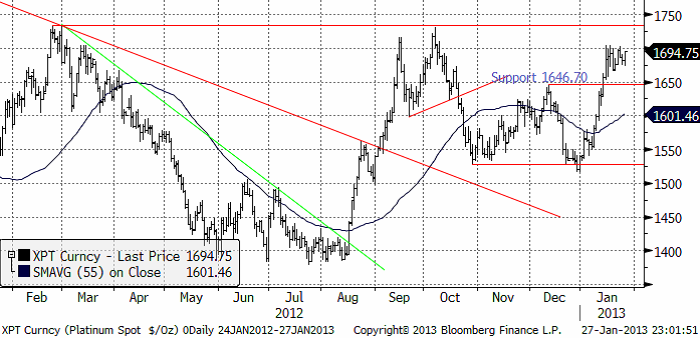
Platina har konsoliderat prisuppgången i två veckor. En växande efterfrågan från biltillverkning, framförallt i Kina, ger stöd förpriset. Motsvarande efterfrågefaktor saknas för guld och silver. En återhämtning i global ekonomi verkar stödjande för platina, men eftersom oron för statsfinansiell bankrutt minskar, får detta en negativ effekt på priserna på silver och guld. Ska man vara köpt en ädelmetall är därför platina att föredra.
Det går just nu inte att ge en rekommendation på kort sikt, eftersom konsolideringsfasen fortfarande pågår. Vi får vänta och agera på utbrott från den. Sker det uppåt – köp BULL. Sker det nedåt – köp BEAR.
Notera att det finns ett tämligen välprövat och starkt motstånd på 1734 dollar. Om detta bryts inleds troligtvis en stark prisuppgång.
Nedan ser vi priset på platina i termer av guld, eller ”växelkursen” mellan XPT och XAU, valutakoderna för de två ädelmetallerna. Kvoten ligger precis på toppen från mars förra året. Det innebär att platina är ”dyrt” i förhållande till guld i ett historiskt perspektiv. Och fundamentalt är det kanske inte något fel i det. Men det kan ändå finnas en del säljordrar just vid eller bara strax ovanför dagens kursnivå.
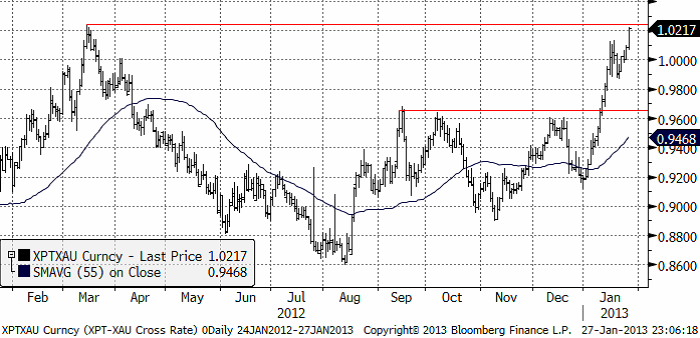
Slutsats: avvakta utbrott från konsolideringen vad gäller platina. Relationen till guld i priset på platina indikerar att det finns motstånd på uppsidan. Ska man gissa, så kanske utbrottet för platinas del därför sker på nersidan.
Basmetaller
Den avvaktande stämningen med mer eller mindre sidledes prisrörelser fortsatte i veckan. På makrofronten redovisades ett antal positiva nyheter (vilket inte gav någon större effekt på metallpriserna). Det japanska stimulanspaketet (som liknar amerikanska Feds program för obligationsköp) är sjösatt. Amerikanska kongressen hade en omröstning i veckan gällande skuldtaksförhandlingarna som nu skjuts till maj. På fredagen väntade marknaden på resultat av hur mycket de europeiska bankerna har betalt tillbaka i förtid av krislånen, vilket visades sig vara mer än väntat. Det tyska aktivitets-indexet IFO kom in bättre än väntat. Positiva nyheter för Europa för en gång skull. HSBC:s inköpsindex för Kina kom in bättre än väntat, och har etablerat sig stabilt över 50. Det borde vara ”bäddat” för en starkare konjunktur och bättre efterfrågan på metaller.
Andra sidan av ekvationen gäller utbudet och där har det redovisats produktionssiffror från flera globala producenter, som i flera fall bekräftar farhågorna att utbudet ökar mer än väntat. Det gäller framför allt koppar, nickel och aluminium. Samtidigt är marknaden avvaktande inför eventuella nya signaler från Kina inför det nyåret i mitten av februari. Priserna var överlag nedåt under veckan, kring procenten. Den ”lysande stjärnan” är zinken som visade en uppgång på 2 %.
Koppar
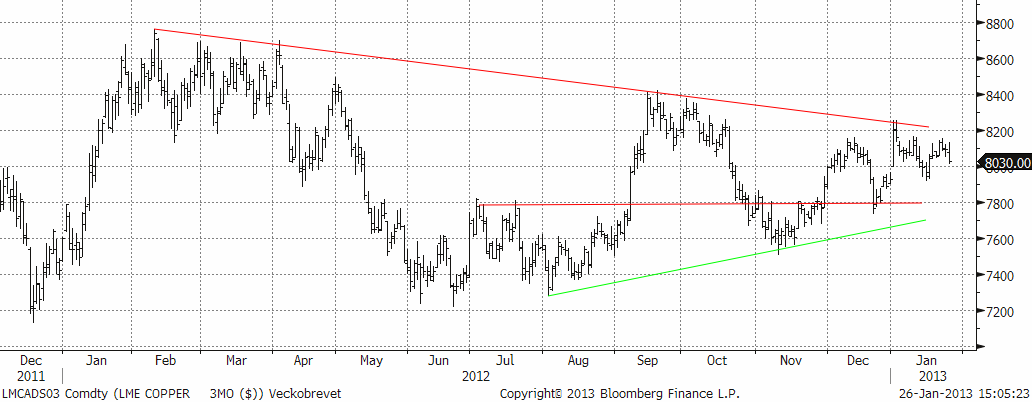
Koppar har det lite trögt just nu. Varje försökt till uppgång möter motstånd. Veckan avslutas på minus 0,6 % för 3-månaders koppar på LME. Världens största kopparproducent, chilenska Codelco uttalade att de tror på överskott i år. Marknaden har haft underskott i flera år beroende på låga halter just i Chile. Men även väderrelaterade produktionsstörningar har varit ett problem i kombination med arbetsmarknadskonflikter. Codelco lyckades öka produktionen mer än väntat under Q4 vilket får marknaden att tro att utbudet nu till slut ökar. Prisnivån i relation till produktionskostnader borde leda till ökad produktion.
Men detta har sagts tidigare år och marknaden är inte helt övertygad. En indikator på gruvutbudet är den s.k. smältlönen till smältverken, som länge p.g.a. lågt malmutbud varit till smältverkens nackdel (dvs. låga smältlöner). I veckan publicerades nya gällande smältlöner som är ca 10 % högre (70 usd/ton mot förra årets 63). Det tyder på ökat utbud från gruvorna. Nytt i år är halvårsvisa avtal. Håll utkik i juni/juli hur smältlönerna utvecklas för fortsatt vägledning. Den tekniska bilden är relativt neutral för tillfället. Om LME-noteringen (3 månaders) kommer ned mot $7800 är det ett köp.
Alternativet är att avvakta ett brott på uppsidan kring $8200 (över trendlinjen), alternativt $8400 (toppen från september).
Aluminium
Aluminium följde med koppar nedåt under fredagshandeln och stänger marginellt ned på veckan. Aktörerna fokuserar på terminskurvan och den LME-relaterade kortheten från december förra året, som nu flyttats ”längre ut på kurvan”. Normalt rullas positioner 3 månader framåt vilket skulle innebära en stram marknad i mars. Nu är det istället juni som börjar bli tight.
Ur ett investeringsperspektiv gör det marknaden ovanligt svåranalyserad. Rent fundamentalt är efterfrågeutsikterna väldigt goda med positiva rapporter vad gäller efterfrågan från framför allt bil- och flygindustrin. Det som gör oss tveksamma för uppsidan är en fortsatt ökande produktion, och det kan dröja 1-2 år innan marknaden är i balans.
Zink
Zinken gick mot strömmen i veckan och är upp hela 2 %, imponerande med en i övrigt ganska medioker utveckling för basmetaller. Delvis är det en anpassning eftersom zinken fick lida mer av omviktning av råvaruindex i början av året då stora volymer skulle säljas. Tekniskt sett ser också zinken starkare ut och strävar i första hand att bryta igenom motståndet kring $2100, det verkar vara relativt svårt just nu, men vi kvarstår med bedömningen att zink har bra potential. Som vi skrivit tidigare är de största användningsområdena för zink bygg- och transportindustrin. Två områden som nu gynnas av en mer positivt syn på tillväxten i Kina och USA. Zink ligger väl placerad i det scenariot.
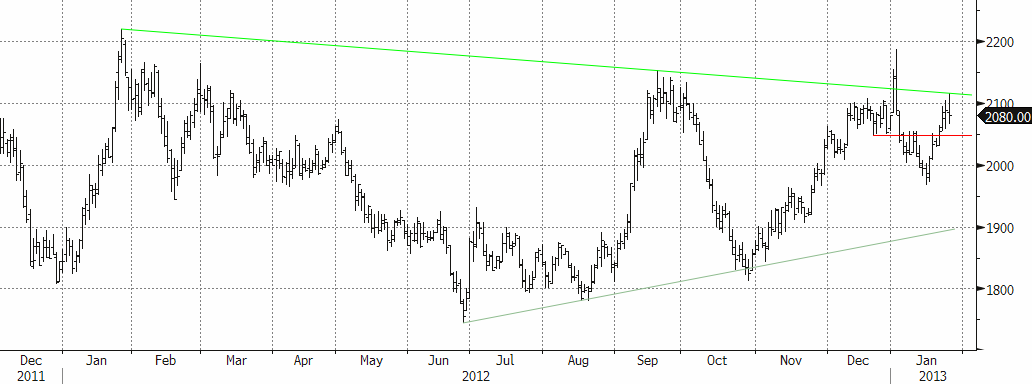
Vi rekommenderar köp av ZINK S eller BULL ZINK X2 / X4 S för den som vill ta mer risk. Man bör gå ur positionen om priset faller genom 1930 dollar per ton, som är stödet i den konsolideringsfas som varit rådande sedan prisfallet slutade i slutet av maj. Kortsiktigt bör man ta hem vinst vid motståndsnivån $2150. På lite längre sikt är potentialen större. Nästa motståndsnivå kommer in vid $2200, men målet är $2400 på 2- 3 månaders sikt.
Nickel
De senaste fundamentala rapporter vi tagit del av tyder på en marknad i balans under Q1 2013, detta tack vare att vi är inne i den säsongsmässigt starka perioden. Studier som genomförts styrker vår anekdotiska erfarenhet att perioden nov-april brukar innebära ökad efterfrågan (och stigande nickelpris). Problemet just nu är att utbudet är lite för överhängande för att ge tillräcklig hävstång på priset (detta bekräftades av produktionsdata i veckan). Nickel kan dock erfarenhetsmässigt ofta överraska med sin prisrörlighet. Den tekniska bilden ser generellt positiv ut med en tendens till ”högre bottnar”. Det blir viktigt hur marknaden beter sig i intervallet $17000 och $18000. Det viktigt att den nedre nivån håller för att hålla uppe tempot. Bryter det på uppsidan kan det ta ordentligt fart, med ett kortsiktigt mål på $19000.
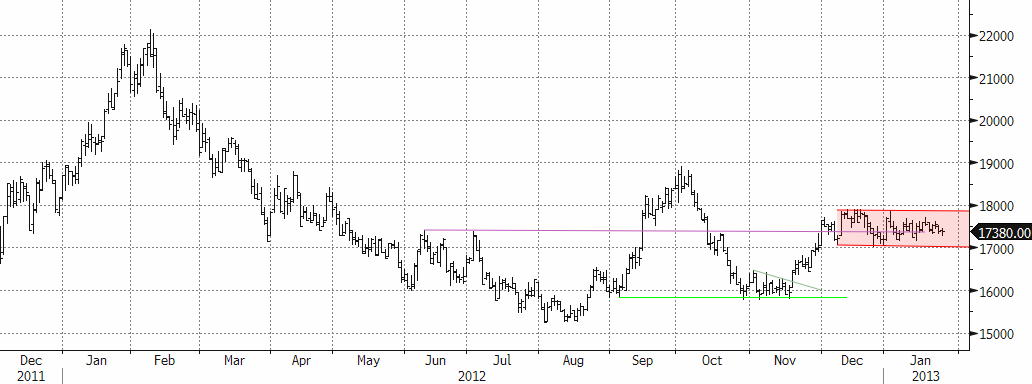
Vi rekommenderar köp av NICKEL S eller BULL NICKEL X2 / X4 S för den som vill ta mer risk. Man bör gå ur positionen om priset faller genom 15,800 dollar per ton, som är stödet i den konsolideringsfas som varit rådande sedan prisfallet slutade i slutet av oktober. Kortsiktigt bör man ta hem vinst vid moståndsnivån $18000. På lite längre sikt är potentialen större. Nästa motståndsnivå kommer in strax under $19000.
Kaffe
Kaffepriset backade med 5% i veckan. Eftersom dollarn också försvagades föll KAFFE S med 8% till 23 kr per certifikat. Tekniskt har marknaden kommit lägre i vad som ser ut att kunna bli en trendvändning uppåt. Motståndet på 157.35 orkade marknaden inte ta sig över efter att ha varit i fallande trend så länge. Priset föll alltså tillbaka ner i veckan. Priset ser ut att vara på väg ner mot stödet på 141.85 cent per pund. När priset närmar sig tror vi det är dags att ta nya positioner i KAFFE S. Man måste dock begränsa förlusterna om det visar sig att stödet inte håller. Går priset under 141.85 cent per pund, bör man sälja.
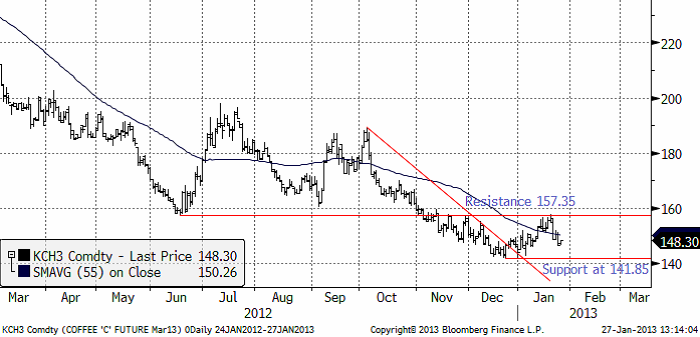
Fokus i marknaden har länge varit Brasiliens stora skörd. Colombias problem med sjunkdomar är mindre viktigt, eftersom Brasiliens produktion är flera gånger större nuförtiden. Dessutom är kaffet numera också av lika bra eller bättre kvalitet.
Men, en stor del av Mellanamerikas kaffeodlingar är angripna av bladmögel och smittan sprider sig. Mellanamerika står för 14% av global produktion. Guatemalas president Otto Perez Molina sade i torsdags när han talade i Davos att Guatemala kan förlora en tredjedel av sin skörd pga rostangreppen. Costa Ricas president Laura Chinchilla sade att landets skörd kan bli 30 – 40% lägre än väntat pga de tilltagande rostangreppen. Trots att nyheter om möglets spridning i Mellanamerika har kommit då och då, har marknaden haft fokus helt inställt på Brasilien och det ovanliga i att skörden där ser ut att kunna bli upp emot 50.2 miljoner säckar (60 Kg), vilket är rekord för ett år med lägre väntad produktion. Kaffe är en vartannat-års-gröda.
Vi har tidigare refererat till ICO, kaffeorganisationen, som i sin senaste månadsrapport pekade på att priserna är nära botten. Vi fortsätter att dela den uppfattningen och tycker att man ska handla kaffe från den ”långa” sidan. Vi fortsätter därför att generellt sett rekommendera köp av KAFFE S, med taktiken enligt den tekniska analysen ovan.
Socker
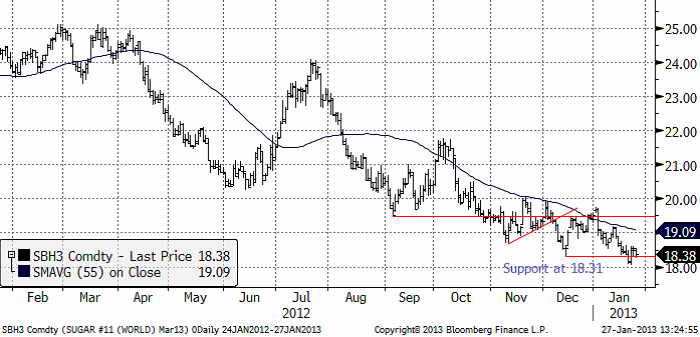
Sockerpriset (mars 2013) fortsatte sitt prisfall i början av veckan och bröt stödet på 18.31. I onsdags vände priset tillbaka över och stängde i fredags på 18.31 cent per pund. Sockerpriset har det gemensamt med kaffe att det fallit kraftigt i pris under hela förra året. Men medan det börjar komma stödjande fundamental information för kaffet, gör det inte det för socker på samma sätt. I veckan kom t ex rännilar av nyheter som tyder på ett förslag att införa tull på etanol för att importera till EU. Vad vi förstår har det är förslaget inte gått till Kommissionen än. Vad vi erfar är att beslutet har hög sannolikhet att gå igenom.
Vi fortsätter med neutral rekommendation på socker.
För övriga jordbruksråvaror se SEB Jordbruksråvaror.
[box]SEB Veckobrev Veckans råvarukommentar är producerat av SEB Merchant Banking och publiceras i samarbete och med tillstånd på Råvarumarknaden.se[/box]
Disclaimer
The information in this document has been compiled by SEB Merchant Banking, a division within Skandinaviska Enskilda Banken AB (publ) (“SEB”).
Opinions contained in this report represent the bank’s present opinion only and are subject to change without notice. All information contained in this report has been compiled in good faith from sources believed to be reliable. However, no representation or warranty, expressed or implied, is made with respect to the completeness or accuracy of its contents and the information is not to be relied upon as authoritative. Anyone considering taking actions based upon the content of this document is urged to base his or her investment decisions upon such investigations as he or she deems necessary. This document is being provided as information only, and no specific actions are being solicited as a result of it; to the extent permitted by law, no liability whatsoever is accepted for any direct or consequential loss arising from use of this document or its contents.
About SEB
SEB is a public company incorporated in Stockholm, Sweden, with limited liability. It is a participant at major Nordic and other European Regulated Markets and Multilateral Trading Facilities (as well as some non-European equivalent markets) for trading in financial instruments, such as markets operated by NASDAQ OMX, NYSE Euronext, London Stock Exchange, Deutsche Börse, Swiss Exchanges, Turquoise and Chi-X. SEB is authorized and regulated by Finansinspektionen in Sweden; it is authorized and subject to limited regulation by the Financial Services Authority for the conduct of designated investment business in the UK, and is subject to the provisions of relevant regulators in all other jurisdictions where SEB conducts operations. SEB Merchant Banking. All rights reserved.

Market is starting to take US/Iran headlines with a pinch of salt. Brent crude rose $2.8/b yesterday to an official close of $112.1/b. But after that it traded as low as $108.05/b before ending late night at around $109.7/b. Through the day it traded in a range of $106.87 – 112.72/b amid a flurry of news or rumors from Iran and the US. ”US temporary sanctions during negotiations” (falls alarm). ”We will bomb Iran” (not anyhow),… etc. While the market is still fluctuating to this kind of news flow, it is starting to take such headlines with a pinch of salt.

We’ll see. Maybe, maybe not. The Brent M1 contract is trading at $110.2/b this morning which very close to the average ticks through yesterday of $110.4/b.
Trump with bearish, verbal intervention whenever Brent trades above $110/b it seems. What seems to be a pattern is that Trump states something like ”very good negotiations going on with Iran”, ”New leaders in Iran are great,..”, ”Great progress in negotiations,…”, ”Deal in sight,..” etc whenever the Brent M1 contract trades above $110/b. An effort to cool the market. These hot air verbal interventions from Trump used to have a heavy bearish impact on prices, but they now seems to have less and less effect unless they are backed by reality.
As far as we can see there has been no real progress in the negotiations between the US and Iran with both sides still standing by their previous demands.
Iran is getting stronger while the cease fire lasts making a return to war for Trump yet harder. Iran is naturally in constant preparation for a return to war given Trump’s steady threats of bombing Iran again. Iran is naturally doing what ever is possible to prepare for a return to war. And every day the cease fire lasts it is better prepared. This naturally makes it more and more difficult and dangerous for the US to return to warring activity versus Iran as the consequences for energy infrastructure in the Persian Gulf will be more and more severe the longer the cease fire lasts. Israel seems to see it this way as well. That the war is not won and that current frozen state of a cease fire gives Iran opportunity to rebuild military and politically.
Global inventories are drawing down day by day. How much? In the meantime the Strait of Hormuz stays closed. There is varying measures and estimates of how much global inventories are drawing down. Our rough estimate, back of the envelope, is that global inventories are drawing down by at least some 10 mb/d or about 300 mb/d in a balance between loss of supply versus demand destruction. Other estimates we see are a monthly draw of 250-270 mb/d. The IEA only ’measured’ a draw in global observable stocks of 117 mb in April with oil on water rising 53 mb while on shore stocks fell 170 mb. But global stocks are hard to measure with large invisible, unmeasured stocks. As such a back of the envelope approach may be better.
Oil products is what the world is consuming. Oil product prices likely to rise while product stocks fall. Strategic Petroleum Reserves (SPR) are predominantly crude oil. Discharging oil from OECD SPR stocks, a sharp reduction in Chinese crude imports and a reduction in global refinery throughput of 6-7 mb/d has helped to keep crude oil markets satisfactorily supplied. But global inventories are drawing down none the less. And oil products is really what the world is consuming. So if global refinery throughput stays subdued, then demand will eventually have to match the supply of oil products. The likely path forward this summer is a steady draw down in jet fuel, diesel and gasoline. Higher prices for these. Then, if possible, higher refinery throughput and higher usage of crude in response to very profitable refinery margins. And lastly sharper draw in crude stocks and higher prices for these. But some 6 mb/d of oil products used to be exported through the Strait of Hormuz. And it may not be so easy to ramp up refinery activity across the world to compensate. Especially as Ukraine continues to damage Russian refineries as well as Russian crude production and export facilities.
Watch oil product stocks and prices as well as Brent calendar 2027. What to watch for this summer is thus oil product inventories falling and oil product premiums to crude rising. Another measure to watch is the Brent crude 2027 contract as it rises steadily day by day as the Strait of Hormuz stays closed and global oil inventories decline. The latter is close to the highest level since the start of the war and keeps rising.
The Brent M1 contract and the Brent 2027 prices and current price of jet fuel in Europe (ARA). All in USD/b

Our back of the envelope calculation of the global shortage created by the closure of the Strait of Hormuz. Note that 3.5 mb/d of discharge from SPR is also a draw. Note also that ’Forced demand loss’ of 2.5 mb/d is probably temporary and will fall back towards zero as logistics are sorted out leaving ’Price demand loss’ to do the job of balancing the market. Thus a shortfall of at least 9 mb/d created by the closure. More if SPR discharge is included and more if Forced demand loss recedes.

Brent is climbing higher. Front-month is at USD 106.3/bl this morning, close to a weekly high and a USD 9/bl jump from Mondays open. This is the move we flagged as a risk earlier in the week: the market shifting from ”a deal is around the corner” to ”this is going to take longer than we thought”.

Analyst Commodities, SEB
During April, rest-of-year Brent remained remarkably stable around USD 90/bl. A stability which rested on one single assumption: the SoH reopens around 1 May. That assumption is now slowly falling apart.
As we highlighted yesterday: every week of delay beyond 1 May adds (theoretically) ish USD 5/bl to the rest-of-year average, as global inventories draw 100 million barrels per week. i.e., a mid-May reopening implies rest-of-year Brent closer to USD 100/bl, and anything pushing into June or July takes us meaningfully higher.
What’s changed in the last 48 hours:
#1: The US military has formally warned that clearing suspected sea mines from SoH could take up to six months. That is a completely different timescale from what the financial market is pricing. Even a political deal tomorrow does not immediately reopen the strait.
#2: Trump has shifted his tone from urgency to ”strategic patience”. In yesterday’s press conference: ”Don’t rush me… I want a great deal.” The market is reading this as a president no longer feeling pressured by timelines, with the naval blockade running in the background.
#3: So far, the military activity is escalating, not de-escalating. Axios reports Iran is laying more mines in SoH. The US 3rd carrier strike group (USS George H.W. Bush) is arriving with two countermine vessels. Trump yesterday ordered the US Navy to destroy any Iranian boats caught laying mines. While CNN reports that the Pentagon is actively drawing up plans to strike Iranian SoH capabilities and individual Iranian military leaders if the ceasefire collapses. i.e., NOT a attitude consistent with an imminent deal!
Spot crude and product prices eased off the early-April highs on a combination of system rerouting and deal optimism. Both now weakening. Goldman estimates April Gulf output is reduced by 14.5 mbl/d, or 57% of pre-war supply, a number that keeps getting worse the longer this drags on.
Demand-side adaptation is ongoing: S. Korea has cut its Middle East crude dependence from 69% to 56% by pulling more from the Americas and Africa, and Japan is kicking off a second round of SPR releases from 1 May. But SPRs are finite.
Ref. to the negotiations, we should not bet on speed. The current Iranian leadership is dominated by genuine hardliners willing to absorb economic pain and run the clock to extract concessions. That is not a setup for a rapid resolution. US/Israeli media briefings keep framing the delay as ”internal Iranian divisions”, the reality is more complicated and points toward weeks and months, not days.
Our point is that the complexity is large, and higher prices have only just started (given a scenario where the negotiations drag out in time). The market spent April leaning on the USD 90/bl rest-of-year assumption; that case is diminishing by the hour. If ”early May reopening” is replaced by ”June, July or later” over the next week or two, both crude and products have meaningful room to reprice higher from here. There is a high risk being short energy and betting on any immediate political resolution(!).
Down on Friday. Up on Monday. The Brent June crude oil contract traded down 5.1% last week to a close of $90.38/b. It reached a high of $103.87/b last Monday and a low of $86.09/b on Friday as Iran announced that the Strait of Hormuz was fully open for transit. That quickly changed over the weekend as the US upheld its blockade of Iranian oil exports while Iran naturally responded by closing the SoH again. The US blew a hole in the engine room of the Iranian ship TOUSKA and took custody of the ship on Sunday. Brent crude is up 5.6% this morning to $95.4/b.
The cease-fire is expiring tomorrow. The US has said it will send a delegation for a second round of negotiations in Islamabad in Pakistan. But Iran has for now rejected a second round of talks as it views US demands as unrealistic and excessive while the US is also blocking the Strait of Hormuz.
While Brent is up 5% this morning, the financial market is still very optimistic that progress will be made. That talks will continue and that the SoH will fully open by the start of May which is consistent with a rest-of-year average Brent crude oil price of around $90/b with the market now trading that balance at around $88/b.
Financial optimism vs. physical deterioration. We have a divergence where the financial market is trading negotiations, improvements and resolution while at the same time the physical market is deteriorating day by day. Physical oil flows remain constrained by disrupted flows, longer voyage times and elevated freight and insurance costs.
Financial markets are betting that a US/Iranian resolution will save us in time from violent shortages down the road. But every day that the SoH remains closed is bringing us closer to a potentially very painful point of shortages and much higher prices.
The US blockade is also a weapon of leverage against its European and Asian allies. When Iran closed the SoH it held the world economy as a hostage against the US. The US blockade of the SoH is of course blocking Iranian oil exports. But it is also an action of disruption directed towards Europe and Asia. The US has called for the rest of the world to engaged in the war with Iran: ”If you want oil from the Persian Gulf, then go and get it”. A risk is that the US plays brinkmanship with the global oil market directed towards its European and Asian allies and maybe even towards China to force them to engage and take part. Maybe unthinkable. But unthinkable has become the norm with Trump in the White House.


Sommarväder skapar prisrally på elbörsen
Oil product price pain is set to rise as the Strait of Hormuz stays closed into summer

Solkraften pressar elpriserna dagtid

Michel Gubel ger sin syn på oljemarknaden