

Analys
SEB – Råvarukommentarer, 26 augusti 2013

Rekommendationer
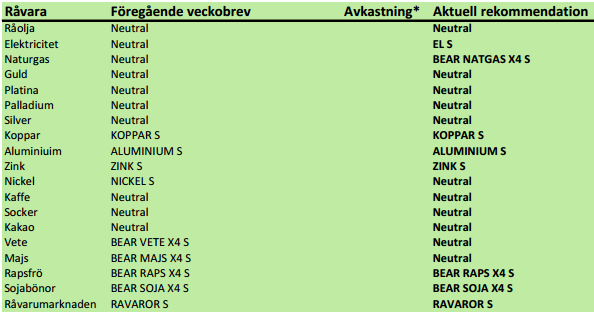
*) Avkastningen lämnar vi blank här eftersom det har varit ett två månaders uppehåll. Generellt sett har dock rekommendationerna varit lyckosamma med kraftiga nedgångar i priset på t ex spannmål och oljeväxter och prisuppgång på basmetaller.
Inledning
I detta första veckobrev efter sommaruppehållet går vi över till neutral på vete och majs, men behåller sälj på soja och raps, som idag rusat nästan 100 cent (sojan) och rapsen förmodligen öppnar upp kraftigt idag vid 11-tiden när börsen öppnar. Det handlar dock om rekyler. I synnerhet raps tycker vi ser färdigt ut vad gäller rekylen och rekommenderar en kortsiktig kort position, dvs BEAR RAPS X4 S.
Vi går också över till neutral på silver och guld. Det hade varit köp för några veckor sedan, men rekylen har gått för långt upp nu.
Vi går över till köp-rekommendation på elen. Det är historiskt låga priser och även om ”tajmingen” kan vara lite ”off” i värsta fall, tror vi att priset generellt sett kommer att vara högre i framtiden. Oljepriset har stärkt sig, som vi trott, men ligger nu väl högt. Oljemarknaden är speciell som placering, eftersom ”backwardation” genererar inkomster till certifikatinnehavaren över tid. Men det är en fördel om man kan göra placeringen på en lägre prisnivå än dagens.
Många råvaror ligger sedan lång tid i fallande pristrender. Några har gjort det i nästan tre år som kaffe och socker, några har gjort det sedan i december (spannmål och oljeväxter) och några tycks ha nått det ”fundamentala golvet” redan, som utgörs av att produktionskostnaden är högre än dagspriset. Då de tar tid för producenter att fatta att det finns en överproduktion, som måste rättas till genom att lägga ner, finns en möjlighet för priset att göra en ”overshooting”. Vi tror att det är vad som håller på att hända i råvarumarknaden. I vissa fall, som ädelmetallerna guld och silver, har återhämtningen redan kommit igång. I andra har det ännu inte inträffat, som t ex i kaffe och socker. Vad gäller vete och oljeväxter kanske den här fasen inte nås förrän nästa år.
Samtidigt har det nyligen publicerats överraskande postiva data på hur eknomin går i världen. I förra veckan publicerades överraskande positiv inköpschefsstatistik i Kina, Tyskland och Europa som helhet. Huspriserna i USA steg med 7.7% jämfört med förra året i juni. De ledande indikatorerna för USA:s ekonomi fortsätter att stärkas. Nu är de på sin högsta nivå sedan sommaren 2008. Detta bör allt annat lika leda till högre efterfrågan på råvaror. Häri finns kanske ”triggern” som kan få priser på vissa råvaror att stiga, givet att ett tidigare överskott i produktionskapacitet reducerats.
Detta gör också råvaror till ett intressant placeringsalternativ när räntorna stiger och gör obligationer oattraktiva, börsen fått säljrekommendation av flera stora globala investmentbanker (Morgan Stanley förutspår t ex en 10% korrigering under hösten).
Råolja – Brent
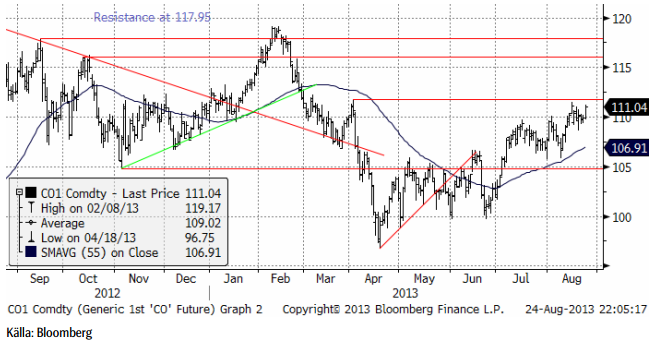
I det sista veckobrevet innan sommaruppehållet skrev jag att ”Tekniskt ser det ut som om uppgången har goda chanser att bryta igenom motståndet på 105 dollar och kanske gå upp mot 107 dollar i det mycket korta perspektivet av den kommande veckan. ”Vad vi fick var en uppgång till strax under 107 dollar, sedan en kraftig rekyl ner till 100 dollar och därefter en ny uppgång som fortfarande pågår. I fredags stängde spotkontraktet på 111.04 dollar. Som vi ser i diagrammet nedan, finns ett motstånd på 111.87 dollar, markerad av toppen i början på april och testad (höll) nu i augusti.
Råoljelagren i USA, som vi vant oss vid att se på en hög nivå, har fallit och ligger nu under förra årets nivå och nära det femåriga intervallet för åren 2007 – 2011. Nedan ser vi amerikanska råoljelager enligt DOE i tusen fat. Den svarta kurvan är 2012 års lagernivåer vecka för vecka och den lilla röda linjen är 2013 års nivå.
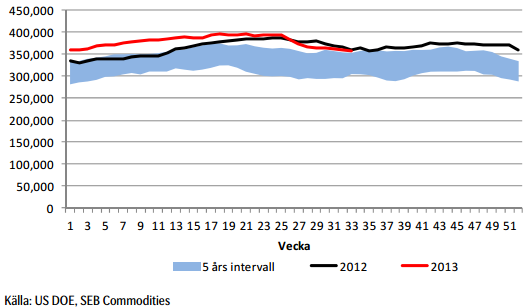
Importen fortsätter att hålla sig under förra årets nivå.
Vår vy är neutral. Det kan bli svårt för oljepriset att ta sig över det tekniska motståndet på 111.87 dollar.
Elektricitet
Tidningen Privata Affärer publicerade i veckan som gick en artikel om de låga vattennivåerna i magasinen – med varningen att elpriset kan bli högt i vinter. Eftersom fokus redan är på elpriset i vinter, hoppar vi direkt till första kvartalets kontrakt. Det är inte det som är underliggande för EL S och BULL EL X4 S just nu, men i början på september rullas det in i det kontraktet, så vi kan lika gärna titta på det nu. Rullning betyder att värdeförändringen på certifikaten slutar att uppdateras med de procentuella dagsförändringarna i priset på det tredje kvartalets kontrakt och ersätts med de procentuella dagsförändringarna i det fjärde kvartalets kontrakt. Även om kontrakten prismässigt ligger på olika nivåer, blir det alltså inget ”hopp” i värdet på certifikatet.
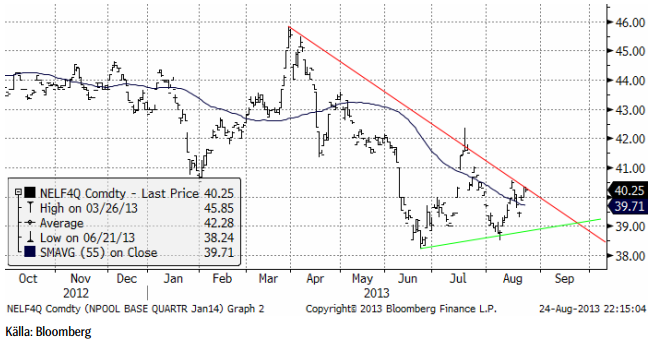
Nedan ser vi prisdiagrammet på det första kvartalets 2014 kontrakt. Vad vi ser är successivt lägre toppar sedan mars månad, och successivt högre bottnar sedan juni. Detta bildar en inom den tekniska analysen, klassiskt så kallad ”triangelformation”. Man ser dem ofta vid trendvändningar. I det här fallet är den huvudsakliga trenden nedåtriktad. Man bör alltid vänta på utbrott från triangeln, men med tanke på dels att priset är riktigt lågt i ett historiskt perspektiv och att det varit en varm och regnfattig sommar, med underskott i vattenmagasinen, ett år äldre kärnkraftverk, så skulle det inte förvåna om priset steg.
Vi ska se lite mer i perspektiv hur lågt elpriset är just nu. Nedan ser i spotkontraktet på ”årskontraktet” för el, dvs vad det skulle kosta att prissäkra ett helt kalenderår. Just nu är underliggande priset för att prissäkra leverans av el under hela år 2014. Diagrammet är på månadsbasis.
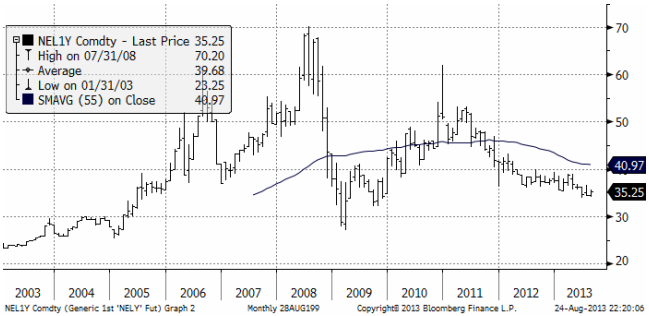
Vi tror att det är riktigt låga priser på el just nu. Det är orsakat av riktigt låga priser på kol, bottennivåer på utlsläppsrätter och allmän lågkonjunktur. Även om ”tajmingen” kan missa, är elpriset nedtryckt av att alla faktorer är i botten. Det borde rimligtvis vara bättre att vara köpt än att vara såld elpriset. I synnerhet som tillväxten, t ex i USA tycks vara på väg tillbaka.
Hydrologisk balans har fortsatt att stiga, som vi ser i nedanstående diagram.
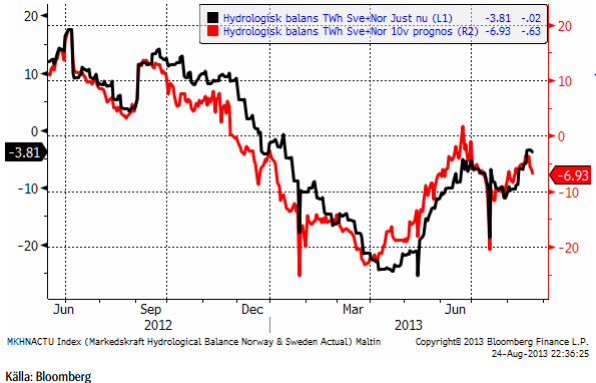
Däremot ser vi också att prognosen för 10 veckor framåt pekar nedåt. Den har varit en god indikator tidigare och uppvisar också trender.
Vi rekommenderar alltså försiktigt köp av el, t ex EL S, som har mindre risk än BULL EL X4 S.
Naturgas
Naturgaspriset har varit fallande sedan maj, men har rekylerat upp i augusti. Vi tror att det handlar om just en rekyl och att priset kommer att vända ner igen.
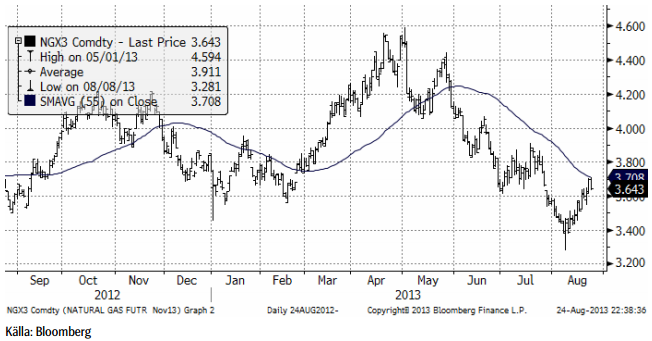
EIA räknar med att år 2013 blir det sjätte året på raken med rekordproduktion av naturgas i USA.
Guld & Silver
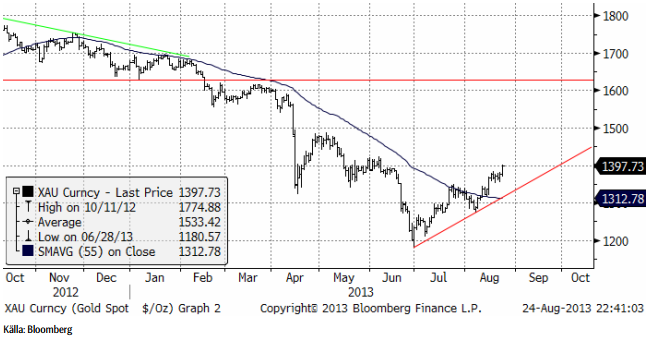
Guldpriset har rekylerat upp och nått upp till nivåer där rekylen torde stöta på motstånd i det korta perspektivet.
Den största börshandlade investeringsprodukten på guld, GLD, som investerare sålt av friskt under våren, har faktiskt attraherat nettoinflöden för första gången sedan november förra året. Vi ser antal GLD-bevis utestående i röd kurva nedan och guldpriset som den tunnare svarta.
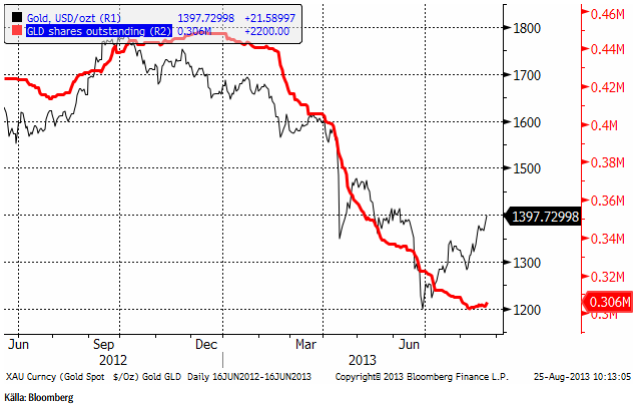
Återigen ser vi att det faktiskt är guldpriset som är den ledande faktorn och investerarna som följer efter.
Nedan ser vi kursdiagrammet för silver i dollar per troy ounce. I fredags bröt priset upp från en flagga. Flagg-formationer ser man ofta i efterhand ”på halv stång”, dvs i mitten av en uppgång. Detta gör att prisuppgången skulle kunna nå upp till 27 dollar per ozt. Å andra sidan finns ett starkt motstånd redan vid 25 dollar, där rekylen uppåt i april tog slut.
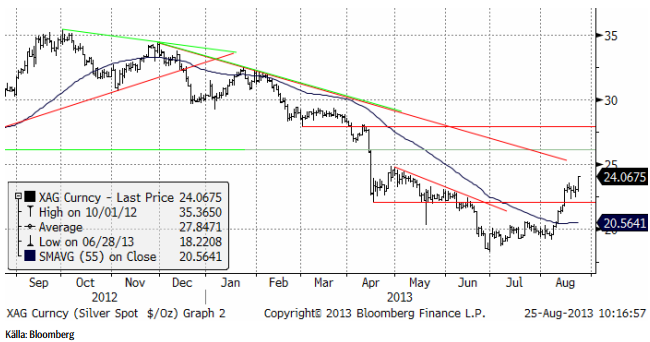
Innan sommaruppehållet skrev jag att nedgången troligtvis skulle nå så långt ner som till 20 dollar. Vi vill knappast fortsätta vara köpta i BEAR och har förhoppningsvis lämnat den positionen under sommaren, men i dagsläget vill vi inte heller riktigt gå in i BULL, eftersom det är så nära motstånd strax ovanför dagens nivå. Vi avvaktar ett bättre köptillfälle, alltså.
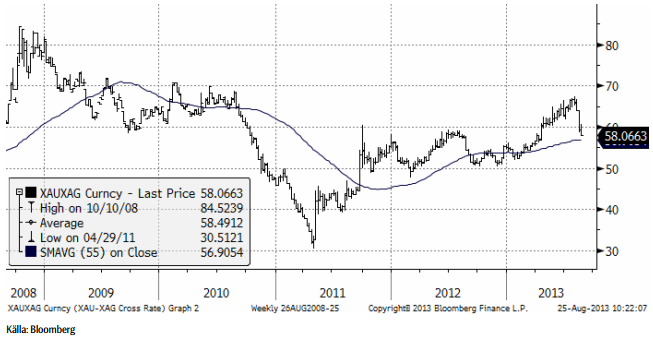
Nedan ser vi kvoten mellan guldpriset och silverpriset. När folk under 2011 trodde att en storbank sålt mer ”papperssilver” än vad som fanns i världen, gick kvoten ner till rekordlåga 30. Därefter har silver tappat mark dubbel så mycket som guld och kvoten nästan nått 70. Detta hänger ihop med baisse-marknaden. Silver brukar ta ut svängarna mer än vad guldmarknaden gör. När så vinden vände i augusti, har silvermarknaden varit snabbare än guldmarknaden. Silver handlar nu i linje med det historiska medelvärdet på kvoten till guld, som är ca 50. Idag är det alltså egalt om man köper silver eller guld.
Platina & Palladium
Amplats, som under sex månader gått igenom sin verksamhet har kommit fram till att reducera arbetsstyrkan med 6900 personer, vilket är mindre än de 14,000 som bolaget initialt siktat på i januari. 6,900 anställda är 12.5% av de totalt 48,000 anställda. Som tidigare har meddelats minskar produktionen till 2.2 – 2.4 miljoner troy uns (mozt). Produktionen förra året (2012) var 2.38 moztoch under 2011, 2.53 mozt. 2012 års produktion drabbades av strejkerna vid gruvorna i Sydafrika. Produktionsneddragningarna går långsammare än väntat och den här besvikelsen är tydligt ”bearish”.
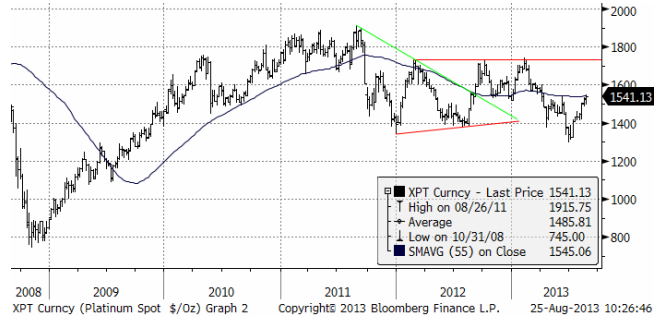
Platina har stigit upp till ett tekniskt motstånd, där priset har vänt ner tidigare i år. Nedan ser vi ett veckochart för de senaste fem åren. Det är ett otydligt läge, där motståndet som finns vid dagens nivå spelar en avgörande roll.
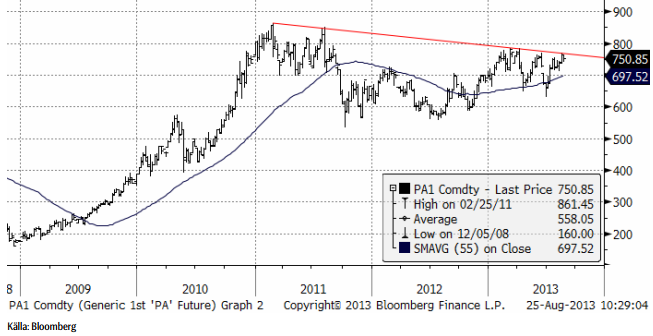
Palladiumpriset ligger precis under ett tekniskt motstånd. Det är en mycket spännande situation rent tekniskt. Motståndet har hållit så många gånger, att ett brott uppåt från den skulle signalera en större förändring i palladiummarknaden. Än så länge ser motståndet dock ut att hålla. Gissningsvis håller motståndet och priset rekylerar nedåt i det korta perspektivet. Skulle motståndet brytas uppåt, vill vi naturligtvis vara köpta palladium.
Vi är för närvarande neutrala platina och palladium.
Koppar
Kinas har länge hämtat material från sina lager som i mars var 1 miljon ton koppar. Nu har lagren nått ner till 300 tton. Kinas import har därför tvingats vända upp under sommaren. ICSG publicerade estimat i maj, som visade en efterfrågan större än utbudet (underskott) för första gången på 7 månader. Underskottet var 17,000, ton, men ändå ett underskott. De första fem månaderna i år visade på ett överskott på 250,000 ton. Under förra året var marknaden i underskott med 400,000 ton. Det tycks onekligen som om kopparmarknaden har blivit bättre balanserad än vad man tidigare trott. Vi tror därför att priset har gott stöd på nedsidan.
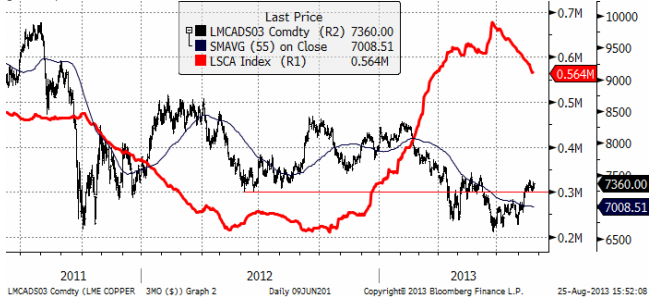
Vi förväntar oss fortsatt hög volatilitet. Vår kortsiktiga bedömning talar för uppsidan och vi rekommenderar därför köp av BULL KOPPAR X2 S eller X4 S.
Aluminium
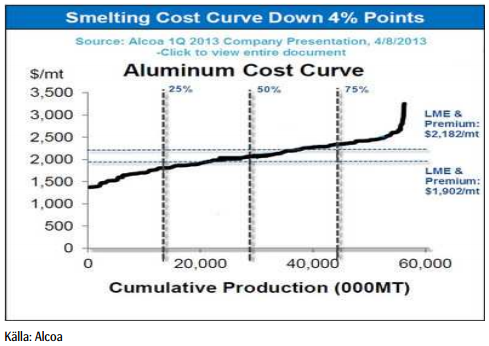
Det har under lång tid producerats mer aluminium än vad som efterfrågats och priset har legat under den nivå som krävs för lönsamhet. Under det första halvåret i år gjordes dock produktionsneddragningar i Kina på 600 – 700 tusen ton. Denna produktionsneddragning har dock ersatts av ny kapacitet. Rusal presenterade mer omfattande försök att åtminstone få marknaden i balans. När bolaget presenterade sin halvårsrapport, annonserade de produktionsneddragningar på 300 till 357 tusen ton. De uppmanade också branschkollegor att göra detsamma. De sade att 2/3 av global produktion var olönsam vid dagens priser. Alcoa var näst på tur att rapportera och de annonserade en neddragning på 200 tusen ton i Brasilien. Det finns mycket kvar att göra i en marknad som årligen har ett överskott på 500,000 – 1 miljon ton. Efterfrågan ökar med ungefär 6% per år. Premier för fysisk vara har sjunkit som en effekt av LME:s förslag som syftar till att korta köerna i LME-systemet. Vi förväntar oss en gradvis effekt på produktionen det kommande året – dvs successivt lägre fysiska premier och ytterligare produktionsneddragningar.
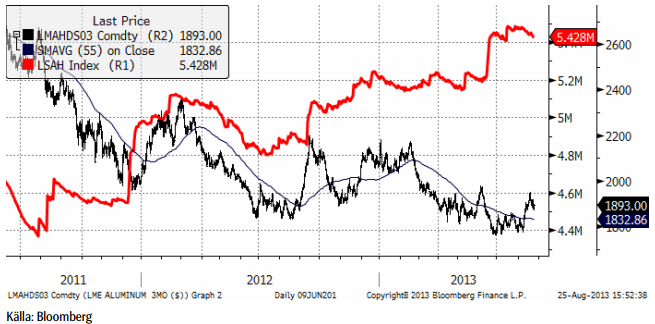
Nedan ser vi produktionskostnadskurvan och LME priset + den fysiska premien.
Zink
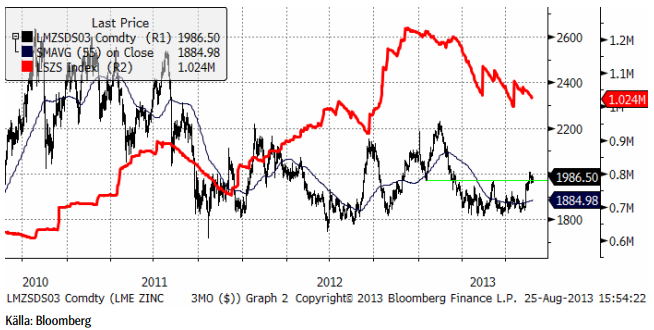
Sedan kursfallet under våren har priset på zink funnit stöd vid 1800 dollar per ton och konsoliderat mellan den nivån på nedsidan och 1950 dollar på ovansidan. I slutet av juli / början av augusti tog sig priset över motståndet.
Fundamentalt har zink i flera år varit överskott, dvs produktionen har varit större än konsumtionen. Enligt ILZG visade det första halvåret i år ett överskott på 44,000 ton. Det ska jämföras med överkottet på 157 ton förra året. ”Bull caset” på zink, som baserar sig på att en betydande gruvkapacitet kommer att stängas de närmaste åren, är fortfarande intakt. Gruvor med 1.5 mt produktion per år väntas stänga under perioden 2013 – 2016. 450,000 ton gruvproduktion förväntas bli nedlagd under 2013 –
2014.
Nedan ser vi kursgrafen och lagren vid LME.
Som vi ser är lagren mycket stora – över 1 miljon ton – bara i LME:s lagerhus.
Nickel
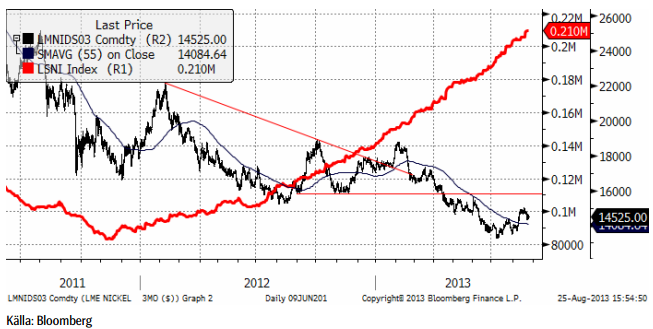
Det huvudsakliga diskussionsämnet i nickelmarknaden är alltjämt överproduktionen av tackjärn med nickelinnehåll i Kina (så kallat Nickel Pig Iron, NPI). Den senaste tekniken, RKEF, har sänkt marginalkostnaden, vilket ytterligare pressat priserna. Detta visar hur viktig teknikutveckling kan vara för prisutvecklingen på råvaror, vilket bland andra ekonomiprofessorn Julian Simon förklarat. En effekt av den ökade användningen av NPI hos kinesiska producenter av rostfritt stål, är ett överutbud av nickel i Kina. Rekordnivån på LME-lagren har huvudsakligen orsakats av inleveranser till lagerhuset i Johor i Malaysia. Det handlar troligen om metall som exporterats från Kina.
Gruvbranschen lider definitivt av dagens låga priser och marknaden behöver se gruvor läggas ner för att åstadkomma balans i utbud och efterfrågan.
[box]SEB Veckobrev Veckans råvarukommentar är producerat av SEB Merchant Banking och publiceras i samarbete och med tillstånd på Råvarumarknaden.se[/box]
Disclaimer
The information in this document has been compiled by SEB Merchant Banking, a division within Skandinaviska Enskilda Banken AB (publ) (“SEB”).
Opinions contained in this report represent the bank’s present opinion only and are subject to change without notice. All information contained in this report has been compiled in good faith from sources believed to be reliable. However, no representation or warranty, expressed or implied, is made with respect to the completeness or accuracy of its contents and the information is not to be relied upon as authoritative. Anyone considering taking actions based upon the content of this document is urged to base his or her investment decisions upon such investigations as he or she deems necessary. This document is being provided as information only, and no specific actions are being solicited as a result of it; to the extent permitted by law, no liability whatsoever is accepted for any direct or consequential loss arising from use of this document or its contents.
About SEB
SEB is a public company incorporated in Stockholm, Sweden, with limited liability. It is a participant at major Nordic and other European Regulated Markets and Multilateral Trading Facilities (as well as some non-European equivalent markets) for trading in financial instruments, such as markets operated by NASDAQ OMX, NYSE Euronext, London Stock Exchange, Deutsche Börse, Swiss Exchanges, Turquoise and Chi-X. SEB is authorized and regulated by Finansinspektionen in Sweden; it is authorized and subject to limited regulation by the Financial Services Authority for the conduct of designated investment business in the UK, and is subject to the provisions of relevant regulators in all other jurisdictions where SEB conducts operations. SEB Merchant Banking. All rights reserved.

Market is starting to take US/Iran headlines with a pinch of salt. Brent crude rose $2.8/b yesterday to an official close of $112.1/b. But after that it traded as low as $108.05/b before ending late night at around $109.7/b. Through the day it traded in a range of $106.87 – 112.72/b amid a flurry of news or rumors from Iran and the US. ”US temporary sanctions during negotiations” (falls alarm). ”We will bomb Iran” (not anyhow),… etc. While the market is still fluctuating to this kind of news flow, it is starting to take such headlines with a pinch of salt.

We’ll see. Maybe, maybe not. The Brent M1 contract is trading at $110.2/b this morning which very close to the average ticks through yesterday of $110.4/b.
Trump with bearish, verbal intervention whenever Brent trades above $110/b it seems. What seems to be a pattern is that Trump states something like ”very good negotiations going on with Iran”, ”New leaders in Iran are great,..”, ”Great progress in negotiations,…”, ”Deal in sight,..” etc whenever the Brent M1 contract trades above $110/b. An effort to cool the market. These hot air verbal interventions from Trump used to have a heavy bearish impact on prices, but they now seems to have less and less effect unless they are backed by reality.
As far as we can see there has been no real progress in the negotiations between the US and Iran with both sides still standing by their previous demands.
Iran is getting stronger while the cease fire lasts making a return to war for Trump yet harder. Iran is naturally in constant preparation for a return to war given Trump’s steady threats of bombing Iran again. Iran is naturally doing what ever is possible to prepare for a return to war. And every day the cease fire lasts it is better prepared. This naturally makes it more and more difficult and dangerous for the US to return to warring activity versus Iran as the consequences for energy infrastructure in the Persian Gulf will be more and more severe the longer the cease fire lasts. Israel seems to see it this way as well. That the war is not won and that current frozen state of a cease fire gives Iran opportunity to rebuild military and politically.
Global inventories are drawing down day by day. How much? In the meantime the Strait of Hormuz stays closed. There is varying measures and estimates of how much global inventories are drawing down. Our rough estimate, back of the envelope, is that global inventories are drawing down by at least some 10 mb/d or about 300 mb/d in a balance between loss of supply versus demand destruction. Other estimates we see are a monthly draw of 250-270 mb/d. The IEA only ’measured’ a draw in global observable stocks of 117 mb in April with oil on water rising 53 mb while on shore stocks fell 170 mb. But global stocks are hard to measure with large invisible, unmeasured stocks. As such a back of the envelope approach may be better.
Oil products is what the world is consuming. Oil product prices likely to rise while product stocks fall. Strategic Petroleum Reserves (SPR) are predominantly crude oil. Discharging oil from OECD SPR stocks, a sharp reduction in Chinese crude imports and a reduction in global refinery throughput of 6-7 mb/d has helped to keep crude oil markets satisfactorily supplied. But global inventories are drawing down none the less. And oil products is really what the world is consuming. So if global refinery throughput stays subdued, then demand will eventually have to match the supply of oil products. The likely path forward this summer is a steady draw down in jet fuel, diesel and gasoline. Higher prices for these. Then, if possible, higher refinery throughput and higher usage of crude in response to very profitable refinery margins. And lastly sharper draw in crude stocks and higher prices for these. But some 6 mb/d of oil products used to be exported through the Strait of Hormuz. And it may not be so easy to ramp up refinery activity across the world to compensate. Especially as Ukraine continues to damage Russian refineries as well as Russian crude production and export facilities.
Watch oil product stocks and prices as well as Brent calendar 2027. What to watch for this summer is thus oil product inventories falling and oil product premiums to crude rising. Another measure to watch is the Brent crude 2027 contract as it rises steadily day by day as the Strait of Hormuz stays closed and global oil inventories decline. The latter is close to the highest level since the start of the war and keeps rising.
The Brent M1 contract and the Brent 2027 prices and current price of jet fuel in Europe (ARA). All in USD/b

Our back of the envelope calculation of the global shortage created by the closure of the Strait of Hormuz. Note that 3.5 mb/d of discharge from SPR is also a draw. Note also that ’Forced demand loss’ of 2.5 mb/d is probably temporary and will fall back towards zero as logistics are sorted out leaving ’Price demand loss’ to do the job of balancing the market. Thus a shortfall of at least 9 mb/d created by the closure. More if SPR discharge is included and more if Forced demand loss recedes.

Brent is climbing higher. Front-month is at USD 106.3/bl this morning, close to a weekly high and a USD 9/bl jump from Mondays open. This is the move we flagged as a risk earlier in the week: the market shifting from ”a deal is around the corner” to ”this is going to take longer than we thought”.

Analyst Commodities, SEB
During April, rest-of-year Brent remained remarkably stable around USD 90/bl. A stability which rested on one single assumption: the SoH reopens around 1 May. That assumption is now slowly falling apart.
As we highlighted yesterday: every week of delay beyond 1 May adds (theoretically) ish USD 5/bl to the rest-of-year average, as global inventories draw 100 million barrels per week. i.e., a mid-May reopening implies rest-of-year Brent closer to USD 100/bl, and anything pushing into June or July takes us meaningfully higher.
What’s changed in the last 48 hours:
#1: The US military has formally warned that clearing suspected sea mines from SoH could take up to six months. That is a completely different timescale from what the financial market is pricing. Even a political deal tomorrow does not immediately reopen the strait.
#2: Trump has shifted his tone from urgency to ”strategic patience”. In yesterday’s press conference: ”Don’t rush me… I want a great deal.” The market is reading this as a president no longer feeling pressured by timelines, with the naval blockade running in the background.
#3: So far, the military activity is escalating, not de-escalating. Axios reports Iran is laying more mines in SoH. The US 3rd carrier strike group (USS George H.W. Bush) is arriving with two countermine vessels. Trump yesterday ordered the US Navy to destroy any Iranian boats caught laying mines. While CNN reports that the Pentagon is actively drawing up plans to strike Iranian SoH capabilities and individual Iranian military leaders if the ceasefire collapses. i.e., NOT a attitude consistent with an imminent deal!
Spot crude and product prices eased off the early-April highs on a combination of system rerouting and deal optimism. Both now weakening. Goldman estimates April Gulf output is reduced by 14.5 mbl/d, or 57% of pre-war supply, a number that keeps getting worse the longer this drags on.
Demand-side adaptation is ongoing: S. Korea has cut its Middle East crude dependence from 69% to 56% by pulling more from the Americas and Africa, and Japan is kicking off a second round of SPR releases from 1 May. But SPRs are finite.
Ref. to the negotiations, we should not bet on speed. The current Iranian leadership is dominated by genuine hardliners willing to absorb economic pain and run the clock to extract concessions. That is not a setup for a rapid resolution. US/Israeli media briefings keep framing the delay as ”internal Iranian divisions”, the reality is more complicated and points toward weeks and months, not days.
Our point is that the complexity is large, and higher prices have only just started (given a scenario where the negotiations drag out in time). The market spent April leaning on the USD 90/bl rest-of-year assumption; that case is diminishing by the hour. If ”early May reopening” is replaced by ”June, July or later” over the next week or two, both crude and products have meaningful room to reprice higher from here. There is a high risk being short energy and betting on any immediate political resolution(!).
Down on Friday. Up on Monday. The Brent June crude oil contract traded down 5.1% last week to a close of $90.38/b. It reached a high of $103.87/b last Monday and a low of $86.09/b on Friday as Iran announced that the Strait of Hormuz was fully open for transit. That quickly changed over the weekend as the US upheld its blockade of Iranian oil exports while Iran naturally responded by closing the SoH again. The US blew a hole in the engine room of the Iranian ship TOUSKA and took custody of the ship on Sunday. Brent crude is up 5.6% this morning to $95.4/b.
The cease-fire is expiring tomorrow. The US has said it will send a delegation for a second round of negotiations in Islamabad in Pakistan. But Iran has for now rejected a second round of talks as it views US demands as unrealistic and excessive while the US is also blocking the Strait of Hormuz.
While Brent is up 5% this morning, the financial market is still very optimistic that progress will be made. That talks will continue and that the SoH will fully open by the start of May which is consistent with a rest-of-year average Brent crude oil price of around $90/b with the market now trading that balance at around $88/b.
Financial optimism vs. physical deterioration. We have a divergence where the financial market is trading negotiations, improvements and resolution while at the same time the physical market is deteriorating day by day. Physical oil flows remain constrained by disrupted flows, longer voyage times and elevated freight and insurance costs.
Financial markets are betting that a US/Iranian resolution will save us in time from violent shortages down the road. But every day that the SoH remains closed is bringing us closer to a potentially very painful point of shortages and much higher prices.
The US blockade is also a weapon of leverage against its European and Asian allies. When Iran closed the SoH it held the world economy as a hostage against the US. The US blockade of the SoH is of course blocking Iranian oil exports. But it is also an action of disruption directed towards Europe and Asia. The US has called for the rest of the world to engaged in the war with Iran: ”If you want oil from the Persian Gulf, then go and get it”. A risk is that the US plays brinkmanship with the global oil market directed towards its European and Asian allies and maybe even towards China to force them to engage and take part. Maybe unthinkable. But unthinkable has become the norm with Trump in the White House.


Sommarväder skapar prisrally på elbörsen
Oil product price pain is set to rise as the Strait of Hormuz stays closed into summer

Solkraften pressar elpriserna dagtid

Michel Gubel ger sin syn på oljemarknaden