

Analys
SEB – Råvarukommentarer, 22 september 2014

Rekommendationer
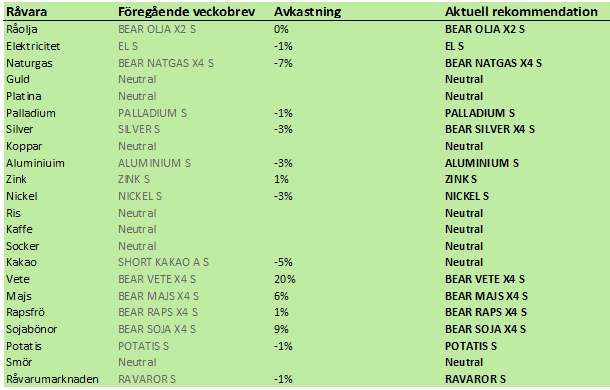
Råvarupriserna är generellt sett i fallande pristrend. Efterfågan från Kina, den största konsumenten av råvaror, visar tecken på svag utveckling. Statistik i veckan som gick på fastighetsmarknaden och direktinvesteringar kom in i det lägre spannet av analytikernas förväntningar.
FED:s uttalande i veckan tolkades som att det blir högre räntor i USA nästa år. Dollarn steg på detta. Högre räntor (och starkare dollar) är negativt för guld och silver, framförallt.
Vetepriset klappade ihop i fredags och prisfallet kan nog fortsätta i veckan som kommer. På jordbruksproduktsfronten är allt svagt, utom möjligen smör och potatis som redan fallit mycket kraftigt.
Råolja – Brent
I bankens senaste oljeanalys förutspås ett genomsnittligt oljepris på 85 dollar per fat för nästa år. Det finns faktorer som kan göra att det blir både högre och lägre. Generellt sett kan man säga att prognosen är en av de som är mest ”bearish” vad gäller oljeprisets utveckling. Oljepriset har varit onormalt högt de tre senaste åren. Det har fått ökningen i efterfrågan att dämpas. Samtidigt ökar produktionen av råolja utanför OPEC snabbare än global efterfrågan. Det beror dels på att priset är högt och dels på fracking-teknikens begynnande genombrott.
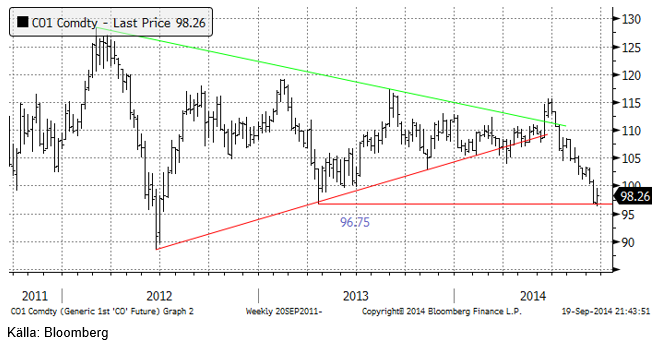
Nedan ser vi ett månadschart för de senaste tio åren. Vi ser att priset har brutit en triangelformation för två månader sedan. Det är enligt handboken i tekniska analys, en negativ signal. Det skulle dock inte förvåna om det kommer en rekyl upp mot 105 dollar innan priset slutligen vänder nedåt. En sådan rekyl uppåt blir i så fall ett bra säljtillfälle för dem som inte hann med att sälja för två månader sedan.

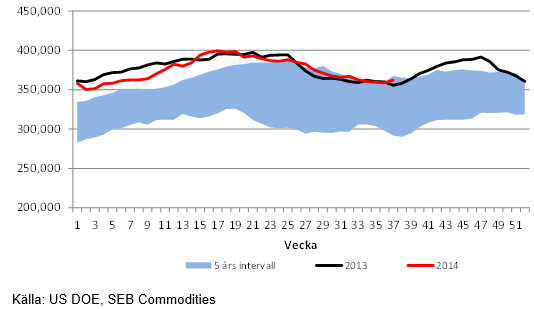
Råoljelagren i USA tycks ha börjat höstens lageruppbyggnad. Det är lite tidigare än förra året, men i stort sett i linje med det historiska genomsnittet. Lagren ökade med nästan 4 mbbl. Lagerökningen beror till viss del på högre import. Importen för veckan var den näst högsta hittills i år på 8,114 mbbl. Förra veckan var importen 7,621 mbbl.
Nedan ser vi ett diagram på antalet oljeriggar i USA, enligt Baker Hughes statistik (svart) och USA:s oljeproduktion enligt US DOE på 8.357 mbpd. Antalet borr-riggar låg i veckan kvar på 1931 riggar, samma antal som förra veckan.
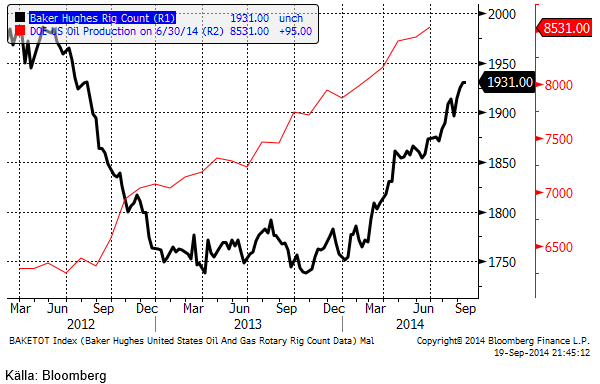
Vi rekommenderar alltså på kort sikt en försiktig kortposition t ex med BEAR OLJA X2 S.
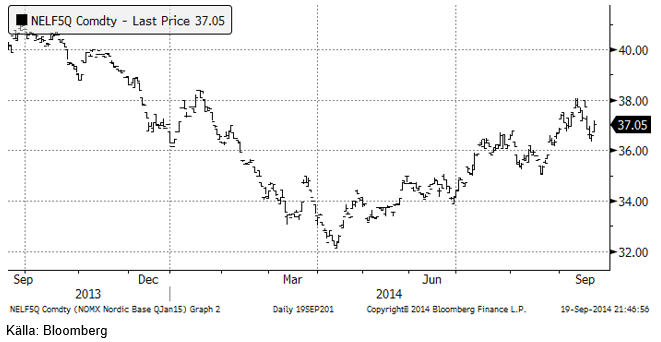
Elektricitet
Priset på el har rört sig uppåt sedan i våras. Det finns nu ett par tecken som kan tolkas negativt för elprisets utveckling:
- Det verkar som om varmare väder kommer in och enligt den senaste väderleksprognosen (se nedan under odlingsväder) kommer det att regna betydligt mer än normalt så här års över västra Scanderna, i Norge. Detta fyller på den hydrologiska balansen.
- Kolpriset i den kontinentala marknaden har fallit mer än dollarn stärkts mot euron. Detta gör att det blir billigare för kolkraftverk att producera el. Dark spread har ökat.
Det här gör att vår vy på prisutvecklingen blir lite mer åt det ”neutrala” hållet. Om Dark spreads fortsätter att stiga och den hydrologiska balansen återvänder till normalt blir det svårt att hålla priset uppe.
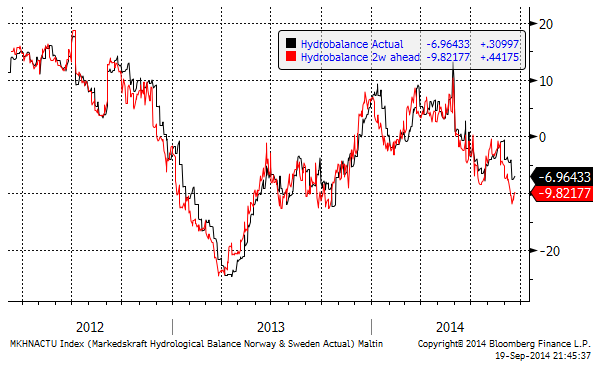
Hydrologisk balans har enligt 2-veckors prognosen vänt uppåt, som vi ser i diagrammet nedan.
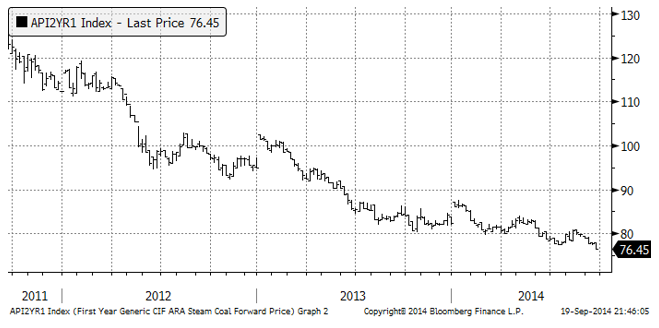
Nedan ser vi terminspriset för kalenderåret 2015 avseende energikol.
Vi rekommenderar köp av EL S om priset kommer ner lite.
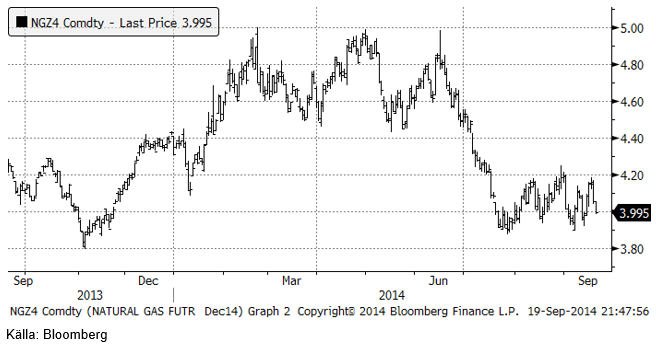
Naturgas
Naturgaspriset (decemberkontraktet) fortsatte att pendla inom det intervall vi noterat tidigare, som har ett golv vid 3.90 och ett tak vid 4.20. Trots att veckan avslutades med ett par dagar med stora prisfall, noterades ändå en liten prisuppgång på veckan. Vi tror att marknaden underskattar kraften i ”fracking” och är därmed mer bearish än marknaden i övrigt.
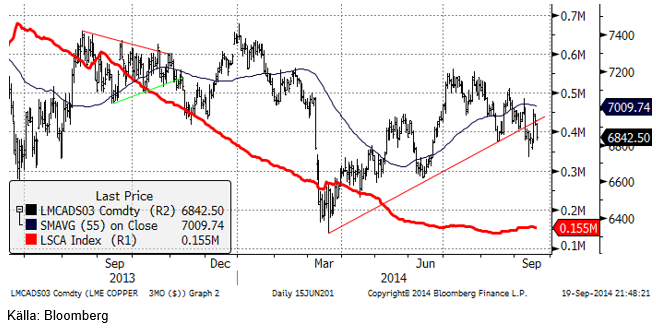
Koppar
Förra veckan hade vi ett resonemang om att den tekniska analysen sade att den stigande pristrenden var bruten. I veckan stod detta helt klart. Uppåttrenden från mars är bruten och det ser till och med ut som om den prisutvecklingen håller på att falla in i den långsiktiga fallande pristrenden.
Fundamentalt väntar sig de flesta att ett överskott ska uppstå som sätter ytterligare press på priset. Bevis på detta finns dock inte riktigt ännu. LME-lagren har bottnat ut, verkar det som, vilket också är normalt under de mindre aktiva sommarmånaderna. Å andra sidan har cash-till-tremånaders pris gått ännu mer in i backwardation och 3 månaders termin är nu 40 dollar billigare än spot (kallat cash i LME-marknaden). Mer backwardation är vanligtvis ett tecken på ökande brist.
Den fysiska premien är lite lägre i USA och i EU enligt Metal Bulletin, men stabil i Shanghai. Så det finns inte någon tydlig bild av utveckling åt något håll vad gäller fundamental analys.
Vi rekommenderar neutral position i koppar.
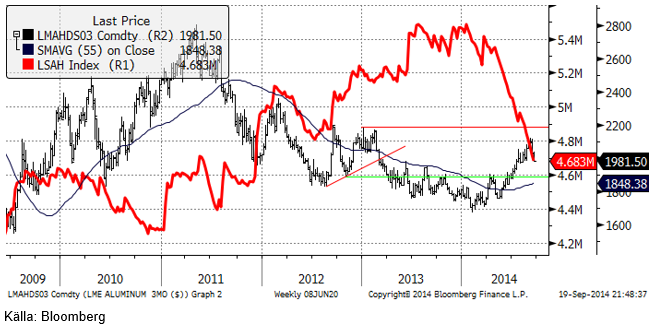
Aluminium
Säljtrycket i aluminium fortsatte i veckan som gick. I torsdags hade nedgången nått ner till den tekniska stödnivån 1980 dollar per ton. Där mötte köpare upp och priset stannade där även under fredagen. Marknaden verkar just nu inte vilja bryta igenom 1980-nivån. Vi har noterat köpintressen från konsumenter och vad vi hör, även från större investerare. Vi tror att de fundamentalt orienterade aktörerna kommer att vinna slaget.
Premierna är rekordhöga. I den amerikanska Mellanvästern har premien för fysiska metall (över LME-noteringen som avser metall som ligger långt in i ett LME-lagerhus och tar lång tid att få ut därifrån), nått 460 dollar per ton!
Lagren på LME minskar samtidigt med 5 – 10 kt om dagen. Det finns alltså inget tvivel om att det råder brist på aluminium-metall på marknaden och det gör att priset bör vara väl understött.
Å andra sidan, om man tar med de fysiska premierna till LME-noteringen, ligger de senaste pristopparna på 2100 (2500 dollar om vi inkluderar premien för fysisk metall) kanske så högt att det utlöser mer produktion. Det här lämnar oss med ett ”tak” och ett ”golv” och alltså en idé om ett aluminiumpris som rör sig inom ett prisintervall om 1950 och 2150 dollar per ton (vi lämnar öppet för att golvet kan bli lägre om priset bryter 1980 och går lägre i veckan som kommer).
Vi fortsätter med köprekommendation på ALUMINIUM S.
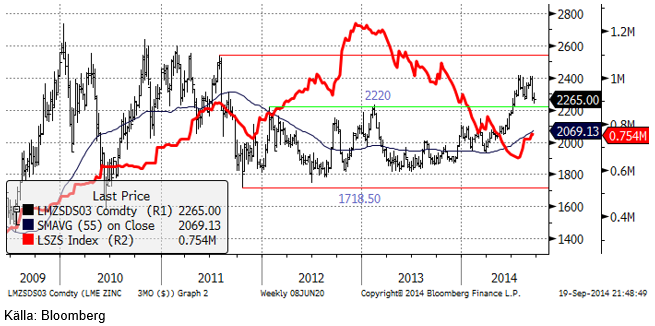
Zink
Oron för den kinesiska efterfrågan ökar. Det gör även utbudet i samma region. Smältverkskapaciteten ser ut att öka. Underskottet i zinkmarknaden under det första halvåret i år väntas vändas till ett litet överskott under det tredje kvartalet. Förändringen i LME-lagren stödjer den här prognosen. Vi ser ungefär samma scenario för zink som för aluminium, dvs en långsamt förbättrande balans, där förbättringen tar en paus under det tredje kvartalet, men väntas komma tillbaka till den stadiga trenden mot slutet av året.
Om vi blickar framåt mot år 2015, kommer stängningen av gruvor, som varit känt länge, att minska utbudet ytterligare. Nedsidan i priset borde vara begränsad.
Från ett tekniskt perspektiv har vi identifierat 2250-nivån som viktig. Det tekniska stödet har testats och hållit. Liksom är fallet med aluminium, går det dock inte att utesluta ytterligare ett nedställ i priset och det gör att vi tror att intervallet som priset rör sig inom är 2200 dollar – 2350 dollar, de kommande veckorna.
Vi rekommenderar köp av ZINK S.
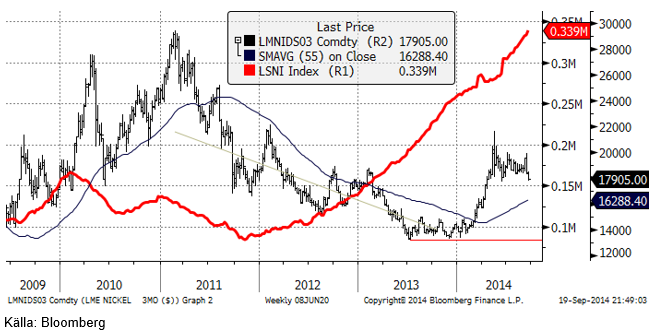
Nickel
Enligt den senaste statistiken från Metal Bulletin fortsätter produktionen av NPI (Nickel Pig Iron) nästan opåverkad av Indonesiens exportstopp av malm i början av året. Produktionen av NPI minskade med bara 400 ton från juni till juli, från 37,800 ton (nickelinnehåll) till 37,400 ton i juli. Givet utbudsbegränsningarna i år kom den här statistiken som en överraskning för de flesta. Det har rapporterats att kineserna använder filippinsk malm (med lägre nickelinnehåll) och blandar ut den rikare indonesiska malmen, som Kina lade upp ett stort lager av innan exportstoppet trädde i kraft. Metal Bulletin säger också att lagren av sådan indonesisk malm fortfarande är stora. Detta visar att den skepticism som marknaden på LME visar inför högre pris är befogad.
Tekniskt är 17,700 dollar ett viktigt stöd. Om det bryts är det negativt. Fundamentalt borde dock balanserna förbättras lite grand i taget, särskilt när vi närmar oss det säsongsmässigt starka fjärde kvartalet.
Guld
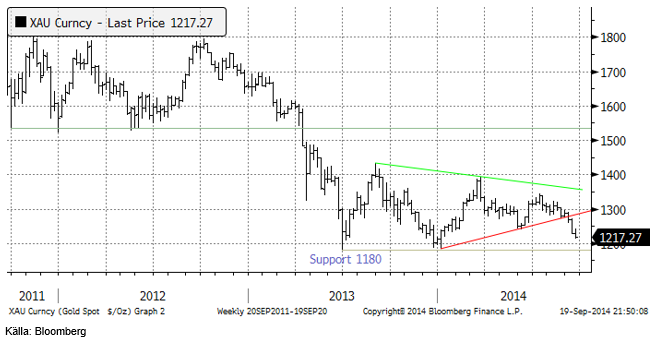
GFMS förutspådde i torsdags lägre efterfrågan på guld och att priset kommer att bottna först nästa år. Efterfrågan på fysiskt guld väntas minska med 2.4% på årsbasis under andra halvåret i år. Det innebär enligt GFMS att efterfrågan under 2014 hamnar på 4,174 ton, den lägsta nivån sedan 2010. Samtidigt säger de att ett prisfall ner mot 1200 dollar per uns kommer att väcka den priskänsliga efterfrågan i Asien och Mellanöstern till liv.
VD:n för World Gold Council, Aram Shishmanian, sade i torsdags att Kinas efterfrågan på guld kommer att stiga med 20% de kommande tre åren. Kina öppnar sin guldmarknad för utländska företag. WGC anser att med nya guldtradingcentra i Asien kommer likviditeten att förbättras och transaktionskostnaderna att sjunka, vilket leder till att fler investerar i guld.
GFMS tror också att centralbanker kommer att köpa 170 ton guld till sina valutareserver under det andra halvåret. ETF-investerare säljer. Samtidigt minskar utbudet från skrot med 17% till 533 ton under andra halvåret. Gruvproduktionen är ungefär oförändrad på 1621 ton för andra halvåret. Genomsnittliga cash costs minskade med 6% under det första halvåret och all-in-costs estimeras av GFMS till 1,350 dollar per uns. Det betyder att mer än hälften av gruvproduktionen går med förlust just nu när priset är lite drygt 1200 dollar.
Den ryska centralbanken ökade sitt innehav av guld från 35.5 moz till 35.8 moz. Det är alltså en ökning med 9.3 ton guld, rapporterade Reuters i fredags.
Tekniskt har guldpriset en bit ner till det tekniska stödet på 1180. Som vi skrev förra veckan är vi inte positivt inställda till att köpa guld i dollartermer.
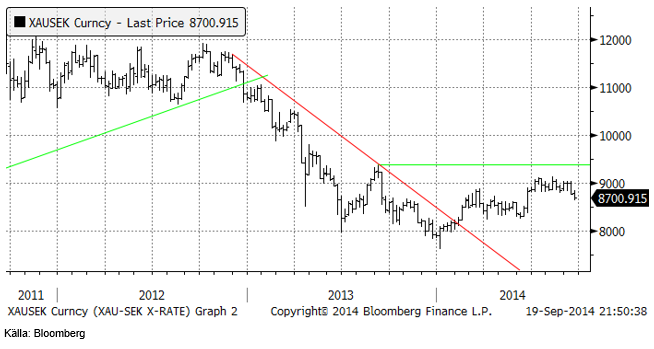
Chartet för guld i kronor (och i euro med för den delen) som jag förra veckan skrev att det närmast ser ut som en omvänd head-and-shouldersformation, alltså en positiv formation, ser ändå på kort sikt ut att kunna ge ytterligare lägre pris i veckan som kommer.
Det känns allt mindre positivt kring guld, och vi rekommenderar neutral position.
Silver
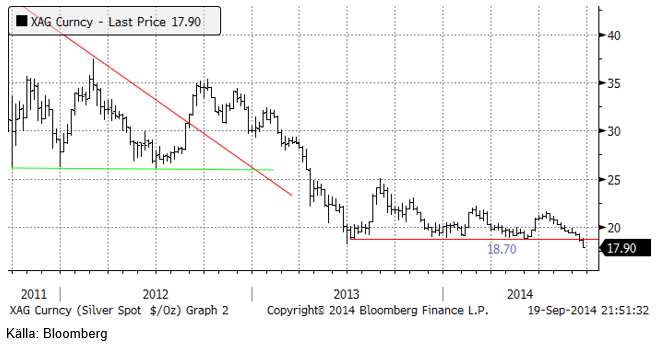
Silverpriset har brutit stödet på 18.70 och passerat 18.50, där vi skulle ta stoppen. Det ser så ”bearish” ut att man måste gå kort. På lite längre sikt kan silver vara intressant, men det är i så fall bäst att avvakta med köp.
Silver gynnas i ett lite längre perspektiv av att inte enbart vara en finansiell metall, utan också ha egenskaper som industrimetall. Enligt metallanalysföretaget CPM-Group kommer efterfrågan på silver att fortsätta öka från solpanelstillverkare. De väntar sig också att efterfrågan från silverbesticktillverkare och smycken ökar med 4.3%.
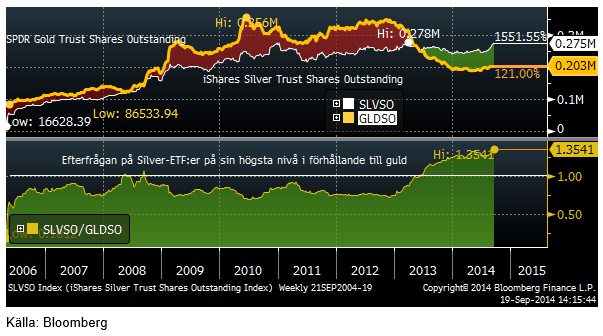
Investerare har sett mer positivt på silver än på guld en längre tid. Nedan ser vi ett exempel som illustrerar detta. Diagrammet visar hur många utestående andelar det finns i den ledande guldfonden och den ledande silverfonden, båda noterade på NYSE. Vi ser att intresset för silver drog ifrån guldet i samband med guldprisfallet under våren förra året. Trenden har fortsatt sedan dess.
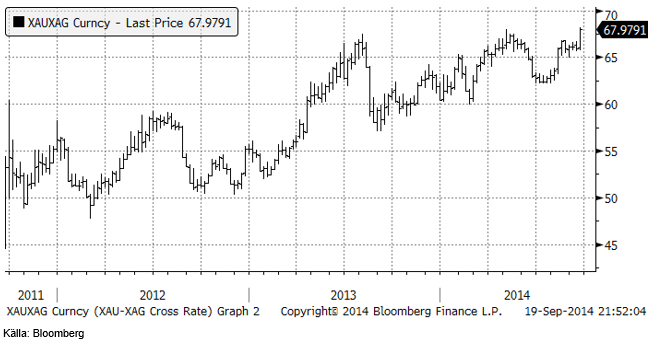
Silver är fortfarande ”billigt” i jämförelse med guld. Kvoten har legat på 66 gånger i flera veckor, men ökade efter fredagens kraftiga prisfall till nästan 68 gånger guldpriset.
Efter att vi tagit stop-loss vid 18.50 tycker vi att den tekniska bilden motiverar en kort position. Vill man ta en kort position kan man placera i t ex BEAR SILVER X4 S.
Platina & Palladium
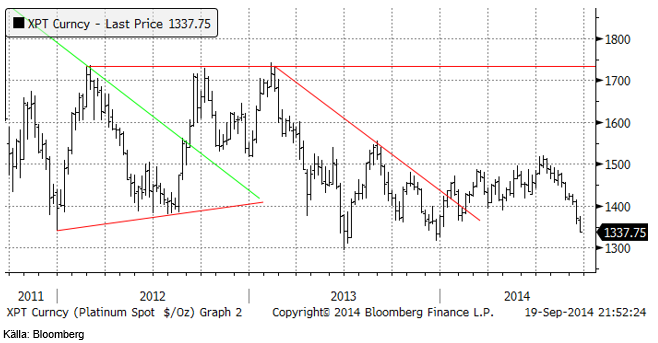
Platinapriset är snabbt på väg till den tekniska stödnivån på 1300 som jag skrev om förra veckan. Prisfallet bör hejdas där, men det betyder inte att det är ett köptillfälle.
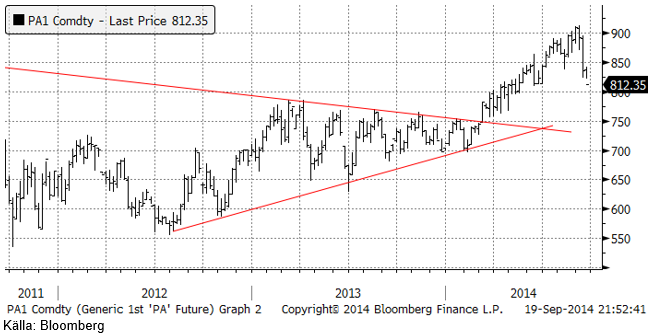
Palladium föll kraftigt ner till 812.35 i frontmånadskontraktet när veckan stängde. Tekniskt stöd finns strax under 800 dollar och till skillnad från platina, silver och guld, säger den tekniska analysen att detta kan vara ett köptillfälle. Man ser ofta en rekyl tillbaka till utbrottnsnivån efter att priset brutit en triangelformation och det är ett mönster som stämmer ganska väl med palladium. Marknaden bröt en triangelformation vid 750 dollar i våras. De senaste veckornas prisnedgång kan ses som en något försenad rekyl tillbaka mot utbrottsnivån och från dagens kurs på 812 dollar är det inte långt ner till stödet.
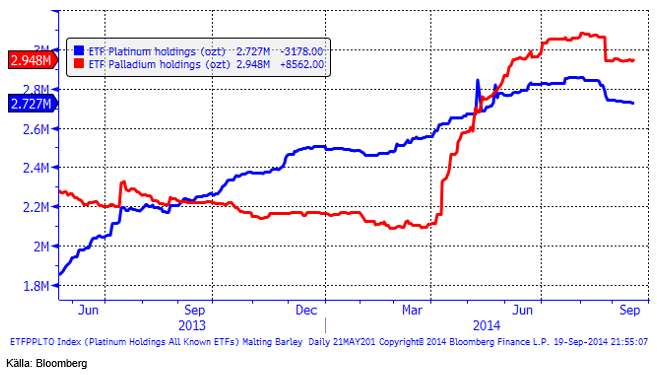
Nedanför ser vi hur mycket metall som finns i börshandlade fonder för platina respektive palladium. Det har fortsatt att vara små utflöden i båda metallerna.
Förra veckan skrev vi att ”vi fortsätter med neutral vy på platina men rekommenderar en köpt position i palladium, helst om man kan köpa på en rekyl nära 800 dollar”. Vi håller fast vid det.
Ris
Priset på ris ligger kvar strax över det tekniska stödet på 12.44 dollar. Med de stora prisfall som varit i substitutet vete, skulle det inte förvåna om de senaste veckornas lugnare marknad är en konsolidering inför ytterligare ett prisfall i ris. Jag tycker man ska bevaka rismarknaden och vara beredd att köpa BEAR RIS X4 S om 12.44 eller 12.40 (helst) bryts. Nästa stöd finns ju som vi ser nere på 10 dollar.
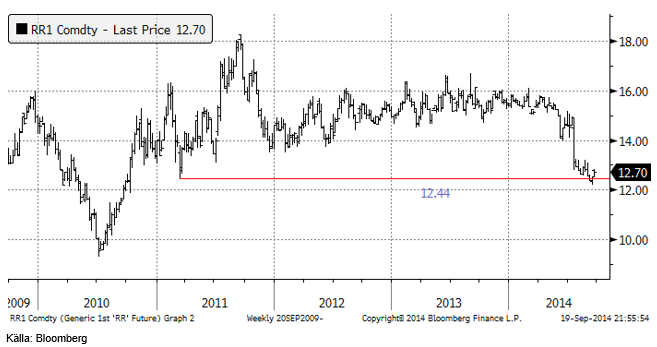
Vi fortsätter med neutral rekommendation, men förbereder oss för att gå kort.
Kaffe
Regn över Minas Gerais gav prisfall på kaffet och regnet fortsätter, som vi såg av väderleksprognosen för Brasilien ovan. Det finns många analyser som haussar kaffe, men vi hör inte till dem. Tekniskt ser priset ut att vara på väg ner mot det tekniska stödet på 171.10 cent. Det bröts i och för sig i juli, så priset kan gå ännu lägre i det korta perspektivet, kanske ända till drygt 160 cent.
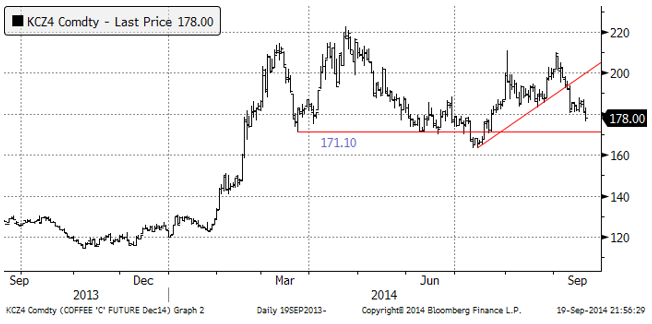
Vi rekommenderar neutral position i kaffe.
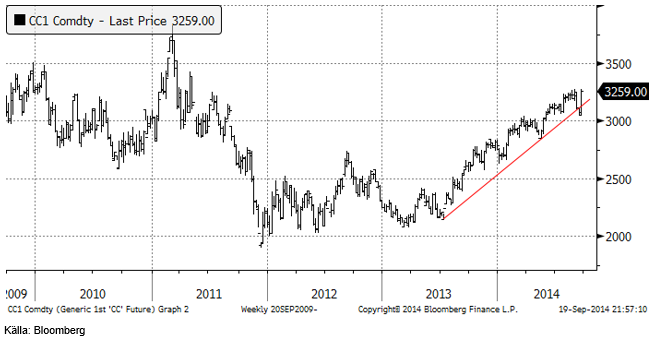
Kakao
Allt hade varit frid och fröjd med en kort position i kakao om det inte kom rapporter om att Ebola-smittan kan drabba Elfenbenskusten och Ghana, de två viktigaste producenterna av kakao i världen. Hittills finns inga rapporterade fall av Ebola från dessa länder, men det kan finnas ”inofficiella fall”. Både Ghana och Elfenbenskusten exporterar kakao i större volymer än vad marknadsbedömare räknat med. Om Ebola-smittan kan begränsas eller inte når Elfenbenskusten eller Ghana, finns nog stor fallhöjd i priset på kakao.
Men det kanske är klokt att gå ur en kort position nu och invänta vad som händer.
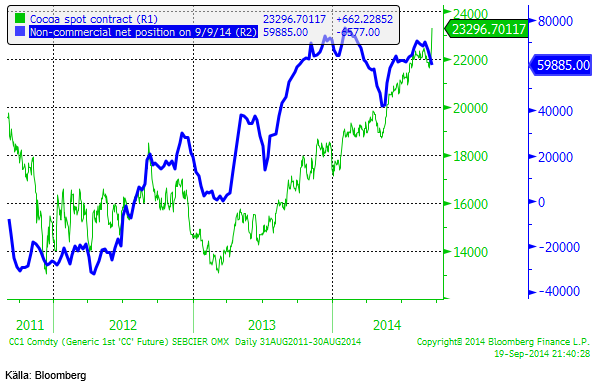
Spekulativ position sjönk ytterligare något. Det är dock viktigt att notera att detta visar hur det såg ut i tisdags förra veckan och nyheten om Ebola-smittan kom efter det. Anekdotvis har vi förstått att det främst är spekulanter som köpt, vilket i så fall visar sig i nästa veckas COT-rapport från CFTC. Priset vi ser i diagrammets gröna linje är kakaopriset på LIFFE (i GBP per ton).
[box]SEB Veckobrev Veckans råvarukommentar är producerat av SEB Merchant Banking och publiceras i samarbete och med tillstånd på Råvarumarknaden.se[/box]
Disclaimer
The information in this document has been compiled by SEB Merchant Banking, a division within Skandinaviska Enskilda Banken AB (publ) (“SEB”).
Opinions contained in this report represent the bank’s present opinion only and are subject to change without notice. All information contained in this report has been compiled in good faith from sources believed to be reliable. However, no representation or warranty, expressed or implied, is made with respect to the completeness or accuracy of its contents and the information is not to be relied upon as authoritative. Anyone considering taking actions based upon the content of this document is urged to base his or her investment decisions upon such investigations as he or she deems necessary. This document is being provided as information only, and no specific actions are being solicited as a result of it; to the extent permitted by law, no liability whatsoever is accepted for any direct or consequential loss arising from use of this document or its contents.
About SEB
SEB is a public company incorporated in Stockholm, Sweden, with limited liability. It is a participant at major Nordic and other European Regulated Markets and Multilateral Trading Facilities (as well as some non-European equivalent markets) for trading in financial instruments, such as markets operated by NASDAQ OMX, NYSE Euronext, London Stock Exchange, Deutsche Börse, Swiss Exchanges, Turquoise and Chi-X. SEB is authorized and regulated by Finansinspektionen in Sweden; it is authorized and subject to limited regulation by the Financial Services Authority for the conduct of designated investment business in the UK, and is subject to the provisions of relevant regulators in all other jurisdictions where SEB conducts operations. SEB Merchant Banking. All rights reserved.

The latest weekly report from the US DOE showed a substantial drawdown across key petroleum categories, adding more upside potential to the fundamental picture.

Commercial crude inventories (excl. SPR) fell by 5.8 million barrels, bringing total inventories down to 415.1 million barrels. Now sitting 11% below the five-year seasonal norm and placed in the lowest 2015-2022 range (see picture below).
Product inventories also tightened further last week. Gasoline inventories declined by 2.1 million barrels, with reductions seen in both finished gasoline and blending components. Current gasoline levels are about 3% below the five-year average for this time of year.
Among products, the most notable move came in diesel, where inventories dropped by almost 4.1 million barrels, deepening the deficit to around 20% below seasonal norms – continuing to underscore the persistent supply tightness in diesel markets.
The only area of inventory growth was in propane/propylene, which posted a significant 5.1-million-barrel build and now stands 9% above the five-year average.
Total commercial petroleum inventories (crude plus refined products) declined by 4.2 million barrels on the week, reinforcing the overall tightening of US crude and products.


A classic case of “buy the rumor, sell the news” played out in oil markets, as Brent crude has dropped sharply – down nearly USD 10 per barrel since yesterday evening – following Iran’s retaliatory strike on a U.S. air base in Qatar. The immediate reaction was: “That was it?” The strike followed a carefully calibrated, non-escalatory playbook, avoiding direct threats to energy infrastructure or disruption of shipping through the Strait of Hormuz – thus calming worst-case fears.
After Monday morning’s sharp spike to USD 81.4 per barrel, triggered by the U.S. bombing of Iranian nuclear facilities, oil prices drifted sideways in anticipation of a potential Iranian response. That response came with advance warning and caused limited physical damage. Early this morning, both the U.S. President and Iranian state media announced a ceasefire, effectively placing a lid on the immediate conflict risk – at least for now.
As a result, Brent crude has now fallen by a total of USD 12 from Monday’s peak, currently trading around USD 69 per barrel.
Looking beyond geopolitics, the market will now shift its focus to the upcoming OPEC+ meeting in early July. Saudi Arabia’s decision to increase output earlier this year – despite falling prices – has drawn renewed attention considering recent developments. Some suggest this was a response to U.S. pressure to offset potential Iranian supply losses.
However, consensus is that the move was driven more by internal OPEC+ dynamics. After years of curbing production to support prices, Riyadh had grown frustrated with quota-busting by several members (notably Kazakhstan). With Saudi Arabia cutting up to 2 million barrels per day – roughly 2% of global supply – returns were diminishing, and the risk of losing market share was rising. The production increase is widely seen as an effort to reassert leadership and restore discipline within the group.
That said, the FT recently stated that, the Saudis remain wary of past missteps. In 2018, Riyadh ramped up output at Trump’s request ahead of Iran sanctions, only to see prices collapse when the U.S. granted broad waivers – triggering oversupply. Officials have reportedly made it clear they don’t intend to repeat that mistake.
The recent visit by President Trump to Saudi Arabia, which included agreements on AI, defense, and nuclear cooperation, suggests a broader strategic alignment. This has fueled speculation about a quiet “pump-for-politics” deal behind recent production moves.
Looking ahead, oil prices have now retraced the entire rally sparked by the June 13 Israel–Iran escalation. This retreat provides more political and policy space for both the U.S. and Saudi Arabia. Specifically, it makes it easier for Riyadh to scale back its three recent production hikes of 411,000 barrels each, potentially returning to more moderate increases of 137,000 barrels for August and September.
In short: with no major loss of Iranian supply to the market, OPEC+ – led by Saudi Arabia – no longer needs to compensate for a disruption that hasn’t materialized, especially not to please the U.S. at the cost of its own market strategy. As the Saudis themselves have signaled, they are unlikely to repeat previous mistakes.
Conclusion: With Brent now in the high USD 60s, buying oil looks fundamentally justified. The geopolitical premium has deflated, but tensions between Israel and Iran remain unresolved – and the risk of missteps and renewed escalation still lingers. In fact, even this morning, reports have emerged of renewed missile fire despite the declared “truce.” The path forward may be calmer – but it is far from stable.
Analys
A muted price reaction. Market looks relaxed, but it is still on edge waiting for what Iran will do
Brent crossed the 80-line this morning but quickly fell back assigning limited probability for Iran choosing to close the Strait of Hormuz. Brent traded in a range of USD 70.56 – 79.04/b last week as the market fluctuated between ”Iran wants a deal” and ”US is about to attack Iran”. At the end of the week though, Donald Trump managed to convince markets (and probably also Iran) that he would make a decision within two weeks. I.e. no imminent attack. Previously when when he has talked about ”making a decision within two weeks” he has often ended up doing nothing in the end. The oil market relaxed as a result and the week ended at USD 77.01/b which is just USD 6/b above the year to date average of USD 71/b.

Brent jumped to USD 81.4/b this morning, the highest since mid-January, but then quickly fell back to a current price of USD 78.2/b which is only up 1.5% versus the close on Friday. As such the market is pricing a fairly low probability that Iran will actually close the Strait of Hormuz. Probably because it will hurt Iranian oil exports as well as the global oil market.
It was however all smoke and mirrors. Deception. The US attacked Iran on Saturday. The attack involved 125 warplanes, submarines and surface warships and 14 bunker buster bombs were dropped on Iranian nuclear sites including Fordow, Natanz and Isfahan. In response the Iranian Parliament voted in support of closing the Strait of Hormuz where some 17 mb of crude and products is transported to the global market every day plus significant volumes of LNG. This is however merely an advise to the Supreme leader Ayatollah Ali Khamenei and the Supreme National Security Council which sits with the final and actual decision.
No supply of oil is lost yet. It is about the risk of Iran closing the Strait of Hormuz or not. So far not a single drop of oil supply has been lost to the global market. The price at the moment is all about the assessed risk of loss of supply. Will Iran choose to choke of the Strait of Hormuz or not? That is the big question. It would be painful for US consumers, for Donald Trump’s voter base, for the global economy but also for Iran and its population which relies on oil exports and income from selling oil out of that Strait as well. As such it is not a no-brainer choice for Iran to close the Strait for oil exports. And looking at the il price this morning it is clear that the oil market doesn’t assign a very high probability of it happening. It is however probably well within the capability of Iran to close the Strait off with rockets, mines, air-drones and possibly sea-drones. Just look at how Ukraine has been able to control and damage the Russian Black Sea fleet.
What to do about the highly enriched uranium which has gone missing? While the US and Israel can celebrate their destruction of Iranian nuclear facilities they are also scratching their heads over what to do with the lost Iranian nuclear material. Iran had 408 kg of highly enriched uranium (IAEA). Almost weapons grade. Enough for some 10 nuclear warheads. It seems to have been transported out of Fordow before the attack this weekend.
The market is still on edge. USD 80-something/b seems sensible while we wait. The oil market reaction to this weekend’s events is very muted so far. The market is still on edge awaiting what Iran will do. Because Iran will do something. But what and when? An oil price of 80-something seems like a sensible level until something do happen.


Nickelmarknaden under fortsatt press – överskott väntas bestå till 2026

Westinghouse planerar tio nya stora kärnreaktorer i USA – byggstart senast 2030

Eurobattery Minerals förvärvar majoritet i spansk volframgruva

USA ska införa 50 procent tull på koppar

Ryska staten siktar på att konfiskera en av landets största guldproducenter

Mahvie Minerals växlar spår – satsar fullt ut på guld
A muted price reaction. Market looks relaxed, but it is still on edge waiting for what Iran will do

Jonas Lindvall är tillbaka med ett nytt oljebolag, Perthro, som ska börsnoteras

Oljan, guldet och marknadens oroande tystnad

Domstolen ger klartecken till Lappland Guldprospektering
-
 Nyheter4 veckor sedan
Mahvie Minerals växlar spår – satsar fullt ut på guld
-
Analys4 veckor sedan
A muted price reaction. Market looks relaxed, but it is still on edge waiting for what Iran will do
-
 Nyheter3 veckor sedan
Jonas Lindvall är tillbaka med ett nytt oljebolag, Perthro, som ska börsnoteras
-
 Nyheter3 veckor sedan
Oljan, guldet och marknadens oroande tystnad
-
 Nyheter3 veckor sedan
Domstolen ger klartecken till Lappland Guldprospektering
-
Analys3 veckor sedan
Tightening fundamentals – bullish inventories from DOE
-
 Nyheter2 veckor sedan
Ryska staten siktar på att konfiskera en av landets största guldproducenter
-
 Nyheter2 veckor sedan
Lundin Mining ska bli en av de tio största kopparproducenterna i världen