

Analys
SEB – Råvarukommentarer, 20 maj 2013

Rekommendationer
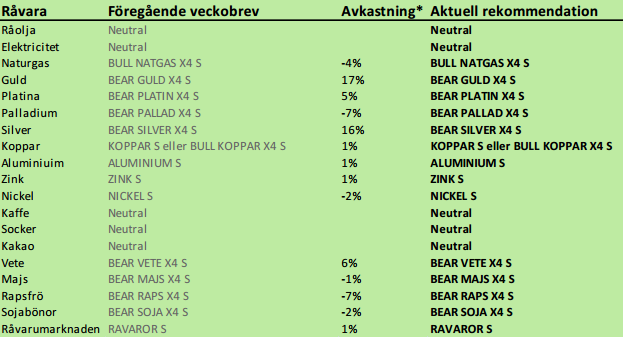
*) Avkastningen avser 1:1 råvarucertifikat där de ingår i rekommendationen. I den aktuella tabellen ovan har jag tagit prisförändringen den senaste veckan sedan det förra veckobrevet publicerades.
Inledning
Råvarumarknaden har fortsatt att vara svag i veckan som gick. WASDE-rapporten börjar sjunka in hos “ags” marknaden. Sådden av majs väntas ha tagit ett rekordstort kliv framåt, vilket kommer att visa sig på måndagskvällen, när USDA publicerar siffrorna. Guldmarknaden följer ett klassist mönster för en kraschande marknad. Jag tror inte att prisfallet är över än.
Råolja – Brent
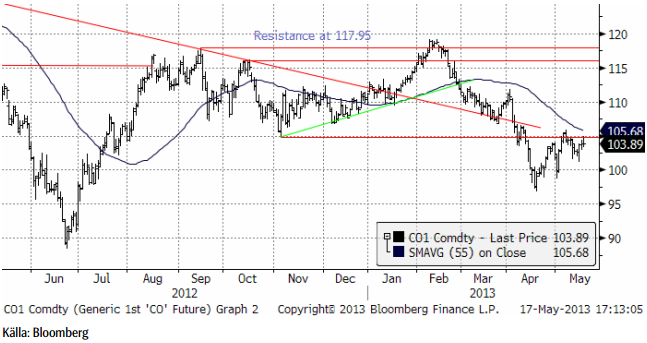
Oljan var upp vid tidigare stödet (nu motståndet) vid 105 dollar. Priset orkade inte igenom och då brukar prisfall följa. Stöd finns vid 100 dollar, men trenden är nedåtriktad i det korta perspektivet. I det långa perspektivet saknas trend för råoljan.
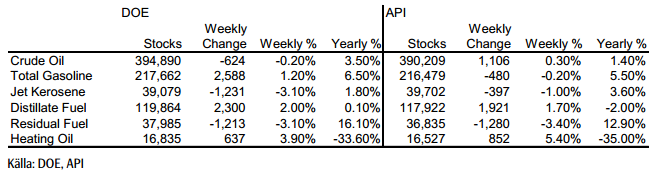
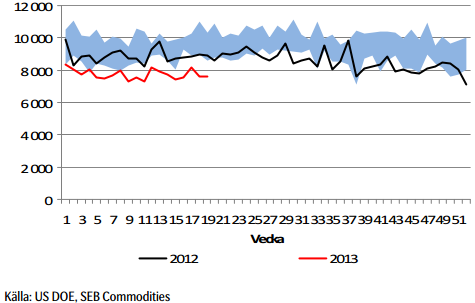
Lagren och lagerförändringarna i USA den senaste rapportveckan (som slutade den 10 maj) ser vi nedan, enligt Department of Energy och American Petroleum Institute.
Nedan ser vi amerikanska råoljelager enligt DOE i tusen fat. Den svarta kurvan är 2012 års lagernivåer vecka för vecka och den lilla röda linjen är 2013 års nivå.
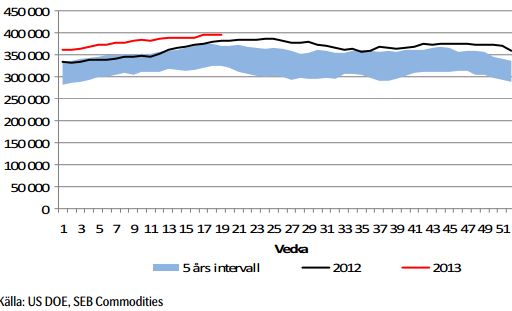
Importen fortsätter att hålla sig under förra årets nivå. Veckans notering var nästan oförändrad från veckan innan.
Vi fortsätter att ligga neutralt för att förhoppningsvis kunna komma in billigare i OLJA S om priset går ner till 100 dollar eller lägre igen.
Elektricitet
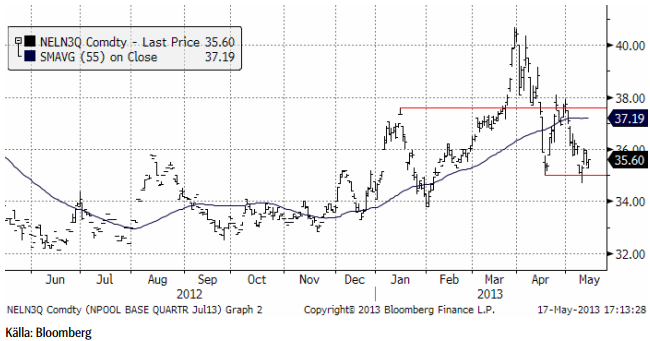
Terminen gick i veckan upp och ”stängde gapet”, det hopp nedåt i priserna som inträffade för en dryg vecka sedan. När sådant är avklarat brukar prisfallet fortsätta i den ursprungliga riktningen, i det här fallet alltså nedåt.
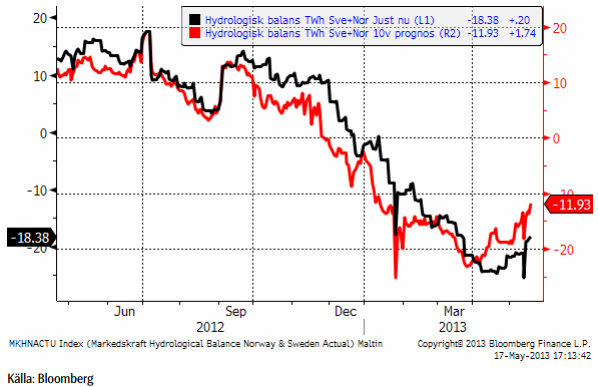
Hydrologisk balans har fortsatt att stiga.
Eftersom priset trots allt kommit ner ganska långt, väljer vi att fortsätta med neutral position.
Naturgas
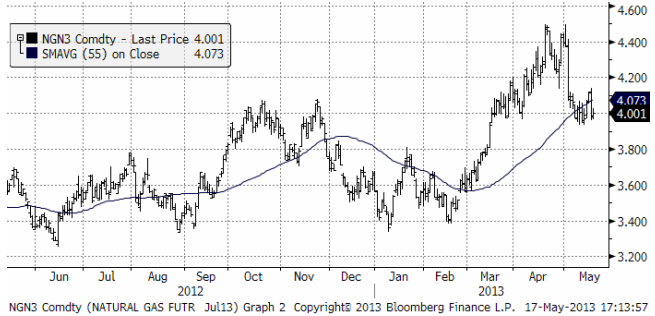
Tekniskt är läget osäkert, mitt emellan den övre delen och den undre delen av den senaste tidens kursintervall. Vi väljer att gå över till neutral position.
Guld & Silver
Guldpriset följer ett välkänt mönster för en kraschande marknad. Först ett kraftigt fall (i april), fyndköpare, och så säljläge igen och ett nytt prisfall som börjar lite försiktigt och sedan blir allt mer panikartat. Vi är nu nästan framme vid den punkt då paniken ska börja gripa de som har för mycket guld i sina portföljer. Sannolikheten är väldigt stor att det initiala prisfallets botten i april på 1322 dollar / ozt ska nås. Om paniken infinner sig i veckan kan prisfallet bli ännu större.
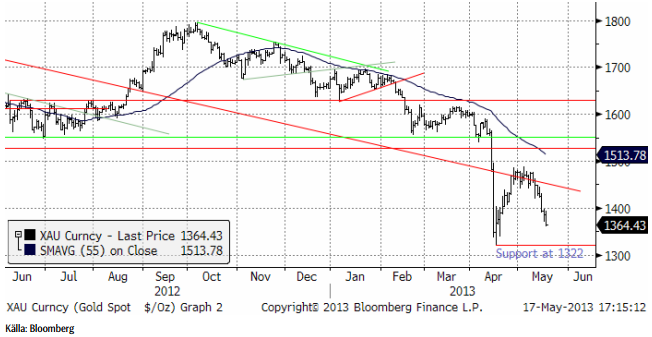
17 analytiker som tillfrågats av Bloomberg tror att priset faller i veckan som kommer. Endast 8 tror att priset stiger.
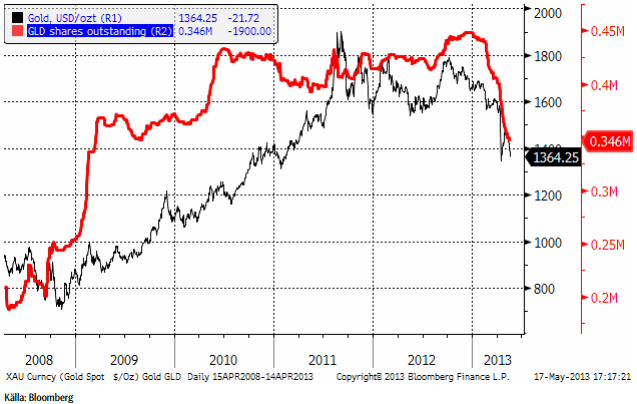
April månads fyndköpare av mynt som gjorde att the US Mint, med flera nådde försäljningsrekord, har tömt ut sina resurser. Maj ser ut att endast nå 65% av april månads försäljning enligt the US Mint. Samtidigt fortsätter ETP-innehavare dumpa sina innehav. Nedan ser vi guldpriset och antal utestående GLD-depåbevis (röd kurva).
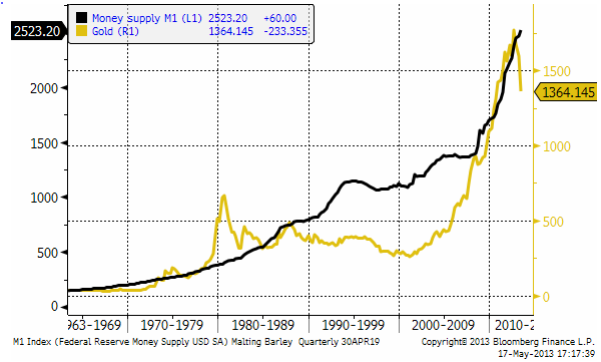
Vad som kan ha utlöst försäljningarna var ”hacket” i kurvan på penningmängden i USA. Samtidigt började FED tala om ett slut på QE. Men som vi ser i grafen nedan, har M1 fortsatt att öka i USA. Man fick kalla fötter hos FED och fortsatte trycka pengar. Det gör att det byggs upp ett latent stöd för guldpriset, bara kursfallet tar slut.
Nedan ser vi kursdiagrammet för silver i dollar per troy ounce. Stödet på 22 dollar håller än så länge. Bryts den nivån finns inget förrän vid 20 dollar, 10% längre ner.
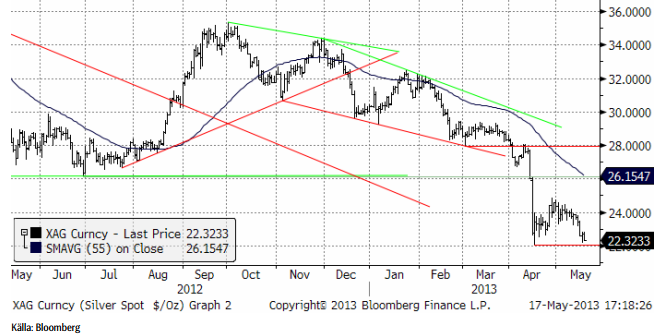
Jag tror att silverpriset kan gå lite lägre från dagens nivå, ner mot 22 eller 20 dollar.
Vi ligger korta guld och silver. Jag tror att det kommer en till vända ner och ligger självklart kvar med köpt position i BEAR GULD X4 S och BEAR SILVER X4 S.
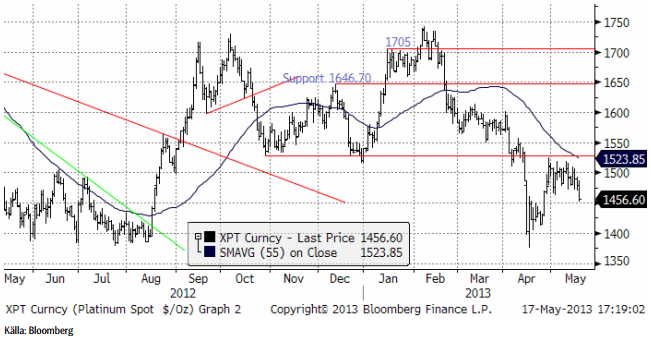
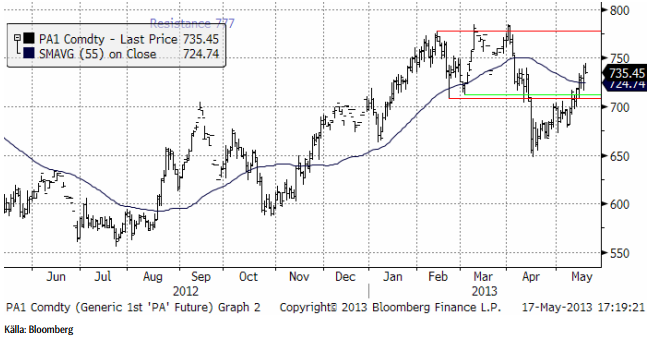
Platina & Palladium
Platinapriset föll i fredags ner till den övre delen av konsolideringen efter prisfallet i april, till 1450. Det är en nivå där det kan finnas tillräckligt stöd för att hejda prisfallet, men dynamiken är ändå på nedsidan.
Palladium fortsätter att sega sig upp från förra veckans 710 dollar till 735 dollar. 750 dollar är en nivå där många nog tycker att det är allt för frestande för att inte sälja.
Vi ligger kvar såld både platina och palladium, dvs med BEAR PLATNA X4 S och BEAR PALLAD X4 S.
Basmetaller
Den internationella konjunkturen står och tvekar, och så även de industriella råvarorna. Råvarumarknaderna har under våren präglats av frågetecken kring Kina, där ekonomin inte riktigt tar den fart som väntats under de säsongsmässigt starka 2:a kvartalet. Den andra stora råvarukonsumenten, USA visar positiva tecken, men även där har tveksamhet kring konjunkturen smugit sig på marknaden. Veckans statistikskörd spädde på osäkerheten: 1. antalet personer med arbetslöshetsunderstöd steg rejält, 2. husmarknaden var svagare än väntat, 3. inflationstrycket (KPI) är svagt och 4. industriaktiviteten tvekar (Philly Fed). Samtidigt har marknaden svårt för fotnedsättning: ska Fed påbörja exitpolitiken under hösten och fasa ut värdepappersköpen på $ 85 mdr/mån? Flera Fedtal tolkas som att exitplaner övervägs – vilket ger dollarstöd, en faktor som verkar hämmande på de dollarnoterade råvarorna. Våra makroekonomer räknar dock med att Fed fortsätter året ut.
Basmetallerna låg i startgroparna för en uppgång inför veckan. Men riskaptiten infann sig inte. Kortsiktiga aktörer som positionerat sig för uppgång fick kalla fötter och sålde istället. Veckan slutar med en nedgång på 1-2 % för de stora metallerna. Nickel sticker ut med ett prisfall på 4 %.
Koppar
Som vi skrivit tidigare har vi haft kopparn under bevakning för att gå från neutral till köp. Tekniskt sett bedömde vi förutsättningarna som goda för en kortsiktig uppgång. Trots veckans tillbakagång (1,4 %), ser vi tecken på att det negativa stämningsläget kring koppar håller på att svänga om.
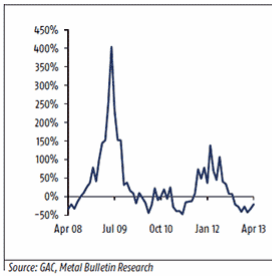
I förra veckan redovisade vi Kinas kopparimport som kom in fortsatt svagt i april. I nedanstående diagram ser vi förändringen på årsbasis. Den negativa förändringen avtar och enligt det cykliska mönstret förväntar vi oss en positiv utveckling under de närmsta månaderna.
Procentuell förändring av kopparimporten (årsbasis)
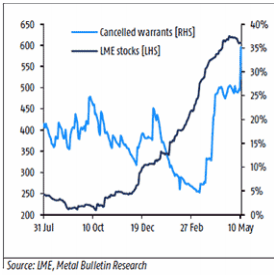
Ett annat tecken är förändringen av LME-lagret. Vi ser både lagerminskningar och en ökning av ”cancelled warrants”. Det senare är statistik på mängden material som är på väg att plockas ur lager. Uttagen sker i Sydkorea och tyder på ökad efterfrågan – sannolikt med destination Kina. Detta stämmer överens med den förväntade ökningen av importen till Kina. Kineserna brukar utnyttja prisskillnaden mellan LME och Shanghai, som nu efter prisnedgången är till LME:s fördel.
Tekniskt sett fokuserar vi på ”dubbelbotten” från april och maj, som ger en potentiell uppgång till $7620, där motståndet sätter in. Nästa nivå är $7800. Den omedelbara pressen på koppar verkar vara över och den nedåtgående trenden är bruten. Den generella trenden får betraktas som mer sidledes för koppar.
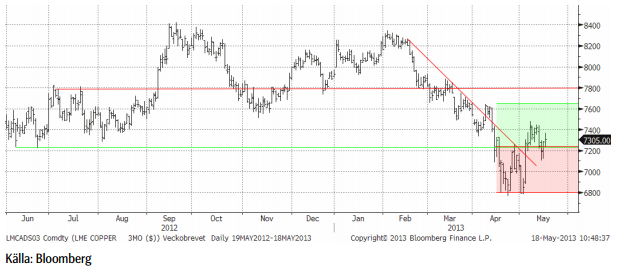
Vi förväntar oss fortsatt hög volatilitet. Vår kortsiktiga bedömning talar för uppsidan och vi rekommenderar därför köp av BULL KOPPAR X2 S eller X4 S.
Aluminium
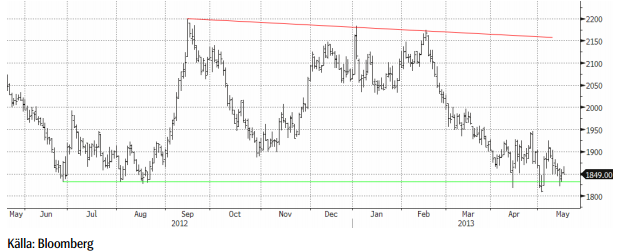
Priset har nu ”testat” stödnivåerna vid $1810-20 vid tre tillfällen, och lyckats studsa upp. Det är ett styrketecken. Vi ser fysiska aktörer som går in och täcker in framtida konsumtion via terminsköp vid varje dipp. Tekniskt orienterade fonder säljer vid varje uppställ. Trenden blir därefter, det rör sig sidledes. Vi ser tecken på att marknaden håller på att bottna ur. Högkostnadsproducenterna, framför allt i Kina, förväntas minska utbudet (ännu mer) om priset långvarigt stannar på nuvarande nivåer.
Långsiktigt är nivån väldigt intressant för kontraktet Aluminium S (utan hävstång).
Zink
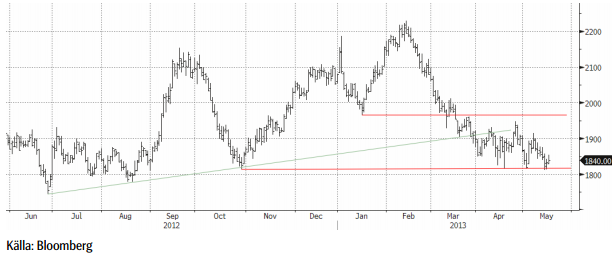
Situationen för zink påminner om den för aluminium, både fundamentalt och tekniskt. Vi bedömer zinken som ”billig” ur ett kostnadsperspektiv och nuvarande nivåer är mycket intressanta på lite längre sikt (6-12 månader). I det perspektivet är Zink S (utan hävstång) att föredra.
Nickel
Nickel uppvisade förnyad svaghet i veckan och faller med 4 %. Trots väldigt goda efterfrågeutsikter på sikt, där den rostfria- och specialstålproduktionen förväntas öka med fortsatt utbyggnad av olje- och gasproduktion och specialstål till flygindustrin, ”lider” nickelmarknaden av ett överskott. Produktionstekniken av s.k. Nickel Pig Iron i Kina har utvecklats med s.k. Rotary Kiln Electric Furnaces (RKEF) teknik, vilken i genomsnitt sänker hela kostnadskurvan. Samtidigt får högkostnadsproducenterna i gruvledet problem på nuvarande nivåer. Vi har tidigare rapporterat om produktionsneddragningar i Australien, och det förväntas komma mer.
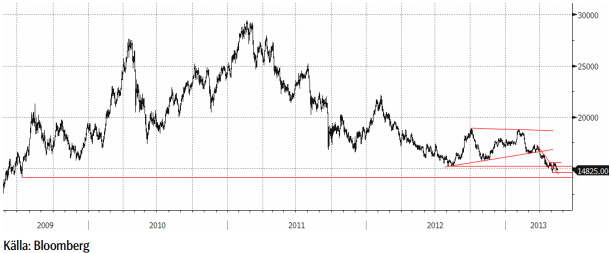
Effekten av RKEF-tekniken riskerar att flytta ner nivån där utbudsminskningarna verkligen får effekt. Priset har brutit viktiga stödnivåer, och vi får gå tillbaka till juli 2009 för att hitta lägre priser. I det perspektivet kommer nästa stora stödnivå in kring $14000. Vi är inte så långt därifrån och vi bedömer nivåerna från dagens pris kring $14800 ned mot nivån som väldigt attraktiva på 6-12 månaders sikt. I det perspektivet är Nickel S (utan hävstång) att föredra.
Nickel 2009-2013
Nickel på kort sikt
För veckan, och ur ett tekniskt perspektiv, gäller det att nivån från i början av månaden $14600 håller, för att undvika en test av lägre nivåer. Det finansiella kollektivet är väldigt ”korta” och frågan är hur mycket mer kraft det finns för att pressa priset ytterligare. Det byggs upp ett stort behov av att köpa tillbaka kortpositioner, vilket i sig kan skapa kraftiga rekyler på uppsidan.
Kaffe
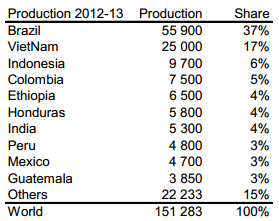
Årets skörd i år i Brasilien är en mellanårsskörd för arabica. Conab i Brasilien publicerade en rapport den 14 maj på 48.59 miljoner säckar (à 60 kg). Enligt Conabs statistikserie blir det den största skörden någonsin för Brasilien. Om man jämför med det amerikanska jordbruksdepartementets tidsserie är skörden något lägre än 2011/12.
Nedan ser vi Brasiliens produktion i 1000 säckar. Den sista noteringen, för 2013/14, är hämtad från Conabs prognos. Resten är USDA:s data.
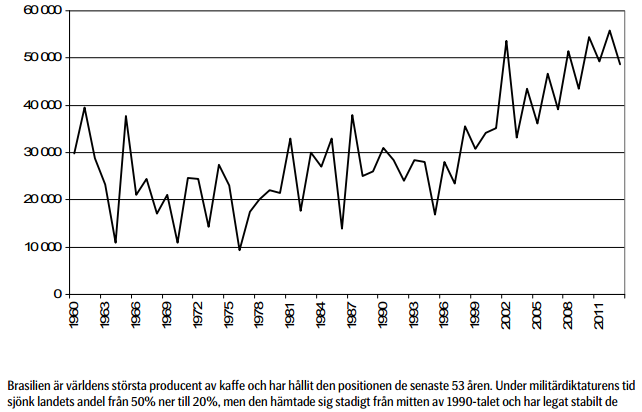
Brasilien är världens största producent av kaffe och har hållit den positionen de senaste 53 åren. Under militärdiktaturens tidsjönk landets andel från 50% ner till 20%, men den hämtade sig stadigt från mitten av 1990-talet och har legat stabilt de senaste 13 åren. Vietnam producerar uteslutande den sämre kaffesorten robusta. Den odlas också i delstaten Espirito-Santo i nordöstra Brasilien. Just den delen av Brasilien har varit ovanligt torrt, vilket kan ge lite mindre skörd av robusta.
The International Coffee Organisation har nyligen publicerat en rapport om kaffeblads rosten (roya). De väntar sig att den ska ha långvarig negativ effekt på produktionen. Däri ligger kanske fröet för nästa uppgång, men just nu är trenden nedåt. Marknadens försök att handla upp priset misslyckades.
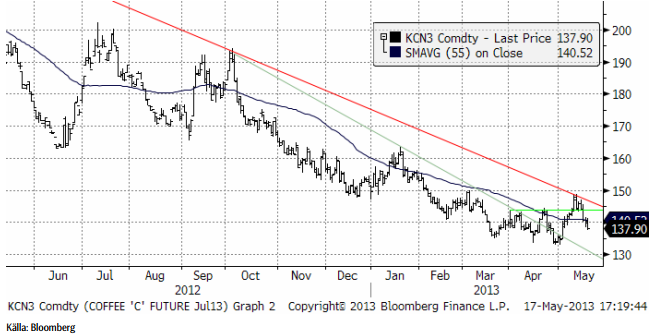
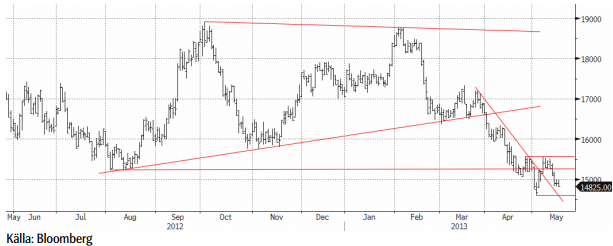
Sedan mars månad har däremot inte priset fallit som tidigare. Vi har först sett lägre bottnar, men uppgångarna har varit lika högre som föregående eller högre. Kanske håller något på att hända i kaffemarknaden.
Vi tror man kan försöka sig på att köpa kaffe för lite längre sikt, t ex KAFFE S. En stopp-loss på 132 (basis juli-kontraktet) bör man dock ha.
Socker
Marknadsföringsårets 2013/14 skörd av sockerrör har börjat i Centro-Sud i Brasilien. Hittills i maj har vädret varit gynnsamt för skördearbetet. Cepea rapporterar att köpare är avvaktande, eftersom det finns en förväntan om lägre priser när ”crushen” kommit längre.
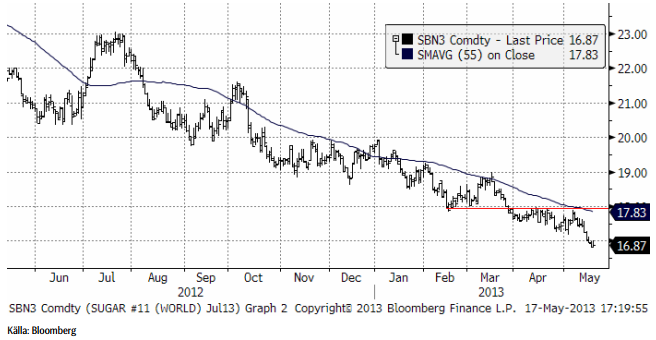
Vi fortsätter med neutral rekommendation.
[box]SEB Veckobrev Veckans råvarukommentar är producerat av SEB Merchant Banking och publiceras i samarbete och med tillstånd på Råvarumarknaden.se[/box]
Disclaimer
The information in this document has been compiled by SEB Merchant Banking, a division within Skandinaviska Enskilda Banken AB (publ) (“SEB”).
Opinions contained in this report represent the bank’s present opinion only and are subject to change without notice. All information contained in this report has been compiled in good faith from sources believed to be reliable. However, no representation or warranty, expressed or implied, is made with respect to the completeness or accuracy of its contents and the information is not to be relied upon as authoritative. Anyone considering taking actions based upon the content of this document is urged to base his or her investment decisions upon such investigations as he or she deems necessary. This document is being provided as information only, and no specific actions are being solicited as a result of it; to the extent permitted by law, no liability whatsoever is accepted for any direct or consequential loss arising from use of this document or its contents.
About SEB
SEB is a public company incorporated in Stockholm, Sweden, with limited liability. It is a participant at major Nordic and other European Regulated Markets and Multilateral Trading Facilities (as well as some non-European equivalent markets) for trading in financial instruments, such as markets operated by NASDAQ OMX, NYSE Euronext, London Stock Exchange, Deutsche Börse, Swiss Exchanges, Turquoise and Chi-X. SEB is authorized and regulated by Finansinspektionen in Sweden; it is authorized and subject to limited regulation by the Financial Services Authority for the conduct of designated investment business in the UK, and is subject to the provisions of relevant regulators in all other jurisdictions where SEB conducts operations. SEB Merchant Banking. All rights reserved.

Brent M1 moving below the 200 dma of $78.7/b. Brent crude continued its move lower yesterday with a decline of 3.3% to $77.9/b. This morning it is adding another drop of 1.4% to $76.8/b. Israel bombing Lebanon during the weekend was a violence of the MoU and Iran was quick to declare the SoH closed again. But the willingness to move forward by both the US and Iran obviously trumped the bombing in Lebanon making the event more of a hiccup on the road of further negotiations.

The US has now waived sanctions against Iranian oil exports for two months allowing Iran to sell its oil all over the world, though sanctions instated in Europe will take more time to unwind. Oil from Iran, Russia as well as Venezuela can for the time being be sold across the world without any sharp discount due to sanctions. Chinese Tea-pot refineries will suffer as they previously could buy rebated crude while selling products at market prices.
Crude oil is no flowing out of the SoH with latest number close to 7 mb/d on a three day moving average. That is still well below the 14 mb/d of crude and 6 mb/d of products normally flowing out of the SoH. Latest estimate is that there is around 80 mb of crude on water inside the Persian Gulf and maybe another 80 mb of oil products on water as well. If crude is exiting the SoH at a rate of around 7 mb/d, then the 80 mb of crude would be depleted within 10-15 days and there after the flow would rely on new crude tankers entering, loading and then exiting the SoH to continue further flows. Given the uncertainties surrounding the status of the SoH with Iran stating that it was closed again as recent as this weekend, there is likely an asymmetry here where ships and oil stranded in the SoH for months are much more eager to exit than new ships are eager to enter.
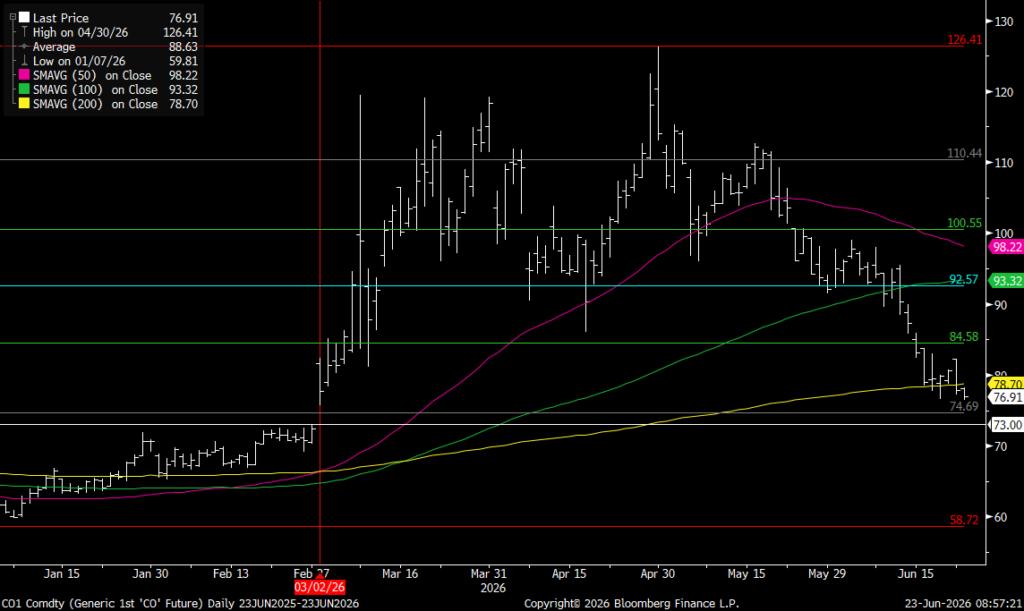
For now Brent crude keeps falling like a rock with the front-end Brent contract now only trading at a premium of $7.6/b above the five year contract. Quickly heading towards parity. The Brent M1 contract has now broken below its 200 dma of $78.7/b and is closing in on the Fibo-level at $74.7/b. Below that there is not much more supporting levels to be found before $73/b which would close the gap from February 3.
Brent crude M1 technical levels
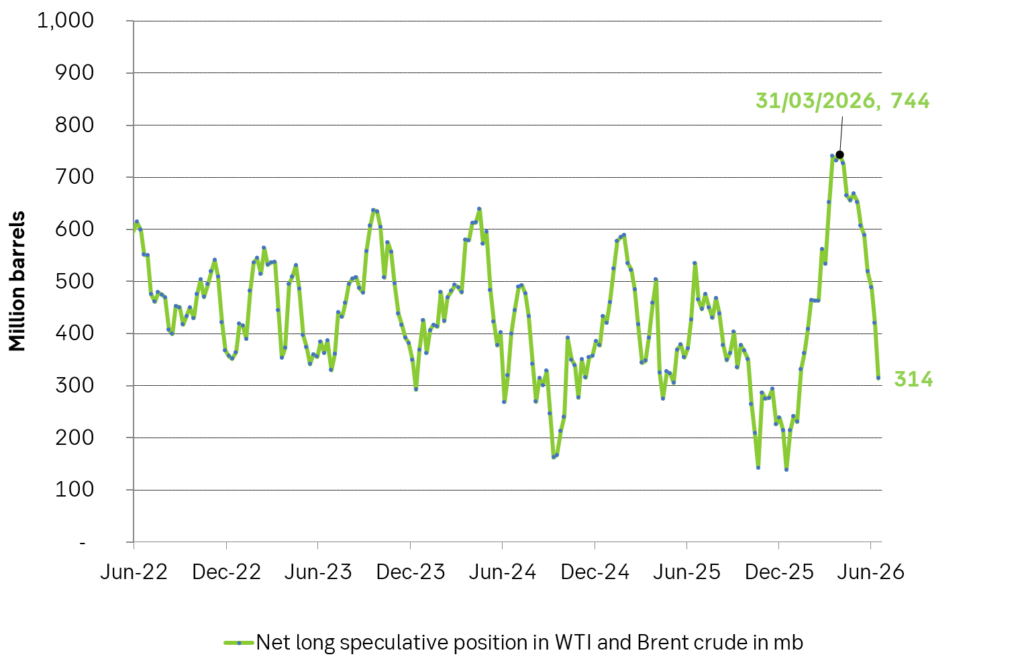
Net long speculative positions are also falling like a rock and as of Tuesday last week the net long positioning in Brent and WTI together summed to 314 million barrels and falling fast.
Will there be a rebound? A possible combination could be an exhaustion of the oil blob caught within the SoH within 1-2 weeks if exits continue at current rate while new ships entering are much more cautious, more Israeli bombardments in Lebanon as Netanyahu fights for re-election, a temporary closure of the SoH again while speculative short positions take cover buying back and covering their positions.
US and Israeli stands versus Iran could harden beyond elections so 2027 surplus is far from given. But Iran and the US are all in all moving towards a set of solutions with both clearly eager to reopen the SoH and keep it open. And that is what the market is pricing along with sharply falling prices. The ongoing discussions will likely take months and last beyond both the upcoming Israeli election (before 27 oct) and the US midterm elections on 3 Nov. Beyond those dates the stance by both Israel and the US may harden again versus Iran. But Iran knows that and is most likely preparing for such a hardening turn. Thus a surplus of oil and global oil stock rebuilding in 2027 (as now is mostly projected) is far from given.
Selling down on a ”deal”. Brent crude fell 6.2% last week with accelerated weakness towards the end of the week. Close of the week at $87.33/b and low of the week (and on Friday) of $85.8/b. Brent is falling another 4% this morning to $83.7/b on confirmation by Iran that a MoU text has been reached and that it will be signed on Friday this week.
So what is this ”deal” worth? Talk on the desk here this morning is that it is much like ”putting lipstick on a pig” where Trump has to sell this at home as a victory where ”the SoH has reopened”, the nuclear issue will be ironed out over the coming 60 days (or maybe 600 days?) and US consumers are getting a lower gasoline price and maybe US republicans survives the midterm elections.
The importance for Iran is that it emerges as the defacto winner of this war in the eyes of the non-US public world. That Iran now onwards is the ”ruler of the SoH” (combo of geography and new weapons systems like drones) or more softer: ”the guarantor of safe passage through the SoH”.
Iran doesn’t need nuclear weapons any more. Nuclear deterrence doesn’t work any more. Ukraine has made many attacks deep into Russia without being nuked in return. Plenty of Iranian ballistic rockets blasts over Israel but Iran wasn’t nuked in return.
There is no trust between the US and Iran. We don’t know all the details yet of the MoU. But what we do know is that there is no trust between the US and Iran what so ever. This is probably more like a descriptive text on how they can cooperate in a way where both sides keeps tactical leverage. Neither side makes irreversible concessions. Violations can be punished quickly. Cooperation produces immediate benefits.
This is a fragile structure. It can easily break down. There may be details which cannot be overcome. To be seen on Friday. The US has to show that it is willing put enough force behind managing and restraining Israel versus Hezbollah in Lebanon. We have seen that Netanyahu hasn’t listened all that much to Trump’s directives and wishes. This could be a major obstacle.
A gradual reopening is tactically preferable for Iran. A tactical leverage for Iran right now is that global oil stocks have been drawn down towards painful and increasingly dangerous levels with increasing risks for oil price spikes in mid-July to August. This together with US midterm elections on 3 November gives tactical leverage to Iran. Iran probably doesn’t want to fully give up on that leverage. A rapid, full reopening where global stocks are able to refill over the coming 60 days will significantly erode that leverage. If Iran reinstates a closure of the SoH after 60 days (if talks break down again), then the effect won’t be that impactful in terms of prices and the US midterm elections.
So a gradual and partial reopening where global markets gets the oil they need while they are unable to rebuild stocks could be a practical middle way for both parties. Trump can sell it as ”the SoH has reopened” and get affordable gasoline for US consumers. Iran can sell it as ”the SoH has fully reopened, but there is some friction” so flow is only 60-80% of normal.
Not much real demand destruction below $100/b. What we do know is that there is not much real price pain demand destruction for oil globally at an oil price below $100/b. A lot of demand-shock destruction. Fear. But demand should now come roaring back towards normal with fear for exceptionally high prices now is rapidly receding.
Sudden China demand destruction due to EVs? Bullocks. EV share of total Chinese carpool now around 13%. Share of new sales of EVs has reached 50%. This is a very gradual process. It doesn’t make oil demand fall like a rock over night. When EV new sales share reaches 100%, then the gasoline car pool will contract by some 5-10% per year. But that is only gasoline. Sudden reduction in Chinese oil demand is more about shock and risk.
Chinese crude oil imports will come roaring back. At what price? Today’s ”neutral” oil price is $70/b. That is the five year price which has steadily traded around the $70/b mark over the past 3-4 years. With still a risky picture one would think that China and the rest of the world will be big buyers of oil in the range of $70-85/b.
Global demand will likely snap back towards normal, forecasted demand and growth at such prices.
Physical reopening is a gradual process. The physical and practical reopening of the SoH will likely be gradual rather than sudden. And that probably suites Iran tactically as well.
Brent M1 price versus the Brent 5-yr (today’s ”normal” price)

Market is starting to take US/Iran headlines with a pinch of salt. Brent crude rose $2.8/b yesterday to an official close of $112.1/b. But after that it traded as low as $108.05/b before ending late night at around $109.7/b. Through the day it traded in a range of $106.87 – 112.72/b amid a flurry of news or rumors from Iran and the US. ”US temporary sanctions during negotiations” (falls alarm). ”We will bomb Iran” (not anyhow),… etc. While the market is still fluctuating to this kind of news flow, it is starting to take such headlines with a pinch of salt.
We’ll see. Maybe, maybe not. The Brent M1 contract is trading at $110.2/b this morning which very close to the average ticks through yesterday of $110.4/b.
Trump with bearish, verbal intervention whenever Brent trades above $110/b it seems. What seems to be a pattern is that Trump states something like ”very good negotiations going on with Iran”, ”New leaders in Iran are great,..”, ”Great progress in negotiations,…”, ”Deal in sight,..” etc whenever the Brent M1 contract trades above $110/b. An effort to cool the market. These hot air verbal interventions from Trump used to have a heavy bearish impact on prices, but they now seems to have less and less effect unless they are backed by reality.
As far as we can see there has been no real progress in the negotiations between the US and Iran with both sides still standing by their previous demands.
Iran is getting stronger while the cease fire lasts making a return to war for Trump yet harder. Iran is naturally in constant preparation for a return to war given Trump’s steady threats of bombing Iran again. Iran is naturally doing what ever is possible to prepare for a return to war. And every day the cease fire lasts it is better prepared. This naturally makes it more and more difficult and dangerous for the US to return to warring activity versus Iran as the consequences for energy infrastructure in the Persian Gulf will be more and more severe the longer the cease fire lasts. Israel seems to see it this way as well. That the war is not won and that current frozen state of a cease fire gives Iran opportunity to rebuild military and politically.
Global inventories are drawing down day by day. How much? In the meantime the Strait of Hormuz stays closed. There is varying measures and estimates of how much global inventories are drawing down. Our rough estimate, back of the envelope, is that global inventories are drawing down by at least some 10 mb/d or about 300 mb/d in a balance between loss of supply versus demand destruction. Other estimates we see are a monthly draw of 250-270 mb/d. The IEA only ’measured’ a draw in global observable stocks of 117 mb in April with oil on water rising 53 mb while on shore stocks fell 170 mb. But global stocks are hard to measure with large invisible, unmeasured stocks. As such a back of the envelope approach may be better.
Oil products is what the world is consuming. Oil product prices likely to rise while product stocks fall. Strategic Petroleum Reserves (SPR) are predominantly crude oil. Discharging oil from OECD SPR stocks, a sharp reduction in Chinese crude imports and a reduction in global refinery throughput of 6-7 mb/d has helped to keep crude oil markets satisfactorily supplied. But global inventories are drawing down none the less. And oil products is really what the world is consuming. So if global refinery throughput stays subdued, then demand will eventually have to match the supply of oil products. The likely path forward this summer is a steady draw down in jet fuel, diesel and gasoline. Higher prices for these. Then, if possible, higher refinery throughput and higher usage of crude in response to very profitable refinery margins. And lastly sharper draw in crude stocks and higher prices for these. But some 6 mb/d of oil products used to be exported through the Strait of Hormuz. And it may not be so easy to ramp up refinery activity across the world to compensate. Especially as Ukraine continues to damage Russian refineries as well as Russian crude production and export facilities.
Watch oil product stocks and prices as well as Brent calendar 2027. What to watch for this summer is thus oil product inventories falling and oil product premiums to crude rising. Another measure to watch is the Brent crude 2027 contract as it rises steadily day by day as the Strait of Hormuz stays closed and global oil inventories decline. The latter is close to the highest level since the start of the war and keeps rising.
The Brent M1 contract and the Brent 2027 prices and current price of jet fuel in Europe (ARA). All in USD/b

Our back of the envelope calculation of the global shortage created by the closure of the Strait of Hormuz. Note that 3.5 mb/d of discharge from SPR is also a draw. Note also that ’Forced demand loss’ of 2.5 mb/d is probably temporary and will fall back towards zero as logistics are sorted out leaving ’Price demand loss’ to do the job of balancing the market. Thus a shortfall of at least 9 mb/d created by the closure. More if SPR discharge is included and more if Forced demand loss recedes.


Brent falling like a rock with oil likely to flow from SoH until at least 3 November

Vattenfalls och Industrikrafts kärnkraftsbolag Videberg Kraft har valt Rolls-Royce SMR
Selling down on a ”deal”

Sommarväder skapar prisrally på elbörsen
Oil product price pain is set to rise as the Strait of Hormuz stays closed into summer
Sommarväder skapar prisrally på elbörsen
Vattenfalls och Industrikrafts kärnkraftsbolag Videberg Kraft har valt Rolls-Royce SMR
Selling down on a ”deal”
Brent falling like a rock with oil likely to flow from SoH until at least 3 November
-
Nyheter3 veckor sedan
Sommarväder skapar prisrally på elbörsen
-
 Nyheter1 vecka sedan
Vattenfalls och Industrikrafts kärnkraftsbolag Videberg Kraft har valt Rolls-Royce SMR
-
Analys1 vecka sedan
Selling down on a ”deal”
-
Analys14 timmar sedan
Brent falling like a rock with oil likely to flow from SoH until at least 3 November