

Analys
SEB – Råvarukommentarer, 2 december 2013

Rekommendationer
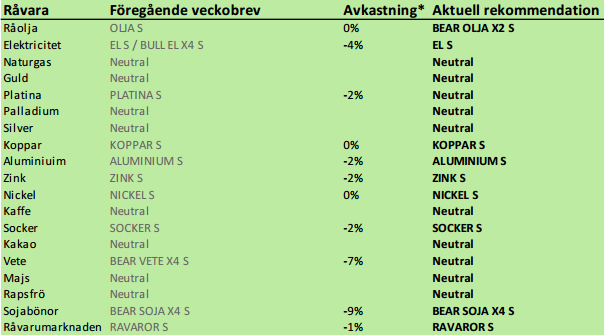
*) Avkastningen anges för 1:1 certifikaten där både BULL och 1:1 certifikat är angivna.
Råolja – Brent
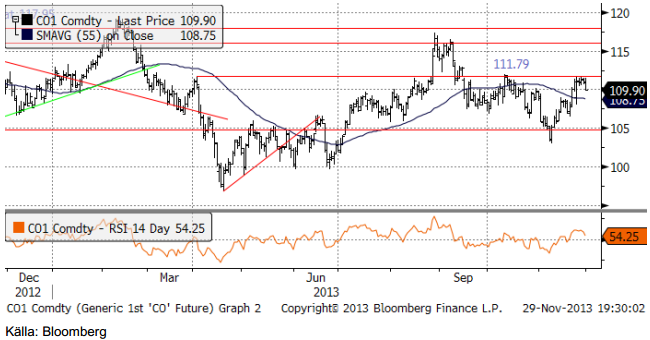
Oljepriset gick hela vägen upp till det gamla tekniska motståndet på 111.79 dollar per fat, innan det vände ner igen. SEB har uppdaterat sin prognos för oljepriset. Både för det första kvartalet och det andra nästa år, tror bankens oljeanalytiker på ett pris på 100 dollar per fat. De faktorer som bidrar till ett lågt pris är den stadigt ökande produktionen i USA, som innebär att mer olja blir kvar på världsmarknaden i kombination med fortsatt, förhållandevis, låg tillväxt i tillväxtländer.
EIA kunde i veckan meddela att bensinpriset i USA var det lägsta inför Thanksgiving-helgen på tre år. Förr i tiden ansågs ett lågt oljepris vara en drivkraft för tillväxt och det kanske är därför som USA – med såväl billig olja som ännu billigare naturgas drar ifrån resten av världen just nu. EU-28 pekades i veckan ut av chefen för International Energy Agency som i strykläge vad gäller tillväxt pga energipriser som är ca tre gånger så höga som i USA – och att detta är helt politiskt orsakat.
Priset på olja är nu så högt att vi inte längre kan rekommendera en köpt position i olja, utan går över till säljrekommendation. Den som vill kapitalisera på det, kan placera i BEAR OLJA X2 S med 2 gångers daglig hävstång eller BEAR OLJA X4 S med 4 gångers daglig hävstång – dvs en ganska hög risknivå.
I onsdagens DOE-rapport steg råoljelagren återigen och ligger nu som vi ser på rekordnivåer för säsongen.
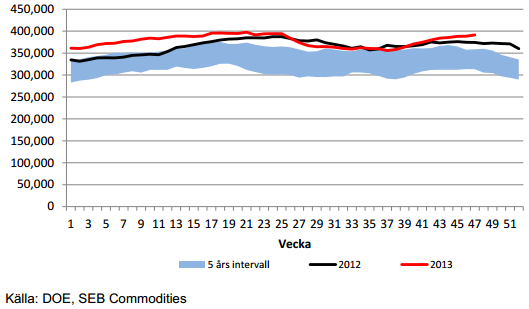
Lagerökningen i USA har hänger delvis ihop med lite högre import för en månad sedan – vilket är en typisk uppladdning inför Thanksgiving-helgen.
Vi tycker alltså att priset på olja är för högt i dag och rekommenderar att man tar hem vinster på OLJA S och kortsiktigt går in i något av våra BEAR-certifikat. SEB:s certifikat på olja har inte bara lägre avgifter än något annan emittents utan också lägre skillnad mellan köp- och säljkurs.
Elektricitet
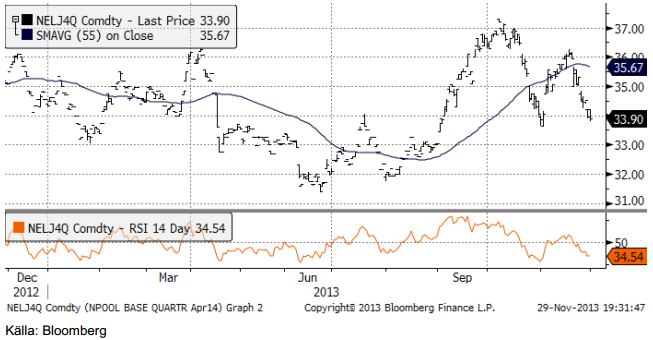
Certifikatet byter nu kontrakt från vinterkontraktet kvartal 1 till vår/försommarkontraktet kvartal 2. I diagrammet nedan ser vi den historiska prisutvecklingen på kvartal 1-kontraktet. Priset har rekylerat ner på förbättrad hydrologisk balans.
Kärnkraften i det nordiska börsområdet gick på 11 reaktorer, 82% av installerad kapacitet. Fredagens väderleksprognos visar på lägre genomsnittlig temperatur i veckan som kommer: -0.2C mot tidigare 0.2C prognosticerat. Normalt är 1.4C, så det är något kallare än normalt.
Enligt Markedskrafts prognosmodell ligger vattenkraften på +0.3 TWh över normalt om två veckor.
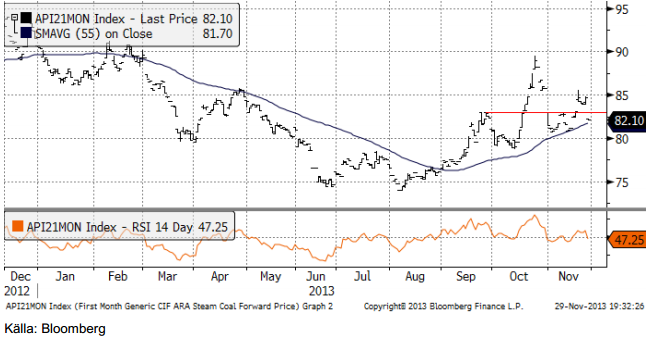
Nedan ser vi priset på energikol, den närmaste månadens leveranstermin. Priset steg successivt till 85 dollar, men föll kraftigt i torsdags och stängde veckan på 82.10 dollar / ton. Att marknaden inte orkade ta sig upp till föregående topp på 90 dollar, utan stannade på 85 dollar, får anses vara ett svaghetstecken.
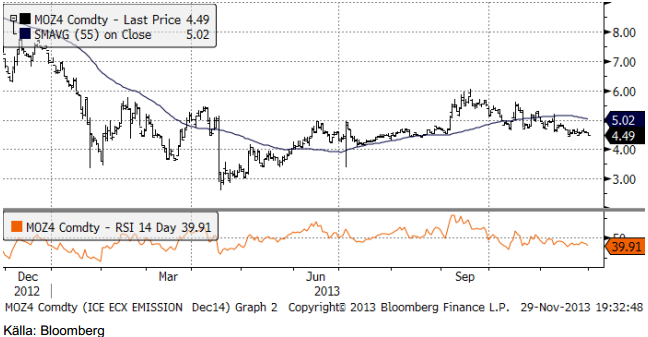
Prisutvecklingen på utsläppsrätter fortsätter att dala sakta. Omsättningen var dock mycket hög i veckan som gick.
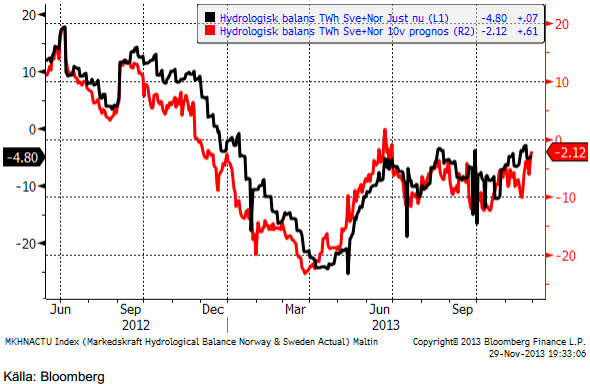
Hydrologisk balans ser vi nedan. Både den aktuella och 10-veckors prognos ligger strax under normala nivåer.
Vi rekommenderar köp av EL S.
Naturgas
Naturgaspriset i USA har handlats upp på det kalla vädret. Liksom i Norden, har det varit kallt i USA. Nedan ser vi januari-kontraktet.

Metaller
Den första delen av förra veckan kan bara beskrivas som väldigt tråkig. Kursrörligheten är på den lägsta nivån på flera år. Låga volatiliteter är ett fenomen som delas av de flesta finansiella marknader och är inte unikt för metallmarknaderna. Den här veckan var kursrörelserna mindre än vanligt – fram till onsdagens eftermiddag. USA var stängt på torsdagen för Thanksgiving. Vad som kan ha börjat som en likvidering av positioner inför helgen, startade en rask prisnedgång. Priserna gick ner med 1 – 2% i basmetallerna i en annars lugn marknad. Dollarn var lite svagare då och aktierna lite starkare, så det går inte att förklara prisrörelsen med de vanligaste faktorerna. Det gick inte heller att hitta någon annan förklaring.
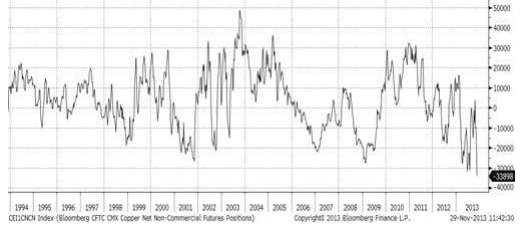
”Non-commercials” i CFTC:s värld, dvs ”spekulanter” är extremt sålda terminer på basmetaller just nu, vilket historiskt har visat att marknaden är känslig för ”short covering”. Positionen i Comex terminskontrakt på koppar visar att non-commercials är nettosåld 35,000 kontrakt. Det är den största negativa positionen sedan 1993 och så långt bakåt informationssystemet Bloomberg har data. Vi tror att det ser likadant ut i andra basmetaller, som vi inte har CFTC-data på eftersom de handlas på den engelska börsen LME och alltså inte rapporterar positioner till det amerikanska CFTC.
Från en teknisk synvinkel ligger koppar och zink fortfarande över de lägsta priserna från sommaren, medan nickel ligger nära botten. Aluminium sticker ut genom att nu handlas på fyra års lägsta pris de senaste två dagarna. Vi tror att marknaden är överdrivet såld och tillflöde av nya säljare för att på riktigt trycka ner priset ytterligare. Vi håller fast vid åsikten att marknaden diskonterar en allt för pessimistisk framtid. Vi tror att det finns utsikter för en ordentlig rekyl uppåt innan nyår. Den säsongsmässigt starka perioden ligger framför oss. December / januari brukar vara starka månder vad gäller priset.
Nedan ser vi non-commercials nettoposition i Comex-koppar-terminer:
Net non-commercial position Comex Copper
Koppar
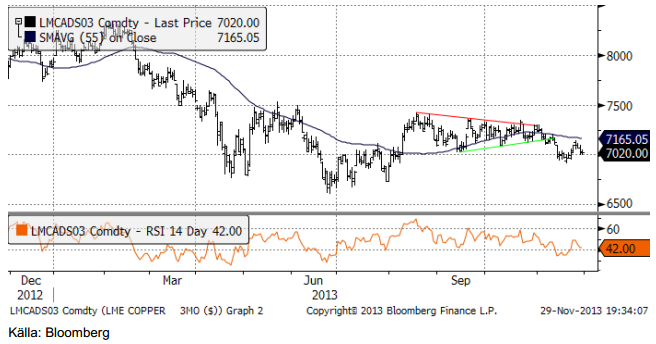
Koppar är just nu inte i fas med resten av basmetallgänget. Trots vad en teknisk analytiker skulle säga är en tydlig säljsignal efter utbrottet från triangelformationen för ett par veckor sedan, handlas koppar starkare än de övriga basmetallerna. Om man tar hänsyn till att spekulanterna på rekordhög nivå tycker att kopparpriset är säljvärt, är kopparprisets styrka ännu märkligare. De flesta marknadskommentatorer pekar på ”det ökade utbudet” som det huvudsakliga skälet till det negativa sentimentet kring metallen. Lagren vid börserna uppvisar tillbakavisar dock detta.
Lagren vid LME har sedan toppen på 675,000 ton sjunkit till 424,000 ton. Det är en minskning med 38%. Mest material har levererats ut från lagerhus i Malaysia. Materialet antas ha gått till Kina, men det finns (som vanligt) rykten om att det har parkerats någon annanstans (Vietnam talas det om). Vad som talar emot detta, är att det är en stadig minskning av LME-lagren och inte enskilda, stora uttag, som man skulle färvänta sig att se om ägarna till metallen ”parkerade om” den på en billigare parkeringsplats.
Skillnaden mellan spotpriset på koppar och tre månaders terminen är försumbar, vilket talar för att det är något av en bristsituation. Detta förefaller alltså peka på att ”non-commercials” är ute i ogjort väder.
Minskande lager brukar hänga ihop med högre volatilitet. Vi tror att sannolikheten är stor att dagens lugna marknad kommer att övergå i högre volatilitet. De senaste 30 dagarna har prisrörligheten legat på 30% omräknat till årsvolatilitet. Det är extremt lågt. Optioner på koppar prissätts också lågt och vi tror att detta är ett tillfälle att köpa optioner.
Högre volatilitet på råvaror hänger också ihop med stigande priser, eftersom båda påverkas av låga lager.
USA:s ekonomi börjar expandera allt snabbare nu, enligt flera indikatorer. Man ska dock inte av den anledningen tro att det har en positiv påverkan på kopparpriset. Om vi försöker förklara kvartalsvis prisförändring på koppar med följande variabler: BNP-tillväxt i Kina, BNP-tillväxt i USA och förändring av lagernivån på LME, ser vi att:
Lagerförändringen på LME har högst statistisk signifikans. En lagerminskning med 1% från föregående kvartal tenderar att höja priset med 9.5% (sannolikhet att det inte skulle stämma är 2%).
BNP-tillväxt i Kina är signifikant på 6%-nivån (det är 6% sannolikhet att högre BNP i Kina inte höjer kopparpriset).
BNP-tillväxt i USA, däremot är inte alls statistiskt signifikant för påverkan på kopparpriset. Parametern skattad på data från de 78 senaste kvartalen visar faktiskt ett negativt samband. Förmodligen är det så att ett högt kopparpris innebär högre kostnader för den amerikanska ekonomin och alltså lägre tillväxt.
Att det är högre tillväxt i USA är alltså inte något att glädja sig åt på kopparmarknaden. Kinas ekonomi stampar fortfarande på samma nivå som i våras och den ledande indikatorn ”Inköpschefsindex” har inte böjt av uppåt, som den gjort för USA och Storbritannien, t ex.
Lagernivåerna på LME är dock väsentligt lägre, och det är ett positivt tecken, som kopparmarknaden ännu inte reagerat på. Lägre lagernivåer behöver inte vara drivet av högre efterfrågan, som vi varit vana vid, utan kan också erhållas genom lägre utbud.
Världens största kopparproducent, det statliga chilenska bolaget Codelco ligger nära förlust vid dagens kopparpris. Under det andra kvartalet, när det genomsnittliga kopparpriset låg på 7038 dollar per ton, hade Codelco endast 7% marginal före skatt. Skulle priset alltså gå ner 7% till 6550 dollar, börjar bolaget gå med förlust, före skatt. Kopparmarknaden har vissa likheter med oljemarknaden, då Chile står för så stor del av världsproduktionen. Chile har också en Sovereign Wealth Fund för att samla produktionsskatter från kopparn, precis som många arabländer – och Norge – har för produktionsskatter på oljan. Chile kan naturligtvis liksom OPEC för oljan, begränsa produktionen, så att priset håller sig över en viss nivå. Räkneexemplet med Codelcos lönsamhet visar, att det kanske inte är långt ner till den nivån.
Vi tycker att prisfallet har gett en möjlighet att komma in på den långa sidan till bra pris och rekommenderar köp av KOPPAR S.
Aluminium
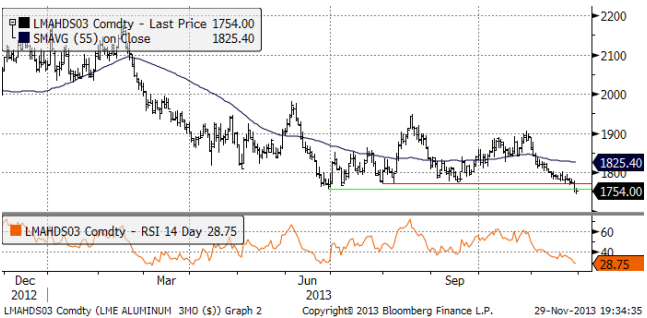
Priset på aluminium föll under sommarens lägsta notering. Den kortsiktiga köprekommendation vi avgav för ett par veckor förutsatte att botten inte skulle brytas. Den som vill skydda sitt kapital och inte låta en liten förlust bli större, bör ta stoppen nu.
Däremot ser vi att RSI ligger på under 30, vilket indikerar en ”översåld” marknad. Det behöver inte i sig innebära en helt säker rekyl uppåt, som skedde till i slutet av juni.
Ett möjligt scenario är att prisfallet får igång de länge väntade produktionsneddragningarna. Samtidigt är contangot på aluminium så stort, hela 7%. Det innebär att köpare har en intäkt på 7% på att äga metallen utan prisrisk. Kostnaden för finansiering och lagring är för många betydligt lägre än 7% per år. Materialet har därför inga svårigheter att hitta köpare. Detta håller i sin tur premierna för fysisk metall höga.
Sammantaget alla faktorer, förväntas efterfrågan öka med mellan 5% och 7% per år, vilket innebär att produktionsöverskottet sakta kommer att betas av. Vi favoriserar fortfarande en köpt position, även om uppsidan också är begränsad. Vi tror att det kommer en rekyl och rekommenderar att man säljer in i den. En rekyl uppåt kan ta priset upp till 1900 dollar per ton.
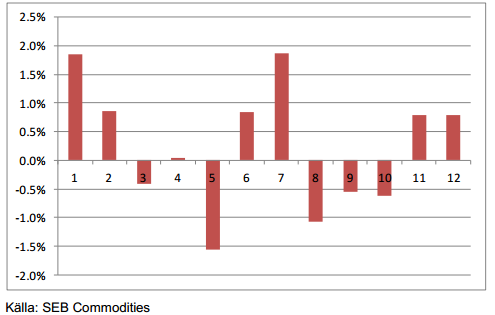
Nedan ser vi hur aluminiumpriset historiskt har utvecklat sig i genomsnitt för årets tolv månader. Perioden är från januari 1990 till november 2013. Vi ser att december och januari historiskt har varit starka månader för aluminium.
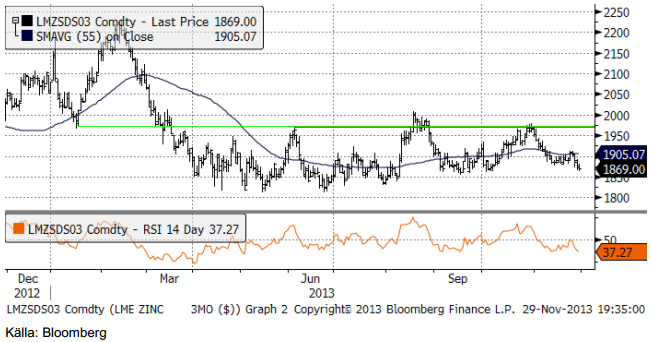
Zink
Zinkmarknaden handlar ner mot 1850-nivån, där det bör finnas stöd. Det är i botten av det konsolideringsintervall som varit rådande sedan april i våras. Vi rekommenderar köp av ZINK S.
Nickel
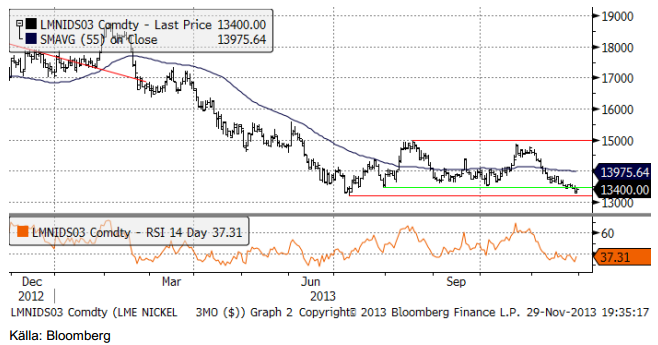
Vår grundsyn är att man ska försöka köpa nickel, i synnerhet om priset kommer ner mot 13,500 dollar per ton. Som vi ser i prisdiagrammet nedan, är priset nere vid den bottennivå som började etableras under juli och vi tror att det är ett bra köptillfälle nu, då priset faktiskt är under den nivå som vi indikerat som köpvärt.
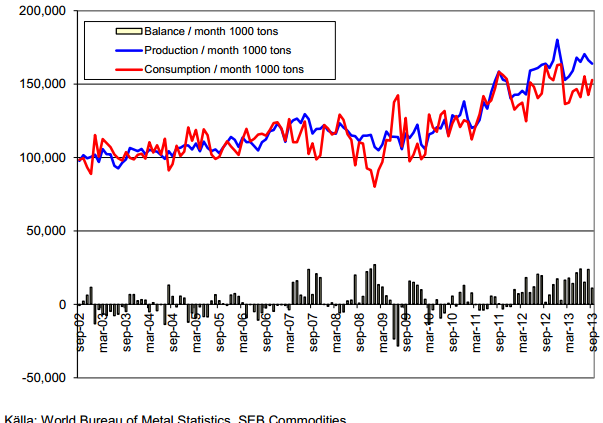
Nedan ser vi produktion och konsumtion av nickel i historiskt perspektiv, uppdaterat till september, enligt siffror från World Bureau of Metal Statistics. Produktionen är något lägre i sen tid och konsumtionen något högre. Det innebär att överskottet i september var bara hälften så stort som i augusti.
Vår grundsyn är att man bör försöka köpa nickel och rekommenderar köp av NICKEL S. Priset (cash och 3 månaders termin, som vi alltid avser), går att följa på www.basemetals.com
Guld
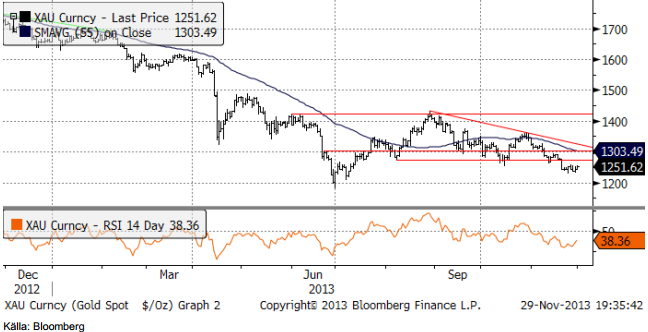
Guldpriset (i dollar), som för ett par veckor sedan föll under den tekniska stödnivån på 1273, har sedan dess rört sig förvånande lite.
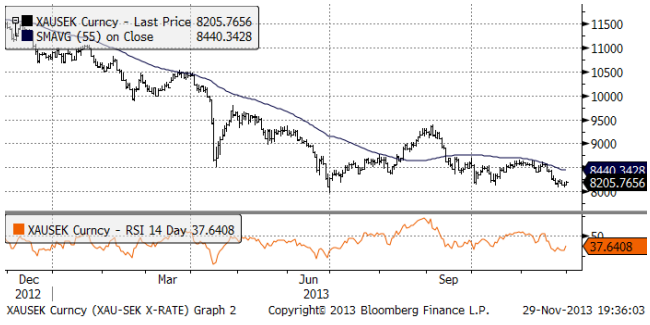
I termer av kronor, har priset hållit sig stabilt, med endast marginella prisrörelser under veckan. Vi ser kursdiagrammet på priset i kronor för ett troy uns nedan. Notera att vi inte har någon teknisk köpsignal, men vi har ett tekniskt stöd vid 8000 kr. Trenden är fortfarande nedåtriktad.
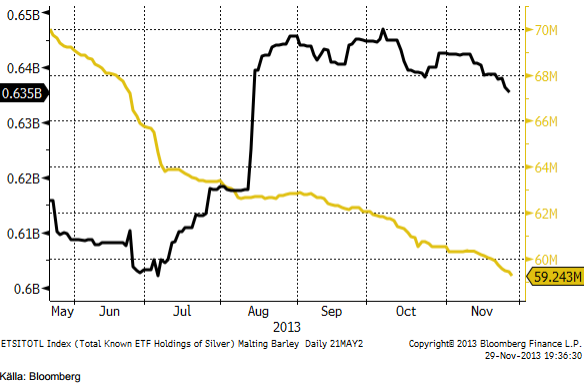
Finansiella placerares likvidering av innehaven i börshandlade guld-ETP-er har tagit ny fart i november. Den utplaning av likvideringen som vi såg i början av månaden visade var alltså tillfällig. I diagrammet nedan ser vi antalet uns som innehas av börshandlade fonder det senaste halvåret. Den gula kurvan avser guld och den svarta silver.
Det är inte bara investerarna av likvida ETP-er som är skeptiska till guld som investering. US Mint rapporterade i fredags att försäljningen av deras American Eagle bullion coin, minskade med 1% i november jämfört med oktober. I oktober såldes 48,500 uns och i november 48,000. Mönstret tidigare under året har varit att lägre pris lett till likvidering av guld-ETP:er, men ökade köp av fysisk metall. Nu har alltså även de fysiska köparna börjat dra sig för att köpa.
Vi fortsätter tills vidare med neutral vy på guld.
Silver
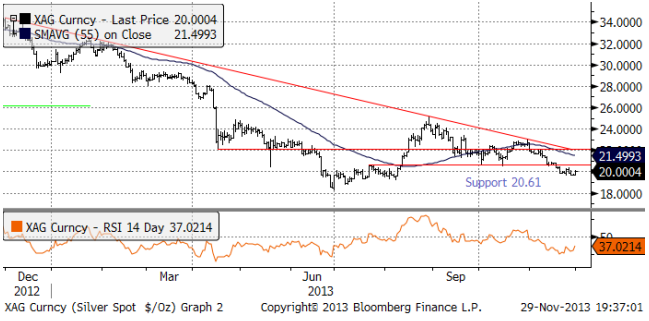
Nedan ser vi kursdiagrammet för silver i dollar per troy ounce. Priset stängde i fredags på 20 dollar per uns. Silverpriset har haft svårt att ta sig bort från 20 dollar. Vi hade förväntat oss något svagare utveckling efter att priset gick under 20 dollar första gången för en dryg vecka sedan.
Vi fortsätter att vara neutrala guld och silver.
Platina & Palladium
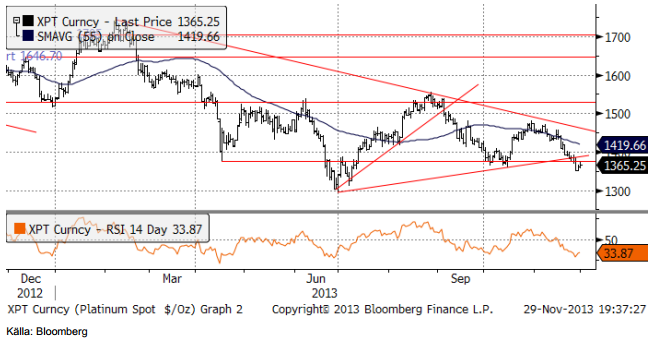
Platinapriset borde ha stöd från strejkerna i Sydafrika, men har det inte. Den triangelformation som etablerats i prisutvecklingen sedan botten i juni, har nu brutis på nedsidan, vilket indikerar att trenden fortfarande är nedåtriktad.
RSI ligger har dock varit under 30, vilket indikerar en översåld marknad och en nära förestående rekyl uppåt i priset.
Priset på palladium har funnit stöd på 710 dollar per uns. I dagsläget är det omöjligt att säga om den konsolidering som skett vid den nivån kommer att följas av ytterligare en nedgång eller om det blir en rekyl uppåt.
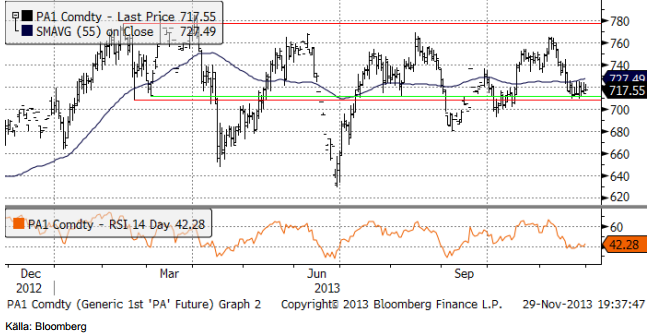
Vi behåller vår neutrala rekommendation på palladium och går även över till neutral på platina.
Kaffe
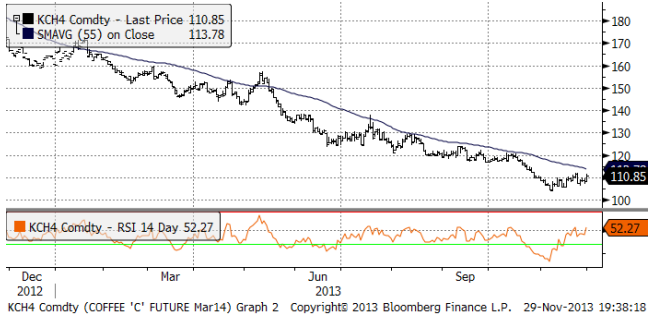
Kaffepriset handlade hela veckan över den tidigare bottennivån strax över 100 cent och stängde veckan på 109 cent. 110 cent har rekylen dock ännu inte lyckats ta sig över.
På en konferens i lördags (16 nov) i Costa Rica, sade BNP Paribas kaffeanalytiker att produktionsöverskottet i år 2013/14, som började den 1 oktober sjunker till 3 miljoner säckar (à 60 Kg) från 4 miljoner säckar under 2012/13. Nästan hela överskottet utgörs av arabica. Konsumtionen av den billigare och enklare och mer lättodlade robustan ökar i tillväxtländerna så att den relativt stora produktionsökningen framförallt i Vietnam sväljs.
I fredags sänkte dock USDA estimatet för Brasiliens skörd av kaffe (huvudsakligen arabica) från 53.7 miljoner säckar till 53.1 miljoner för 2013/14, vilket är 3 miljoner säckar mindre än under 2012/13. Det står i rapporten på USDA:s hemsida att kvaliteten är sämre än förra året.
Kostnaderna väntas stiga från en nivå 2012/13 på 122 cent per pund till 134 cent per pund. Det innebär att priset ligger under en nivå där 50% av kaffeproducenterna i Brasilien gör förlust. Det är naturligtvis en ohållbart låg prisnivå. Den som vill läsa rapporten kan göra det här.
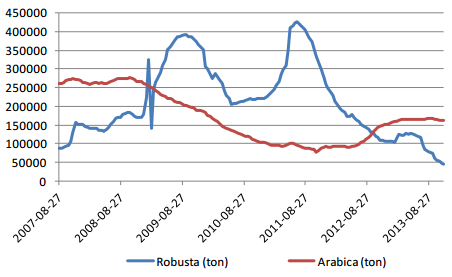
Lagret av robusta vid LIFFE-börsen har fortsatt att sjunka sedan i somras och är nu på extremt låga nivåer i ett historiskt perspektiv. Lagren av arabica vid NYBOT (ICE) i New York har faktiskt också slutat öka i år och sjunkit med 7300 ton sedan den 29 augusti.
Vi behåller tills vidare neutral rekommendation, tills vi ser tecken på ett trendbrott.
[box]SEB Veckobrev Veckans råvarukommentar är producerat av SEB Merchant Banking och publiceras i samarbete och med tillstånd på Råvarumarknaden.se[/box]
Disclaimer
The information in this document has been compiled by SEB Merchant Banking, a division within Skandinaviska Enskilda Banken AB (publ) (“SEB”).
Opinions contained in this report represent the bank’s present opinion only and are subject to change without notice. All information contained in this report has been compiled in good faith from sources believed to be reliable. However, no representation or warranty, expressed or implied, is made with respect to the completeness or accuracy of its contents and the information is not to be relied upon as authoritative. Anyone considering taking actions based upon the content of this document is urged to base his or her investment decisions upon such investigations as he or she deems necessary. This document is being provided as information only, and no specific actions are being solicited as a result of it; to the extent permitted by law, no liability whatsoever is accepted for any direct or consequential loss arising from use of this document or its contents.
About SEB
SEB is a public company incorporated in Stockholm, Sweden, with limited liability. It is a participant at major Nordic and other European Regulated Markets and Multilateral Trading Facilities (as well as some non-European equivalent markets) for trading in financial instruments, such as markets operated by NASDAQ OMX, NYSE Euronext, London Stock Exchange, Deutsche Börse, Swiss Exchanges, Turquoise and Chi-X. SEB is authorized and regulated by Finansinspektionen in Sweden; it is authorized and subject to limited regulation by the Financial Services Authority for the conduct of designated investment business in the UK, and is subject to the provisions of relevant regulators in all other jurisdictions where SEB conducts operations. SEB Merchant Banking. All rights reserved.

Selling down on a ”deal”. Brent crude fell 6.2% last week with accelerated weakness towards the end of the week. Close of the week at $87.33/b and low of the week (and on Friday) of $85.8/b. Brent is falling another 4% this morning to $83.7/b on confirmation by Iran that a MoU text has been reached and that it will be signed on Friday this week.

So what is this ”deal” worth? Talk on the desk here this morning is that it is much like ”putting lipstick on a pig” where Trump has to sell this at home as a victory where ”the SoH has reopened”, the nuclear issue will be ironed out over the coming 60 days (or maybe 600 days?) and US consumers are getting a lower gasoline price and maybe US republicans survives the midterm elections.
The importance for Iran is that it emerges as the defacto winner of this war in the eyes of the non-US public world. That Iran now onwards is the ”ruler of the SoH” (combo of geography and new weapons systems like drones) or more softer: ”the guarantor of safe passage through the SoH”.
Iran doesn’t need nuclear weapons any more. Nuclear deterrence doesn’t work any more. Ukraine has made many attacks deep into Russia without being nuked in return. Plenty of Iranian ballistic rockets blasts over Israel but Iran wasn’t nuked in return.
There is no trust between the US and Iran. We don’t know all the details yet of the MoU. But what we do know is that there is no trust between the US and Iran what so ever. This is probably more like a descriptive text on how they can cooperate in a way where both sides keeps tactical leverage. Neither side makes irreversible concessions. Violations can be punished quickly. Cooperation produces immediate benefits.
This is a fragile structure. It can easily break down. There may be details which cannot be overcome. To be seen on Friday. The US has to show that it is willing put enough force behind managing and restraining Israel versus Hezbollah in Lebanon. We have seen that Netanyahu hasn’t listened all that much to Trump’s directives and wishes. This could be a major obstacle.
A gradual reopening is tactically preferable for Iran. A tactical leverage for Iran right now is that global oil stocks have been drawn down towards painful and increasingly dangerous levels with increasing risks for oil price spikes in mid-July to August. This together with US midterm elections on 3 November gives tactical leverage to Iran. Iran probably doesn’t want to fully give up on that leverage. A rapid, full reopening where global stocks are able to refill over the coming 60 days will significantly erode that leverage. If Iran reinstates a closure of the SoH after 60 days (if talks break down again), then the effect won’t be that impactful in terms of prices and the US midterm elections.
So a gradual and partial reopening where global markets gets the oil they need while they are unable to rebuild stocks could be a practical middle way for both parties. Trump can sell it as ”the SoH has reopened” and get affordable gasoline for US consumers. Iran can sell it as ”the SoH has fully reopened, but there is some friction” so flow is only 60-80% of normal.
Not much real demand destruction below $100/b. What we do know is that there is not much real price pain demand destruction for oil globally at an oil price below $100/b. A lot of demand-shock destruction. Fear. But demand should now come roaring back towards normal with fear for exceptionally high prices now is rapidly receding.
Sudden China demand destruction due to EVs? Bullocks. EV share of total Chinese carpool now around 13%. Share of new sales of EVs has reached 50%. This is a very gradual process. It doesn’t make oil demand fall like a rock over night. When EV new sales share reaches 100%, then the gasoline car pool will contract by some 5-10% per year. But that is only gasoline. Sudden reduction in Chinese oil demand is more about shock and risk.
Chinese crude oil imports will come roaring back. At what price? Today’s ”neutral” oil price is $70/b. That is the five year price which has steadily traded around the $70/b mark over the past 3-4 years. With still a risky picture one would think that China and the rest of the world will be big buyers of oil in the range of $70-85/b.
Global demand will likely snap back towards normal, forecasted demand and growth at such prices.
Physical reopening is a gradual process. The physical and practical reopening of the SoH will likely be gradual rather than sudden. And that probably suites Iran tactically as well.
Brent M1 price versus the Brent 5-yr (today’s ”normal” price)

Market is starting to take US/Iran headlines with a pinch of salt. Brent crude rose $2.8/b yesterday to an official close of $112.1/b. But after that it traded as low as $108.05/b before ending late night at around $109.7/b. Through the day it traded in a range of $106.87 – 112.72/b amid a flurry of news or rumors from Iran and the US. ”US temporary sanctions during negotiations” (falls alarm). ”We will bomb Iran” (not anyhow),… etc. While the market is still fluctuating to this kind of news flow, it is starting to take such headlines with a pinch of salt.
We’ll see. Maybe, maybe not. The Brent M1 contract is trading at $110.2/b this morning which very close to the average ticks through yesterday of $110.4/b.
Trump with bearish, verbal intervention whenever Brent trades above $110/b it seems. What seems to be a pattern is that Trump states something like ”very good negotiations going on with Iran”, ”New leaders in Iran are great,..”, ”Great progress in negotiations,…”, ”Deal in sight,..” etc whenever the Brent M1 contract trades above $110/b. An effort to cool the market. These hot air verbal interventions from Trump used to have a heavy bearish impact on prices, but they now seems to have less and less effect unless they are backed by reality.
As far as we can see there has been no real progress in the negotiations between the US and Iran with both sides still standing by their previous demands.
Iran is getting stronger while the cease fire lasts making a return to war for Trump yet harder. Iran is naturally in constant preparation for a return to war given Trump’s steady threats of bombing Iran again. Iran is naturally doing what ever is possible to prepare for a return to war. And every day the cease fire lasts it is better prepared. This naturally makes it more and more difficult and dangerous for the US to return to warring activity versus Iran as the consequences for energy infrastructure in the Persian Gulf will be more and more severe the longer the cease fire lasts. Israel seems to see it this way as well. That the war is not won and that current frozen state of a cease fire gives Iran opportunity to rebuild military and politically.
Global inventories are drawing down day by day. How much? In the meantime the Strait of Hormuz stays closed. There is varying measures and estimates of how much global inventories are drawing down. Our rough estimate, back of the envelope, is that global inventories are drawing down by at least some 10 mb/d or about 300 mb/d in a balance between loss of supply versus demand destruction. Other estimates we see are a monthly draw of 250-270 mb/d. The IEA only ’measured’ a draw in global observable stocks of 117 mb in April with oil on water rising 53 mb while on shore stocks fell 170 mb. But global stocks are hard to measure with large invisible, unmeasured stocks. As such a back of the envelope approach may be better.
Oil products is what the world is consuming. Oil product prices likely to rise while product stocks fall. Strategic Petroleum Reserves (SPR) are predominantly crude oil. Discharging oil from OECD SPR stocks, a sharp reduction in Chinese crude imports and a reduction in global refinery throughput of 6-7 mb/d has helped to keep crude oil markets satisfactorily supplied. But global inventories are drawing down none the less. And oil products is really what the world is consuming. So if global refinery throughput stays subdued, then demand will eventually have to match the supply of oil products. The likely path forward this summer is a steady draw down in jet fuel, diesel and gasoline. Higher prices for these. Then, if possible, higher refinery throughput and higher usage of crude in response to very profitable refinery margins. And lastly sharper draw in crude stocks and higher prices for these. But some 6 mb/d of oil products used to be exported through the Strait of Hormuz. And it may not be so easy to ramp up refinery activity across the world to compensate. Especially as Ukraine continues to damage Russian refineries as well as Russian crude production and export facilities.
Watch oil product stocks and prices as well as Brent calendar 2027. What to watch for this summer is thus oil product inventories falling and oil product premiums to crude rising. Another measure to watch is the Brent crude 2027 contract as it rises steadily day by day as the Strait of Hormuz stays closed and global oil inventories decline. The latter is close to the highest level since the start of the war and keeps rising.
The Brent M1 contract and the Brent 2027 prices and current price of jet fuel in Europe (ARA). All in USD/b

Our back of the envelope calculation of the global shortage created by the closure of the Strait of Hormuz. Note that 3.5 mb/d of discharge from SPR is also a draw. Note also that ’Forced demand loss’ of 2.5 mb/d is probably temporary and will fall back towards zero as logistics are sorted out leaving ’Price demand loss’ to do the job of balancing the market. Thus a shortfall of at least 9 mb/d created by the closure. More if SPR discharge is included and more if Forced demand loss recedes.

Brent is climbing higher. Front-month is at USD 106.3/bl this morning, close to a weekly high and a USD 9/bl jump from Mondays open. This is the move we flagged as a risk earlier in the week: the market shifting from ”a deal is around the corner” to ”this is going to take longer than we thought”.

Analyst Commodities, SEB
During April, rest-of-year Brent remained remarkably stable around USD 90/bl. A stability which rested on one single assumption: the SoH reopens around 1 May. That assumption is now slowly falling apart.
As we highlighted yesterday: every week of delay beyond 1 May adds (theoretically) ish USD 5/bl to the rest-of-year average, as global inventories draw 100 million barrels per week. i.e., a mid-May reopening implies rest-of-year Brent closer to USD 100/bl, and anything pushing into June or July takes us meaningfully higher.
What’s changed in the last 48 hours:
#1: The US military has formally warned that clearing suspected sea mines from SoH could take up to six months. That is a completely different timescale from what the financial market is pricing. Even a political deal tomorrow does not immediately reopen the strait.
#2: Trump has shifted his tone from urgency to ”strategic patience”. In yesterday’s press conference: ”Don’t rush me… I want a great deal.” The market is reading this as a president no longer feeling pressured by timelines, with the naval blockade running in the background.
#3: So far, the military activity is escalating, not de-escalating. Axios reports Iran is laying more mines in SoH. The US 3rd carrier strike group (USS George H.W. Bush) is arriving with two countermine vessels. Trump yesterday ordered the US Navy to destroy any Iranian boats caught laying mines. While CNN reports that the Pentagon is actively drawing up plans to strike Iranian SoH capabilities and individual Iranian military leaders if the ceasefire collapses. i.e., NOT a attitude consistent with an imminent deal!
Spot crude and product prices eased off the early-April highs on a combination of system rerouting and deal optimism. Both now weakening. Goldman estimates April Gulf output is reduced by 14.5 mbl/d, or 57% of pre-war supply, a number that keeps getting worse the longer this drags on.
Demand-side adaptation is ongoing: S. Korea has cut its Middle East crude dependence from 69% to 56% by pulling more from the Americas and Africa, and Japan is kicking off a second round of SPR releases from 1 May. But SPRs are finite.
Ref. to the negotiations, we should not bet on speed. The current Iranian leadership is dominated by genuine hardliners willing to absorb economic pain and run the clock to extract concessions. That is not a setup for a rapid resolution. US/Israeli media briefings keep framing the delay as ”internal Iranian divisions”, the reality is more complicated and points toward weeks and months, not days.
Our point is that the complexity is large, and higher prices have only just started (given a scenario where the negotiations drag out in time). The market spent April leaning on the USD 90/bl rest-of-year assumption; that case is diminishing by the hour. If ”early May reopening” is replaced by ”June, July or later” over the next week or two, both crude and products have meaningful room to reprice higher from here. There is a high risk being short energy and betting on any immediate political resolution(!).


Vattenfalls och Industrikrafts kärnkraftsbolag Videberg Kraft har valt Rolls-Royce SMR
Selling down on a ”deal”

Sommarväder skapar prisrally på elbörsen
Oil product price pain is set to rise as the Strait of Hormuz stays closed into summer

Solkraften pressar elpriserna dagtid
Oil product price pain is set to rise as the Strait of Hormuz stays closed into summer
Sommarväder skapar prisrally på elbörsen
Vattenfalls och Industrikrafts kärnkraftsbolag Videberg Kraft har valt Rolls-Royce SMR
Selling down on a ”deal”
-
Analys4 veckor sedan
Oil product price pain is set to rise as the Strait of Hormuz stays closed into summer
-
Nyheter2 veckor sedan
Sommarväder skapar prisrally på elbörsen
-
 Nyheter2 dagar sedan
Vattenfalls och Industrikrafts kärnkraftsbolag Videberg Kraft har valt Rolls-Royce SMR
-
Analys3 dagar sedan
Selling down on a ”deal”