

Analys
SEB – Råvarukommentarer, 18 november 2013

Rekommendationer
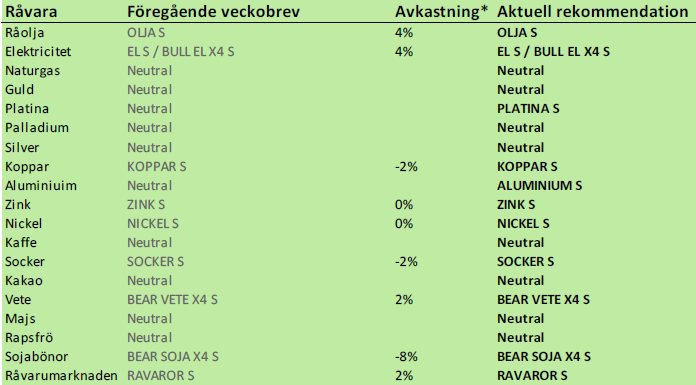
*) Avkastningen anges för 1:1 certifikaten där både BULL och 1:1 certifikat är angivna.
Inledning
Energi handlades upp i förra veckan. OLJA S och EL S steg båda med 4%. Basmetallerna inledde veckan med att fortsätta nedåt, men vände upp mot slutet av veckan. Jordbruksprodukterna handlades allmänt sett något svagt under lugn handel. Det kommer inte att komma så mycket ny information om spannmål och oljeväxter förrän i januari och det finns lite information just nu att handla på.
Ädelmetallerna, som prismässigt inte rosat marknaden alls i år, fick tillbaka lite glans i veckan.
Politiska uttalanden efter det tredje kinesiska politiska plenarmötet (under den 18:e kinesiska folkkongressen) var från början en stor besvikelse för marknaden, som omedelbart fick kinesiska aktier och industrimetaller på fall. Marknaden hade hoppats och förväntat starkare signaler om reformer (liberalisering). Politiska uttalanden från sådana plenarsammanträden, är dock alltid mycket generella och tydligare signaler kan komma under de närmaste veckorna. Marknaderna återhämtade återhämtade sig.
Den tillträdande nya chefen för USA:s centralbank, Janet Yellen sade i veckan: ”Jag anser att det är viktigt att vi gör vad vi kan för att främja en mycket stark återhämtning” Hon placerade sig starkt bakom Bernankes penningpolitik med kvantitativa lättnader, och kommer att fortsätta dessa. Billiga pengar kommer alltså att strömma in i Kina och andra tillväxtmarknader. Detta gav globala aktiemarknader understöd de senaste dagarna. Det har också resulterat i att likvideringen av placeringar i guld har stannat av.
Råolja – Brent
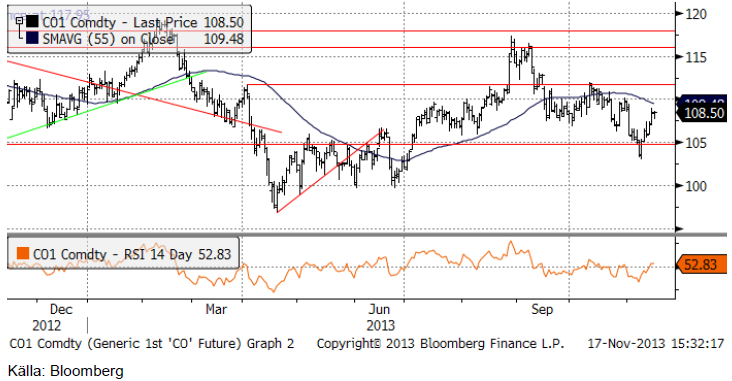
Oljepriset fortsatte att återhämta förlorad mark i veckan som gick. EPA (i USA) meddelade i fredags att inblandningen av biobränslen i amerikanska drivmedel ska sänkas. Det var en förlust för den amerikanska jordbrukslobbyn och en vinst för petroleumindustrin. Prisuppgången i USA är nästan uppe vid det tekniska motståndet 110 dollar och vi tycker att man ska avvakta med köp just nu, även om vi generellt sett tycker att man bör vara köpt OLJA S i en diversifierad sparportfölj.
I onsdagens DOE-rapport steg råoljelagren för åttonde veckan på raken. Lagernivåerna ligger nu återigen på rekordnivåer för den här tiden på året, högre än förra året.
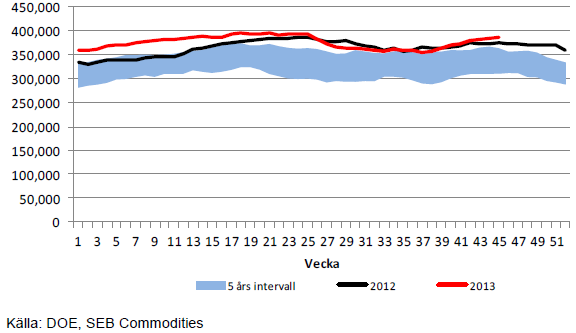
Lagerökningen i USA har hänger dock ihop med en något högre import än de senaste veckorna, som vi ser i diagrammet nedan.
Vi tycker att priset är något ”högt” i dag, och även om vi som sagt tycker att OLJA S erbjuder bra avkastning via rabatten på oljeterminerna, tror vi det är bättre att vänta med köp.
Elektricitet
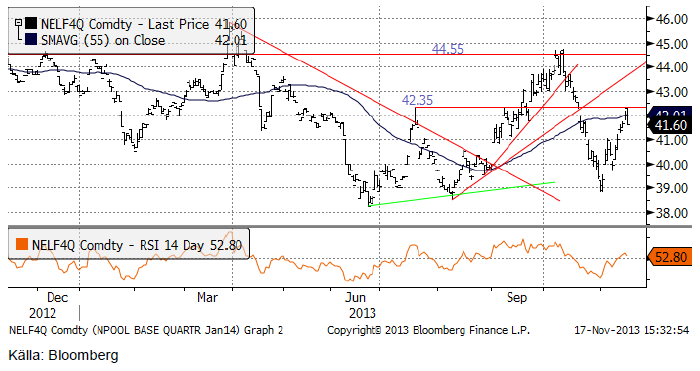
Elpriset, det första kvartalets kontrakt, gick upp till motståndet i diagrammet nedan, vid 42.35 euro och föll sedan tillbaka för att stänga på 41.60 på veckan. Veckans prisuppgång i el och en starkare euro mot kronan ledde till att EL S steg med 4% och BULL EL X4 S med 14%. Om fredagens nedgång fortsätter i veckan, är det troligt att rekylen nedåt åtminstone går till 41 euro, där det finns ett visst stöd.
Nedan ser vi prisdiagrammet för det första kvartalet 2014:s kontrakt, uppdaterat till i fredags.
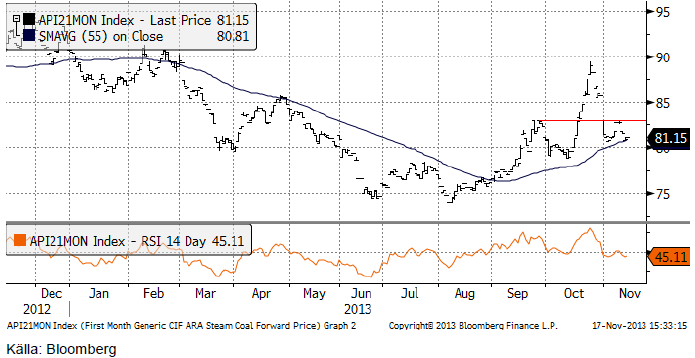
Nedan ser vi priset på energikol, den närmaste månadens leveranstermin. Priset slutade veckan med att falla ner till 55-dagars glidande medelvärde igen. Prisuppgången lyckades inte ta priset över 83 dollar, som nu är ett motstånd för vidare uppgång.
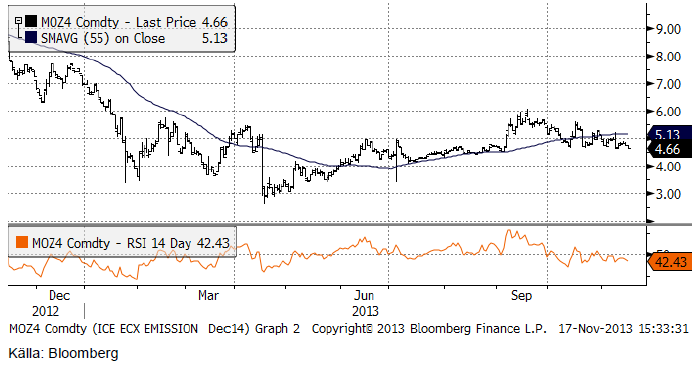
Prisutvecklingen på utsläppsrätter har blivit allt lugnare. Vi tror att det är ett temporärt lugn. En avtagande volatilitet på svagt sjunkande kurser, kan plötsligt vändas i en snabb uppgångsfas.
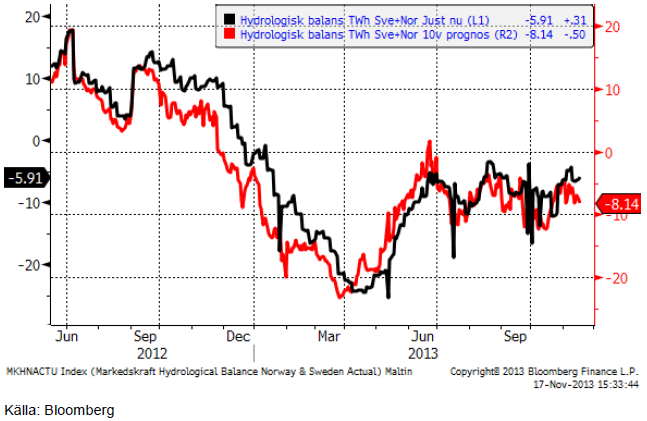
Hydrologisk balans ser vi nedan. Vi ser särskilt att 10-veckorsprognosen föll i veckan och indikerar nu ett hydrologiskt underskott på 8 TWh.
Vi rekommenderar köp av EL S eller BULL EL X4 S, men tycker man kan avvakta någon dag in i veckan ifall marknaden öppnar ner på måndag.
Naturgas
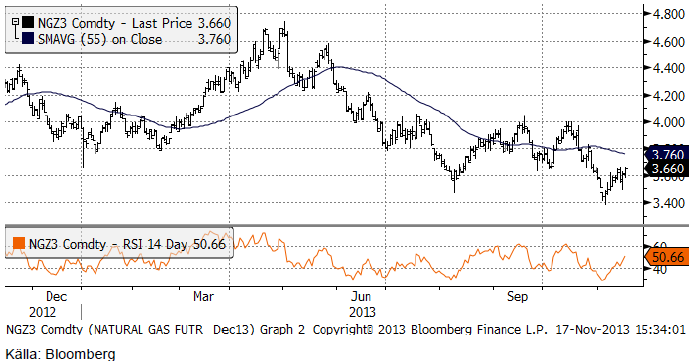
Naturgaspriset som för två veckor sedan fann stöd på 3.40 och vände upp till 3.60, har efter en hastig rekyl fortsatt uppåt. Trenden är dock nedåtriktad och man de som väntar på ett tillfälle att köpa BEAR kan snart få det.
Metaller
Metallerna gynnades allmänt av Yellens besked om att fortsätta Bernankes inslagna linje med kvantitativa lättnader och en expansiv penningpolitik.
Koppar
Kopparpriset föll hela vägen ner till 7000 dollar per ton, där marknaden har gott stöd. I fredagskvällens handel på COMEX i New York kom köpare in och handlade upp marknaden.
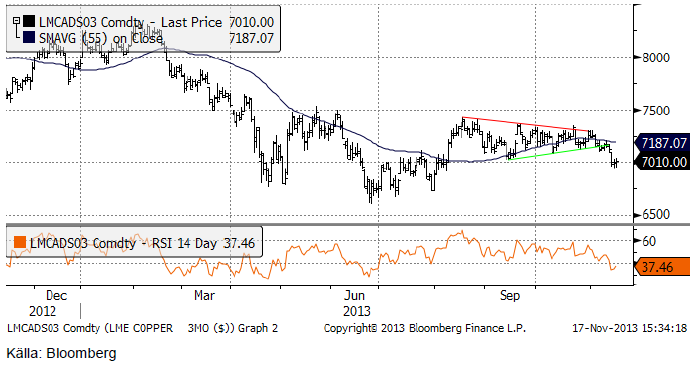
Vi tycker att prisfallet har gett en möjlighet att komma in på den långa sidan till bra pris och rekommenderar köp av KOPPAR S.
Aluminium
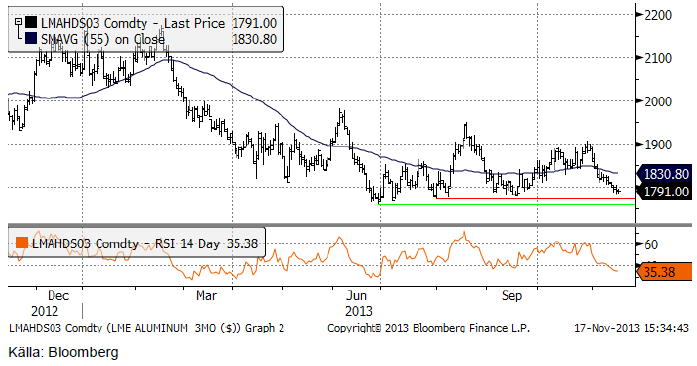
Aluminium, som är den basmetall vi och de flesta bedömare är mest skeptiska till som placering, har den senaste månaden handlats ner till de lägsta nivåerna de senaste åren, sommarens bottennivåer. Med tanke på hur väl etablerad den bottennivån är, tror vi inte att den kommer att brytas den här gången heller. Vi tror att priset kommer att vända upp från den här låga nivån, och kanske gå till 1850 eller till 1900 dollar per ton. Därför gör vi en kortsiktig rekommendation att köpa ALUMINIUM S.
Zink
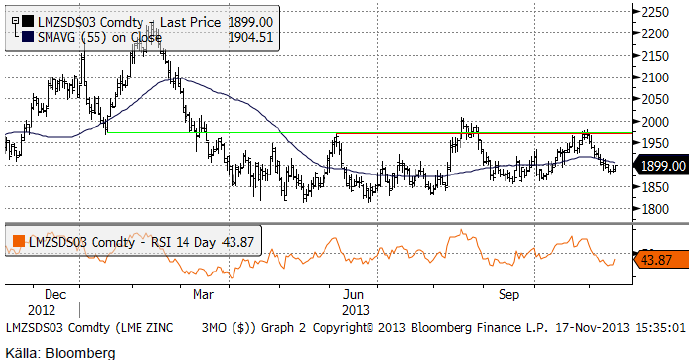
Det finns inte så mycket att rapportera om zink den här veckan. Priset fortsatte förra veckans rekyl nedåt i början av veckan, men köpare kom sedan in och gav stöd. Den försiktiga uppåtgående trenden är inte bruten och vi tycker att man kan passa på att försiktigt köpa mer ZINK S.
Nickel
Vår grundsyn är att man ska försöka köpa nickel, i synnerhet om priset kommer ner mot 13,500 dollar per ton. Som vi ser i prisdiagrammet nedan, är priset nere vid den bottennivå som började etableras under juli och vi tror att det är ett bra köptillfälle nu.
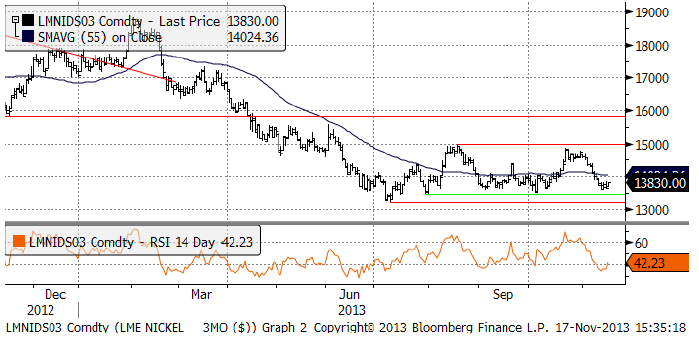
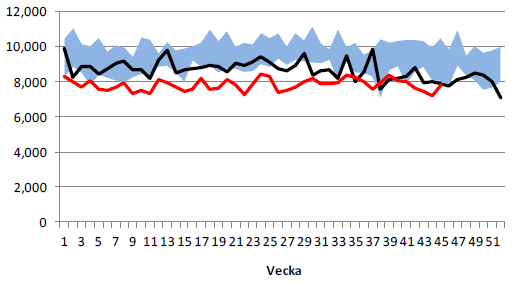
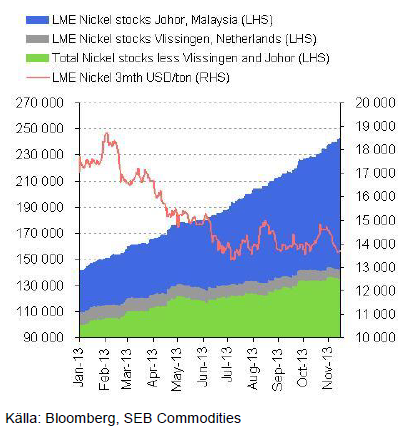
LME-lagren av nickel ökade med 4.7 kt till 245 kt senaste 7 dagarna med en liten nedgång i Nederländerna och ytterligare lagerbyggnad i Malaysia. Contangot har ökat längre ut på terminskurvan. När lagren ökar, skapar det kö för att få ut nickel från lagren längre fram. Nedanför ser vi en bild på LME-lagren och priset på 3-månaders terminskontrakt.
Metal Bulletin Research förutspår att lagren av nickel kommer att fortsätta öka både under 2014 och 2015. Det har inte kommit några nyheter om stängningar av nickelgruvor. Många rubriker om Talvivaara, som måste omstrukturera skulden och reserverna har sjunkit 66 %. Aktieägarna har inte varit villiga att skjuta till mer pengar. Tyfonen som drabbat sydöstra Asien, verkar inte ha förstört nickel produktionen i Filippinerna. Sumitomo meddelade att deras smältverk i Filippinerna producerat sin första nickel och exporterat metallen till Japan.
Vår grundsyn att man bör försöka köpa nickel och rekommenderar köp av NICKEL S. Priset (cash och 3 månaders termin, som vi alltid avser), går att följa på www.basemetals.com
Guld
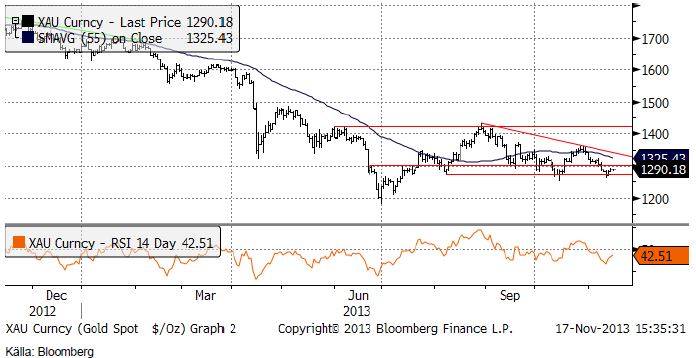
Guldpriset (i dollar) gick i veckan ner och testade det tekniska stödet och steg mot slutet av veckan till 1290 dollar. Trenden är nedåtriktad, men volatiliteten har sjunkit, med allt mindre kursrörelser. Det är ett mönster som ibland förebådar en trendvändning uppåt, men det återstår att se.
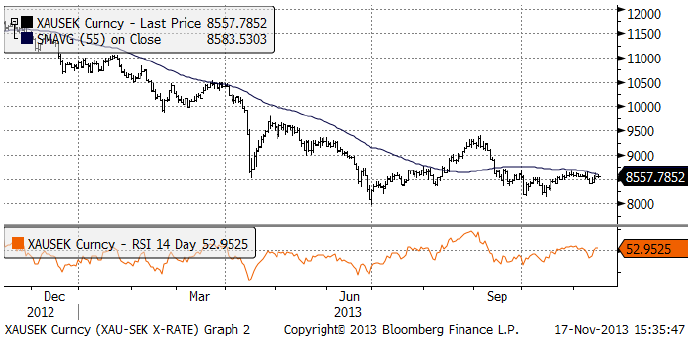
I termer av kronor, har priset hållit sig stabilt, med endast marginella prisrörelser under veckan. Vi ser kursdiagrammet på priset i kronor för ett troy uns nedan. Notera att vi inte har någon teknisk köpsignal, men vi har ett tekniskt stöd vid 8000 kr. Trenden är fortfarande nedåtriktad.
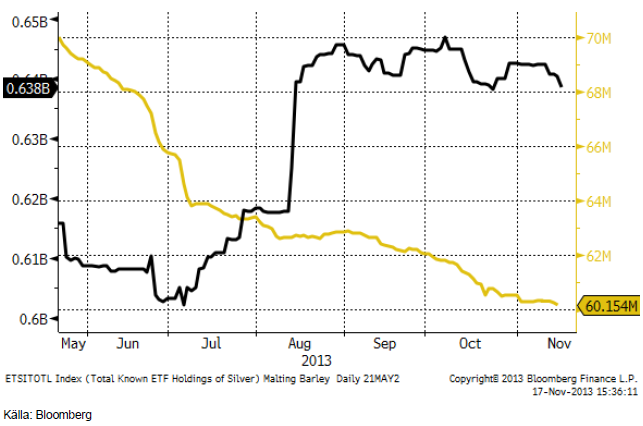
I diagrammet nedan ser vi antalet uns som innehas av börshandlade fonder det senaste halvåret. Den gula kurvan avser guld och den svarta silver. Utflödet ur guldfonder har minskat i november, medan utflödet ur silverfonder ökat.
World Gold Council rapporterade i veckan att efterfrågan på guld under det tredje kvartalet minskat med 21% sedan förra året till 868.5 ton. Det är framförallt utflöden ur börshandlade fonder som ligger bakom. Investeringsefterfrågan har minskat med 56% sedan förra året. Efterfrågan på fysiskt guld har ökat något till 304 ton, medan börshandlade produkter haft ett utflöde på 119 ton. Utbudet av guld har också minskat, trots att gruvproduktionen ökat något. Det är skrotningen (av smycken) som står för minskningen.
I dessa siffror ligger också en viss nyckel till hur en uppgång skulle kunna börja. Fysiskt investeringsguld säljs sällan, eftersom det inte är lika likvitt som börshandlade produkter. Skulle investeringsflödet i börshandlade produkter vända, t ex motiverat av låga eller ännu lägre räntor och en fortsatt expansiv penningpolitik, kan det ge marknaden stöd.
Trots att det finns vissa positiva tecken, tycker vi dock att det är för tidigt och för spekulativt att köpa guld just nu och föredrar att vänta till dess det skett ett trendbrott.
Silver
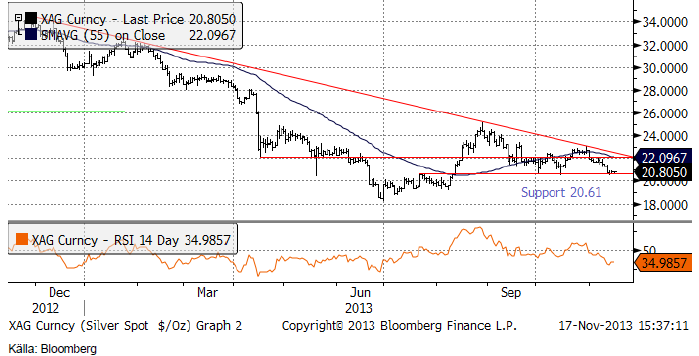
Nedan ser vi kursdiagrammet för silver i dollar per troy ounce. Priset stängde i fredags på 20.8 dollar per uns, strax över det viktiga tekniska stödet på 20.61. Om det stödet bryts, kan priset gå ner mot 18 dollar i första hand. Om priset å andra sidan går över 22 dollar bryts den långsiktiga nedåtgående trenden. Marknaden står och väger just nu.
Vi fortsätter att vara neutrala guld och silver.
Platina & Palladium
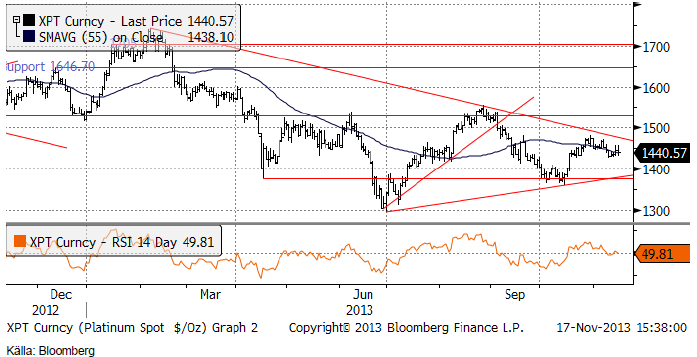
Platinapriset ligger fortfarande under motståndet och kan lika gärna gå ner som upp. Men de lite mer positiva tongångarna från den tillträdande chefen för USA:s centralbank om en fortsatt mjuk penningpolitik, tror vi att det finns mer uppsida. Dessutom är arbetsmarknadskonflikten i Sydafrika snarare på väg att eskalera än att gå mot en snar lösning.
Enligt Johnson Matthey kommer efterfrågan på platina att överstiga utbudet av med den största skillnaden sedan år 1999. Sammanlagt blir underskottet 605 000 ozt, vilket är en ökning av underskottet med 78 % sedan förra året. Johnson Matthey förväntar sig en ingen lösning på problemen i Sydafrika. Impala Platinum har erbjudit en löneökning till sina anställda på 0.5%. Amplats mining skjöt med gummikulor för att skingra demonstranter vid gruvan i veckan. AMCU, den andra fackföreningen som ännu inte gått i strejk, har fått tillstånd av myndigheterna att gå i strejk om det inte sker några framsteg i löneförhandlingarna. Fackföreningen kommer att ha möten de närmaste veckorna för att besluta hur de ska göra. AMCU är den största fackföreningen vid det största platinaföretaget, Anglo American Platinum Ltd.
PwC, den välkända revisionsfirman varnade i veckan att Sydafrikas gruvindustri kan falla i ruiner på grund av höga löner och lagstadgade kostnader.
Strejken vid Northam Platinums gruva i Sydafrika fortsätter. Det är svårt att säga hur mycket platina som fallit bort från utbudet.
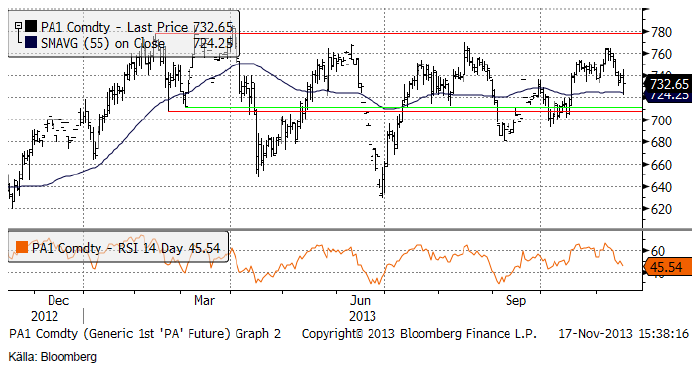
Priset på palladium har backat den senaste veckan, efter att ha kommit för högt upp i det prisintervall som varit rådande det senaste året. Det verkar finnas gott om material på pris över 760 dollar per uns.
Enligt Johnson Matthey blir det ett underskott på 740 000 uns palladium i år, men det är 36 % lägre än underskottet var 2012.
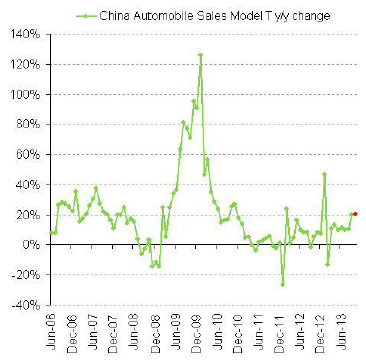
Antalet sålda bilar i Kina i september och oktober låg på en årlig försäljningstakt på 23 miljoner bilar, vilket var mer än väntat. Den årliga ökningstakten är 20 %. Detta har dock ändå inte hindrat att priset på palladium sjunkit med 3% den senaste veckan.
Situationen i Sydafrika tycker vi är så alarmerande att vi väljer att gå över till köprekommendation igen. Däremot behåller vi neutral på palladium.
Kaffe
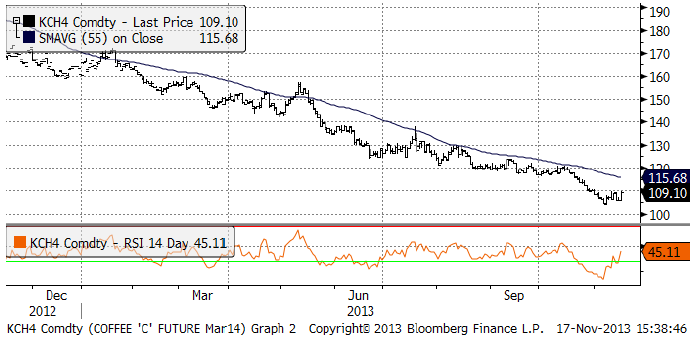
Kaffepriset handlade hela veckan över den tidigare bottennivån strax över 100 cent och stängde veckan på 109 cent. 110 cent har rekylen dock ännu inte lyckats ta sig över.
På en konferens i lördags (16 nov) i Costa Rica, sade BNP Paribas kaffeanalytiker att produktionsöverskottet i år 2013/14, som började den 1 oktober sjunker till 3 miljoner säckar (à 60 Kg) från 4 miljoner säckar under 2012/13. Nästan hela överskottet utgörs av arabica. Konsumtionen av den billigare och enklare och mer lättodlade robustan ökar i tillväxtländerna så att den relativt stora produktionsökningen framförallt i Vietnam sväljs.
I fredags sänkte dock USDA estimatet för Brasiliens skörd av kaffe (huvudsakligen arabica) från 53.7 miljoner säckar till 53.1 miljoner för 2013/14, vilket är 3 miljoner säckar mindre än under 2012/13. Det står i rapporten på USDA:s hemsida att kvaliteten är sämre än förra året.
Kostnaderna väntas stiga från en nivå 2012/13 på 122 cent per pund till 134 cent per pund. Det innebär att priset ligger under en nivå där 50% av kaffeproducenterna i Brasilien gör förlust. Det är naturligtvis en ohållbart låg prisnivå. Den som vill läsa rapporten kan göra det här.
Vi behåller tills vidare neutral rekommendation, tills vi ser tecken på ett trendbrott.
För analyser på övriga jordbruksråvaror se SEB Jordbruksprodukter.
[box]SEB Veckobrev Veckans råvarukommentar är producerat av SEB Merchant Banking och publiceras i samarbete och med tillstånd på Råvarumarknaden.se[/box]
Disclaimer
The information in this document has been compiled by SEB Merchant Banking, a division within Skandinaviska Enskilda Banken AB (publ) (“SEB”).
Opinions contained in this report represent the bank’s present opinion only and are subject to change without notice. All information contained in this report has been compiled in good faith from sources believed to be reliable. However, no representation or warranty, expressed or implied, is made with respect to the completeness or accuracy of its contents and the information is not to be relied upon as authoritative. Anyone considering taking actions based upon the content of this document is urged to base his or her investment decisions upon such investigations as he or she deems necessary. This document is being provided as information only, and no specific actions are being solicited as a result of it; to the extent permitted by law, no liability whatsoever is accepted for any direct or consequential loss arising from use of this document or its contents.
About SEB
SEB is a public company incorporated in Stockholm, Sweden, with limited liability. It is a participant at major Nordic and other European Regulated Markets and Multilateral Trading Facilities (as well as some non-European equivalent markets) for trading in financial instruments, such as markets operated by NASDAQ OMX, NYSE Euronext, London Stock Exchange, Deutsche Börse, Swiss Exchanges, Turquoise and Chi-X. SEB is authorized and regulated by Finansinspektionen in Sweden; it is authorized and subject to limited regulation by the Financial Services Authority for the conduct of designated investment business in the UK, and is subject to the provisions of relevant regulators in all other jurisdictions where SEB conducts operations. SEB Merchant Banking. All rights reserved.

Market is starting to take US/Iran headlines with a pinch of salt. Brent crude rose $2.8/b yesterday to an official close of $112.1/b. But after that it traded as low as $108.05/b before ending late night at around $109.7/b. Through the day it traded in a range of $106.87 – 112.72/b amid a flurry of news or rumors from Iran and the US. ”US temporary sanctions during negotiations” (falls alarm). ”We will bomb Iran” (not anyhow),… etc. While the market is still fluctuating to this kind of news flow, it is starting to take such headlines with a pinch of salt.

We’ll see. Maybe, maybe not. The Brent M1 contract is trading at $110.2/b this morning which very close to the average ticks through yesterday of $110.4/b.
Trump with bearish, verbal intervention whenever Brent trades above $110/b it seems. What seems to be a pattern is that Trump states something like ”very good negotiations going on with Iran”, ”New leaders in Iran are great,..”, ”Great progress in negotiations,…”, ”Deal in sight,..” etc whenever the Brent M1 contract trades above $110/b. An effort to cool the market. These hot air verbal interventions from Trump used to have a heavy bearish impact on prices, but they now seems to have less and less effect unless they are backed by reality.
As far as we can see there has been no real progress in the negotiations between the US and Iran with both sides still standing by their previous demands.
Iran is getting stronger while the cease fire lasts making a return to war for Trump yet harder. Iran is naturally in constant preparation for a return to war given Trump’s steady threats of bombing Iran again. Iran is naturally doing what ever is possible to prepare for a return to war. And every day the cease fire lasts it is better prepared. This naturally makes it more and more difficult and dangerous for the US to return to warring activity versus Iran as the consequences for energy infrastructure in the Persian Gulf will be more and more severe the longer the cease fire lasts. Israel seems to see it this way as well. That the war is not won and that current frozen state of a cease fire gives Iran opportunity to rebuild military and politically.
Global inventories are drawing down day by day. How much? In the meantime the Strait of Hormuz stays closed. There is varying measures and estimates of how much global inventories are drawing down. Our rough estimate, back of the envelope, is that global inventories are drawing down by at least some 10 mb/d or about 300 mb/d in a balance between loss of supply versus demand destruction. Other estimates we see are a monthly draw of 250-270 mb/d. The IEA only ’measured’ a draw in global observable stocks of 117 mb in April with oil on water rising 53 mb while on shore stocks fell 170 mb. But global stocks are hard to measure with large invisible, unmeasured stocks. As such a back of the envelope approach may be better.
Oil products is what the world is consuming. Oil product prices likely to rise while product stocks fall. Strategic Petroleum Reserves (SPR) are predominantly crude oil. Discharging oil from OECD SPR stocks, a sharp reduction in Chinese crude imports and a reduction in global refinery throughput of 6-7 mb/d has helped to keep crude oil markets satisfactorily supplied. But global inventories are drawing down none the less. And oil products is really what the world is consuming. So if global refinery throughput stays subdued, then demand will eventually have to match the supply of oil products. The likely path forward this summer is a steady draw down in jet fuel, diesel and gasoline. Higher prices for these. Then, if possible, higher refinery throughput and higher usage of crude in response to very profitable refinery margins. And lastly sharper draw in crude stocks and higher prices for these. But some 6 mb/d of oil products used to be exported through the Strait of Hormuz. And it may not be so easy to ramp up refinery activity across the world to compensate. Especially as Ukraine continues to damage Russian refineries as well as Russian crude production and export facilities.
Watch oil product stocks and prices as well as Brent calendar 2027. What to watch for this summer is thus oil product inventories falling and oil product premiums to crude rising. Another measure to watch is the Brent crude 2027 contract as it rises steadily day by day as the Strait of Hormuz stays closed and global oil inventories decline. The latter is close to the highest level since the start of the war and keeps rising.
The Brent M1 contract and the Brent 2027 prices and current price of jet fuel in Europe (ARA). All in USD/b

Our back of the envelope calculation of the global shortage created by the closure of the Strait of Hormuz. Note that 3.5 mb/d of discharge from SPR is also a draw. Note also that ’Forced demand loss’ of 2.5 mb/d is probably temporary and will fall back towards zero as logistics are sorted out leaving ’Price demand loss’ to do the job of balancing the market. Thus a shortfall of at least 9 mb/d created by the closure. More if SPR discharge is included and more if Forced demand loss recedes.

Brent is climbing higher. Front-month is at USD 106.3/bl this morning, close to a weekly high and a USD 9/bl jump from Mondays open. This is the move we flagged as a risk earlier in the week: the market shifting from ”a deal is around the corner” to ”this is going to take longer than we thought”.

Analyst Commodities, SEB
During April, rest-of-year Brent remained remarkably stable around USD 90/bl. A stability which rested on one single assumption: the SoH reopens around 1 May. That assumption is now slowly falling apart.
As we highlighted yesterday: every week of delay beyond 1 May adds (theoretically) ish USD 5/bl to the rest-of-year average, as global inventories draw 100 million barrels per week. i.e., a mid-May reopening implies rest-of-year Brent closer to USD 100/bl, and anything pushing into June or July takes us meaningfully higher.
What’s changed in the last 48 hours:
#1: The US military has formally warned that clearing suspected sea mines from SoH could take up to six months. That is a completely different timescale from what the financial market is pricing. Even a political deal tomorrow does not immediately reopen the strait.
#2: Trump has shifted his tone from urgency to ”strategic patience”. In yesterday’s press conference: ”Don’t rush me… I want a great deal.” The market is reading this as a president no longer feeling pressured by timelines, with the naval blockade running in the background.
#3: So far, the military activity is escalating, not de-escalating. Axios reports Iran is laying more mines in SoH. The US 3rd carrier strike group (USS George H.W. Bush) is arriving with two countermine vessels. Trump yesterday ordered the US Navy to destroy any Iranian boats caught laying mines. While CNN reports that the Pentagon is actively drawing up plans to strike Iranian SoH capabilities and individual Iranian military leaders if the ceasefire collapses. i.e., NOT a attitude consistent with an imminent deal!
Spot crude and product prices eased off the early-April highs on a combination of system rerouting and deal optimism. Both now weakening. Goldman estimates April Gulf output is reduced by 14.5 mbl/d, or 57% of pre-war supply, a number that keeps getting worse the longer this drags on.
Demand-side adaptation is ongoing: S. Korea has cut its Middle East crude dependence from 69% to 56% by pulling more from the Americas and Africa, and Japan is kicking off a second round of SPR releases from 1 May. But SPRs are finite.
Ref. to the negotiations, we should not bet on speed. The current Iranian leadership is dominated by genuine hardliners willing to absorb economic pain and run the clock to extract concessions. That is not a setup for a rapid resolution. US/Israeli media briefings keep framing the delay as ”internal Iranian divisions”, the reality is more complicated and points toward weeks and months, not days.
Our point is that the complexity is large, and higher prices have only just started (given a scenario where the negotiations drag out in time). The market spent April leaning on the USD 90/bl rest-of-year assumption; that case is diminishing by the hour. If ”early May reopening” is replaced by ”June, July or later” over the next week or two, both crude and products have meaningful room to reprice higher from here. There is a high risk being short energy and betting on any immediate political resolution(!).
Down on Friday. Up on Monday. The Brent June crude oil contract traded down 5.1% last week to a close of $90.38/b. It reached a high of $103.87/b last Monday and a low of $86.09/b on Friday as Iran announced that the Strait of Hormuz was fully open for transit. That quickly changed over the weekend as the US upheld its blockade of Iranian oil exports while Iran naturally responded by closing the SoH again. The US blew a hole in the engine room of the Iranian ship TOUSKA and took custody of the ship on Sunday. Brent crude is up 5.6% this morning to $95.4/b.
The cease-fire is expiring tomorrow. The US has said it will send a delegation for a second round of negotiations in Islamabad in Pakistan. But Iran has for now rejected a second round of talks as it views US demands as unrealistic and excessive while the US is also blocking the Strait of Hormuz.
While Brent is up 5% this morning, the financial market is still very optimistic that progress will be made. That talks will continue and that the SoH will fully open by the start of May which is consistent with a rest-of-year average Brent crude oil price of around $90/b with the market now trading that balance at around $88/b.
Financial optimism vs. physical deterioration. We have a divergence where the financial market is trading negotiations, improvements and resolution while at the same time the physical market is deteriorating day by day. Physical oil flows remain constrained by disrupted flows, longer voyage times and elevated freight and insurance costs.
Financial markets are betting that a US/Iranian resolution will save us in time from violent shortages down the road. But every day that the SoH remains closed is bringing us closer to a potentially very painful point of shortages and much higher prices.
The US blockade is also a weapon of leverage against its European and Asian allies. When Iran closed the SoH it held the world economy as a hostage against the US. The US blockade of the SoH is of course blocking Iranian oil exports. But it is also an action of disruption directed towards Europe and Asia. The US has called for the rest of the world to engaged in the war with Iran: ”If you want oil from the Persian Gulf, then go and get it”. A risk is that the US plays brinkmanship with the global oil market directed towards its European and Asian allies and maybe even towards China to force them to engage and take part. Maybe unthinkable. But unthinkable has become the norm with Trump in the White House.


Sommarväder skapar prisrally på elbörsen
Oil product price pain is set to rise as the Strait of Hormuz stays closed into summer

Solkraften pressar elpriserna dagtid

Michel Gubel ger sin syn på oljemarknaden