

Analys
SEB – Råvarukommentarer, 17 mars 2014

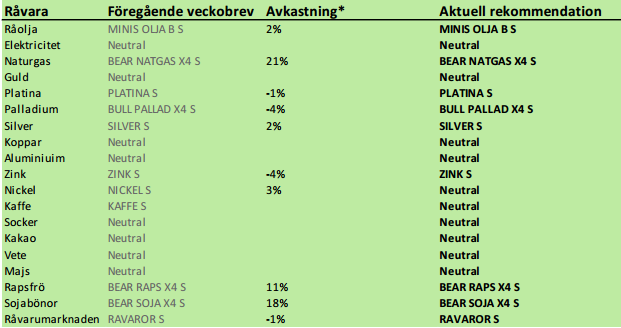
Rekommendationer
Kort sammanfattning
Råvarumarknaderna var relativt stökiga förra veckan. Koppar inledde veckan med att falla kraftigt, liksom zink. Vetepriset i USA steg med 6%, men backade med 2% i Europa. I Europa, som var soligt och varmt, men nederbördsrikt i svensk/norska fjällen, föll elpriset kraftigt och noterade en ny kontraktslägsta för det tredje kvartalet. Globalt odlingsväder har slagit om från torrt i Syd- och Nordamerika till ordentligt vått och ”rain makes grain”. Sockerpriset föll mot slutet av förra veckan och kaffepriset ser ut att vilja hänga på.
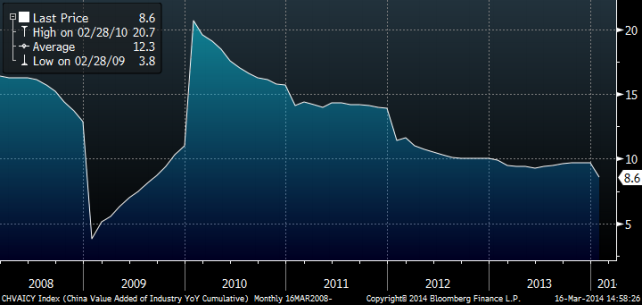
Kinas industriproduktion föll till 8.6% i årstakt i februari enligt statisktik som publicerades i torsdags. Det är ännu en bekräftelse på att landets ekonomi har problem och därmed har de flesta råvarumarknader problem. I diagrammet nedan ser vi förändringen i industriproduktion i Kina på årstakt sedan 2008.
Mot slutet av veckan kom nyheten att Kinas centralbank vidgar intervallet för den kinesiska valutan. Vi tolkar det som en önskan om svagare valuta och alltså en devalvering. Därmed sällar sig Kina till alla länder som vill devalvera sina valutor, dvs öka penningmängden. Det är positivt för ädelmetallerna.
Råolja – Brent
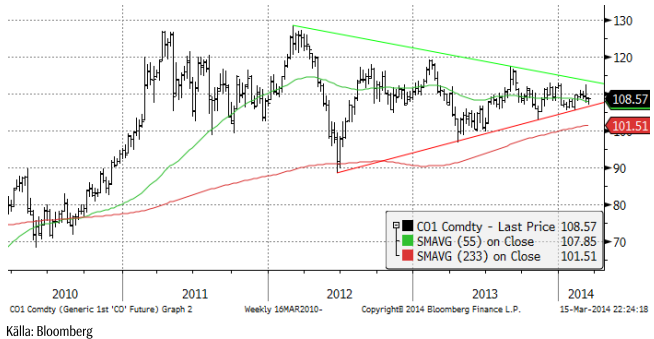
Oljepriset sjönk under lugn handel i veckan från 109 till 108.57 dollar per fat. Vi tror att det är lugnet före stormen, när oljepriset bryter stödet i den stora triangelformation som marknaden handlar inom.
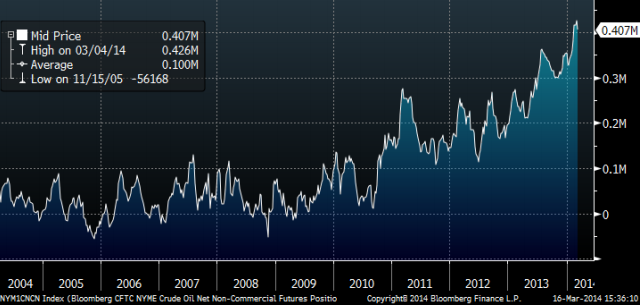
Non-commercials (investerare) är rekordköpta terminskontrakt på NYMEX i New York, enligt CFTC:s rapport i fredags. De äger terminskontrakt för 407 miljoner fat olja. År 2010 var de nästan inte köpta olja alls. Tänk om sentimentet ändrar sig!!!
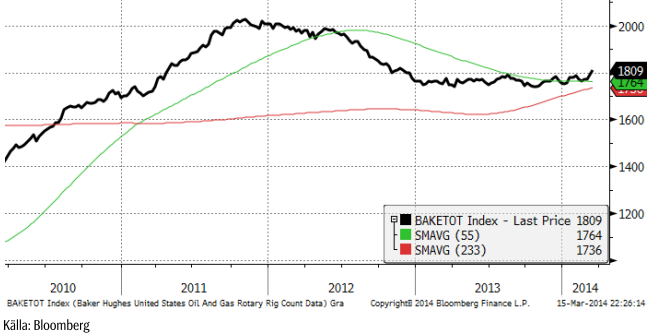
Antalet borr-riggar i USA steg i veckan till 1809 (förra veckan 1792) stycken enligt Baker Hughes. Det är återigen en ökning och bekräftar den trend vi skrev om förra veckan. Skifferboomen i USA har fått ny fart och kommer att resultera i en ännu högre produktionsökning i USA.
Årets lägsta oljepris brukar noteras i april. Förra året var det 97 dollar. I år är marknaden väsentligt svagare. Därför tror vi att priset kommer att gå ännu längre ner, kanske till 95 dollar.
Vi rekommenderar en kort position i olja, t ex med MINIS OLJA B S eller MINIS OLJA A S.
Elektricitet
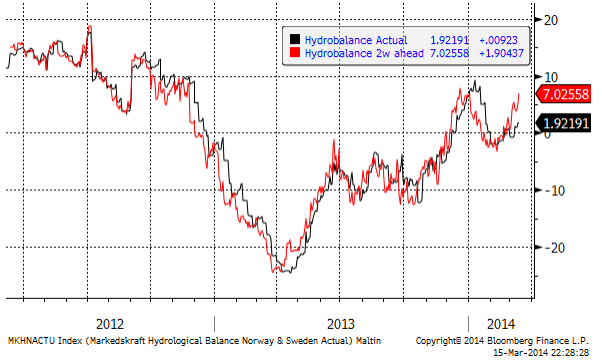
Kvartal tre fortsatte falla, och nådde nästan ner till 24 euro per MWh. Varmt väder, en prognos om rikligt med nederbörd över svensk/norska fjälltrakten och ett prisfall på 7% i utsläppsrätterna bidrog till prisfallet.
2 veckors prognos för hydrologisk balans har stigit till +7 TWh (förra veckan +5 TWh).
Priset på kol är det enda som visar styrka just nu. EU importerar kol från Ryssland och det kan vara det som påverkar priset, liksom det kan ha gjort för palladium och nickel. 80 dollar är en viktig stödnivå och det är viktigt att den inte bryts.
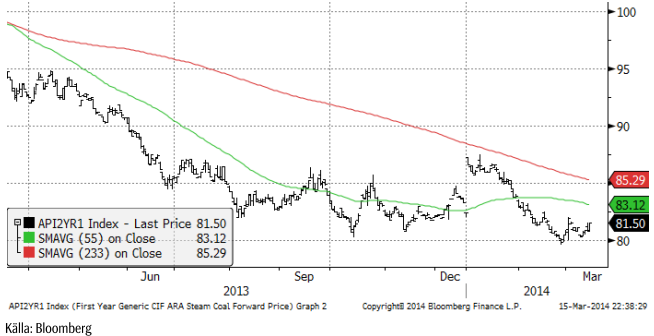
Vi fortsätter med neutral rekommendation. Trenden är tydligt nedåtriktad, men priset är mycket lågt och söker en botten.
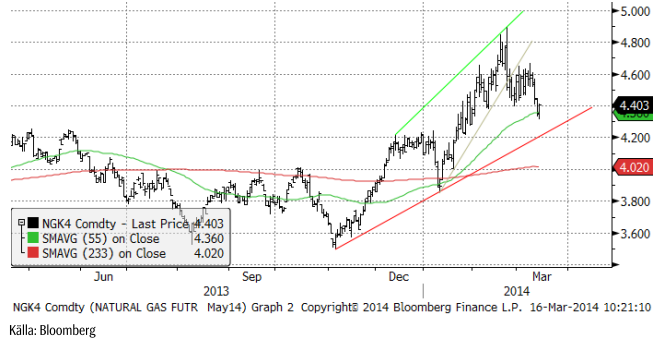
Naturgas
Förra veckan rekommenderade vi köp av BEAR NATGAS X4 S mot bakgrund av att priset stigit en längre tid på det kalla vädret i USA och att varmt väder nu ”borde” komma in i prognosfönstret. Samtidigt såg vi att antalet borr-riggar återigen ökar tydligt och de flesta av dem producerar gas. Japan drar igång sina kärnkraftverk nu och slutar därmed att importera LNG. Det har talats om, bland annat i en annons i New York Times i fredags som en privatperson (!) satt in med anledning av krisen i Ukraina, att EU skulle importera LNG från USA. Om det sker, som en del i det ”paket” som EU och USA ställer upp mot Ryssland efter söndagens ”val” i södra Ukraina, kan det verka stödjande på priset, men annars bör priset i första hand falla ner mot 4.30 – 4.20 dollar per MMBtu. Vi fortsätter med säljrekommendation och behåller BEAR NATGAS X4 S.
Koppar
Den väsentligt svagare industrikonjunkturen i Kina oroar. Priset på koppar har rasat med 13% hittills i år till den lägsta nivån sedan sommaren 2010. I ett tidigare veckobrev för någon tid sedan visade vi produktionskostnaden för Codelco, som är världens ledande producent av koppar. Den låg då ca 10% under priset och det senaste prisfallet bör alltså nu innebära att Codelco inte går runt. Det innebär att utbudet av koppar från nya gruvor kommer att minska på lite längre sikt, men på kort sikt kan priset gå under produktionskostnaden.
Värt att notera är dock att lagren vid LME fortfarande inte visar några tecken på att stiga utan fortsätter att falla.
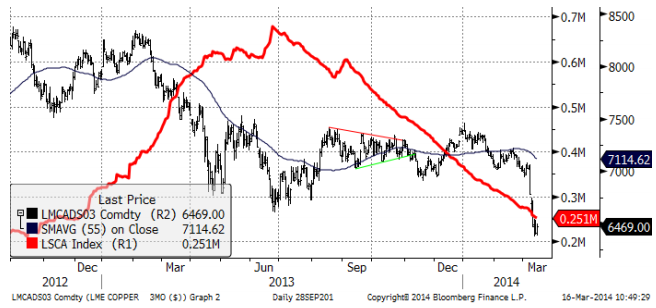
Vi rekommenderar neutral position i koppar.
Aluminium
Aluminiumpriset påverkades av svagheten i kopparmarknaden, men tycks än så länge ha det mest mesta bakom sig.
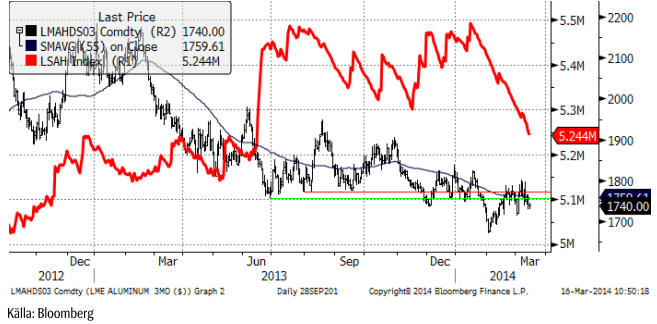
Vi fortsätter med neutral rekommendation på aluminium.
Zink
Zinkrpriset har fallit hela vägen tillbaka från toppen vid 2150. Priset är nu vid ett tekniskt stödområde och vi tror att det är ett bra tillfälle att köpa zink vid.
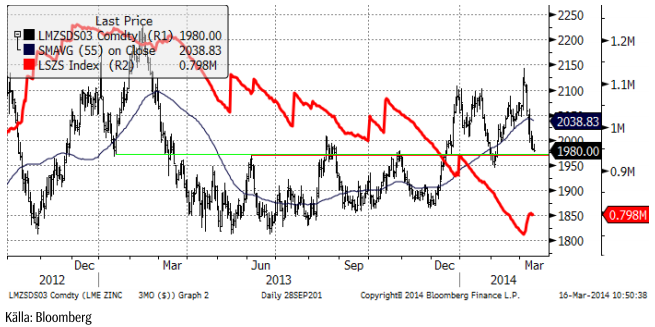
Vi rekommenderar köp av ZINK S eller BULL ZINK X4 S.
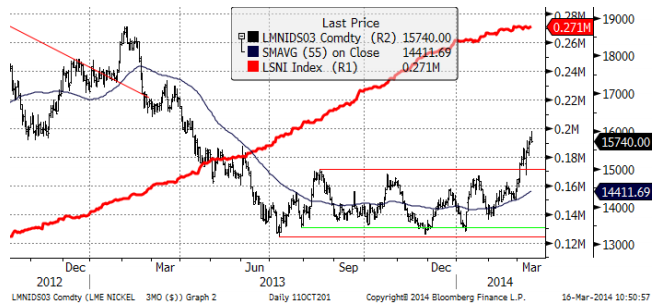
Nickel
Nickel har till skillnad från de andra basmetallerna stigit i veckan. Som vi skrivit tidigare gynnas nickelpriset av oron för Rysslands/Ukraina-krisen. Priset har dock kommit upp till 16,000 dollar och det är en motståndsnivå, där t ex marknaden fann en botten i slutet av år 2012. Vi rekommenderar därför att man går ur långa positioner nu och lägger sig neutral.
Guld
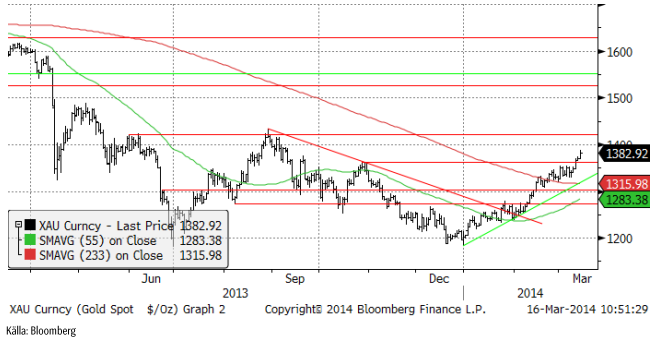
I takt med att tillväxten tvekar såväl i Kina som i USA leder det till ökade förväntningar på monetär stimulans i Kina och mindre avtrappning av den monetära stimulansen i USA. Sådana uttalanden har också kommit från FED, bland annat att takten på ”tapering” kan diskuteras. Konflikten mellan Ryssland och Ukraina och EU:s och USA:s kostnader för att handskas med detta bidrar också till att ge stöd till guldpriset. Oron för en extrem upptrappning av konflikten, även om den har liten sannolikhet påverkar också guldpriset positivt. Guldpriset är känsligt för ändringar i sannolikheten för extrema händelser av den karaktären.
Med det sagt, börjar ändå guldpriset nå upp till tekniska motstånd. Den första passerades utan större bekymmer i veckan, men den andra vid strax över 1400 dollar kan bli svårare.
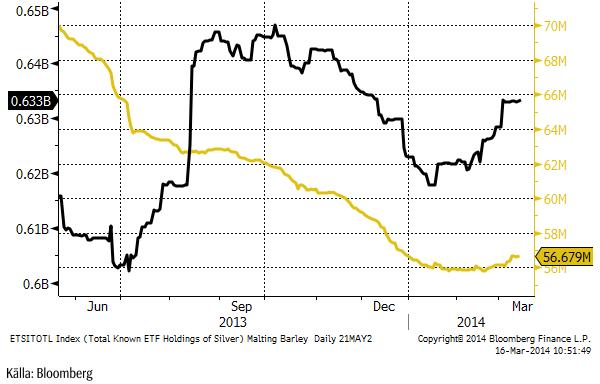
Nu har institutionella placerare börjat köpa guldfonder igen! Den gula kurvan visar antal miljoner uns som ägs via börshandlade fonder/certifikat/depåbevis. Innehaven i silver, den svarta kurvan, har ökat kraftigt sedan början av året, men förblivit oförändrad den senaste tiden.
Vi fortsätter tills vidare med neutral vy på guld. Vi skulle vilja köpa om det kommer en rekyl.
Silver
Silverpriset steg även det lite grand i veckan men befinner sig alltjämt mellan 20.50 och 22. Ett brott på uppsidan av 22 ger en teknisk köpsignal om den skulle inträffa. Det finns just nu ingen trend i silverpriset.
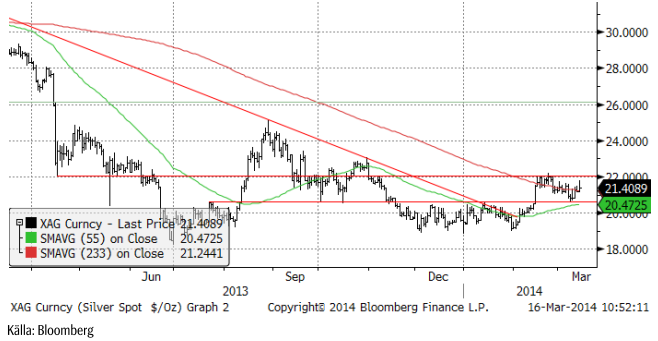
Nedan ser vi guldpriset angivet i silver (istället för dollar). Vi ser att guld är relativt dyrt i förhållande till silver, såväl i det korta perspektivet som i det långa. Vi föredrar därför att köpa silver, hellre än guld, men silverpriset ligger, som vi nämnde, fast under ett tekniskt motstånd på 22 dollar.
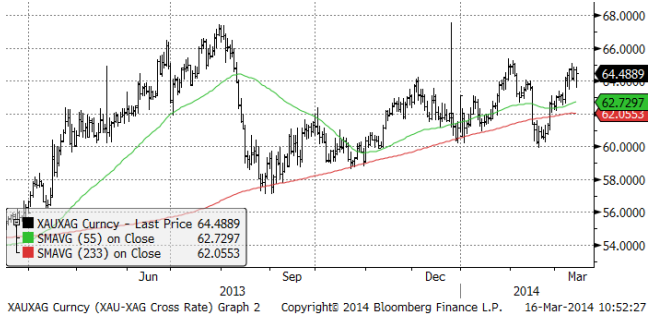
Vi anser att silver är mer köpvärt än guld och skulle vilja köpa på de här nivåerna, i synnerhet efter den rekyl som inträffat de senaste veckorna.
Platina & Palladium
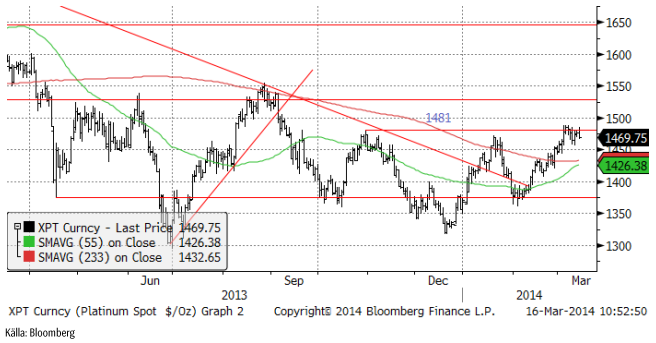
Platina har problem att gå över det tekniska motståndet på 1481 dollar. Den senaste utvecklingen antyder att det finns en risk för en rekyl nedåt.
Palladiumpriset tog en paus efter utbrottet förra veckan. Det är ett vanligt marknadsbeteende och man kan dessutom då och då se en rekyl ner tillbaka till utbrottsnivån. Vi tror att palladiumpriset kan stå inför en större prisrörelse uppåt och väntar oss att se bekräftelser på det först genom att passera 785 dollar som var toppnoteringen under 2013.
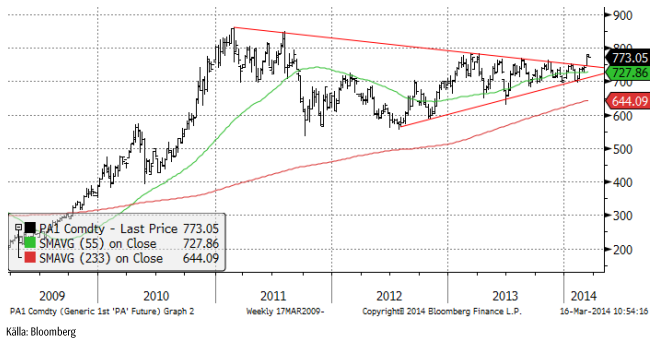
Vi rekommenderar alltså en neutral position i platina och en köpt position i palladium.
Kaffe
Torkan i Brasilien är av allt att döma slut. Det har regnat i veckan som gått. Prognosen från GFS-modellen för de kommande två veckorna visar onormalt mycket nederbörd över Minas Gerais. Allra mest väntas falla över den södra delen, där kaffeproduktionen är som mest intensiv.
Tekniskt noterar vi att priset har brutit stödet för den allra mest intensiva uppgången, vilket signalerar en förestående rekyl. Tekniskt stöd finns i första hand på ca 180 cent.
Vi rekommenderar neutral position i kaffe, eller möjligtvis en mycket kortsiktig kort position.
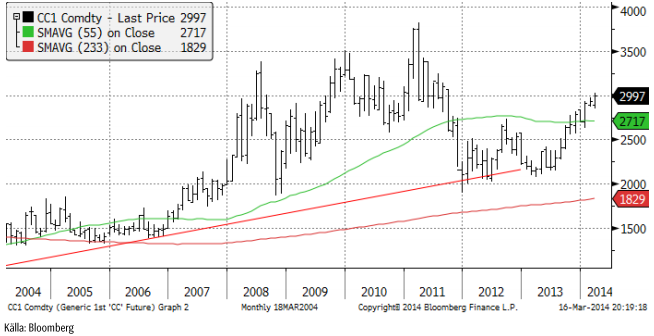
Kakao
Priset på kakao i New York har gått upp från 2709 dollar per ton till 2997 sedan årsskiftet, alltså plus 10%. Uppgången är framförallt driven av en stark efterfrågan. Som vi ser i diagrammet nedan är priset på kakao återigen uppe vid 3000 dollar per ton, som är den nivå som priserna pendlade kring vid slutet av 00-talets råvaruboom åren 2009 – 2011. Det är möjligt att priset kan gå högre, men uppgångens momentum bör mattas av på de nuvarande höga nivåerna.
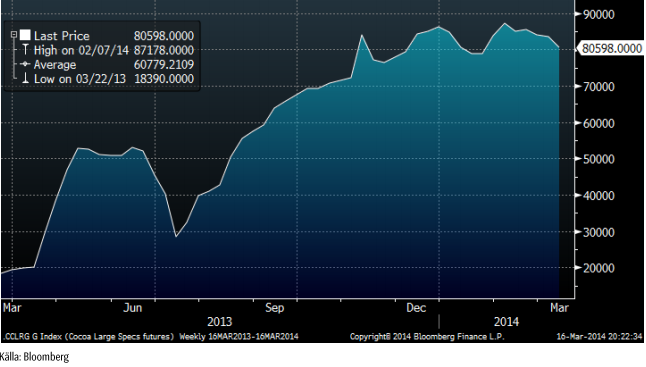
Kakaoterminsmarknaden präglas av en stor kort position i producentledet. Enligt fredagens Commitment of Traders – rapport från CFTC, som visar läget per i tisdags, var producenter korta över 90,000 kontrakt i det amerikanska kontraktet på kakao. Investerare var köpta 80,598 kontrakt. Investerarkategorin har börjat minska sin köpta position, som vi ser i diagrammet nedan. Alla tester visar att kausaliteten går från prisrörelse till agerande hos investerare och inte tvärt om, men bilden visar i vart fall att det positiva sentimentet hos aktörer som inte enbart är ute efter att bli av med risk, utan på att försöka förutspå prisutvecklingen, har blivit lite mindre positivt (även om de fortfarande är mycket positiva).
Kakaoterminerna på LIFFE i London handlas normalt sett högre än terminerna på NYBOT i New York. I diagrammet nedan har vi kvoten mellan London-kakao och New York-kakao, omräknat till brittiska pund per ton. Det är spotkontraktet vi ser.
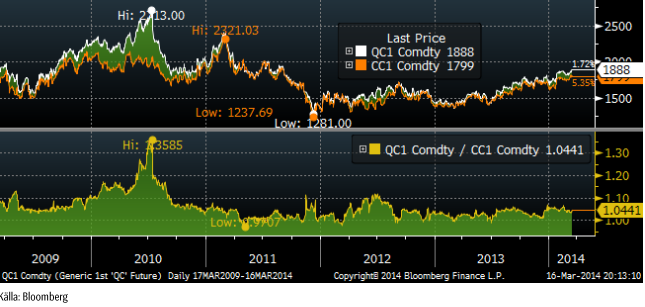
Öppen balans är ungefär lika stor för både LIFFE och NYBOT, men NYBOT har nästan hela sin handel frontmånadskontraktet, vilket återspeglar positioner från indexfonder, som har valt det kontraktet och inte London-kontraktet. Londonkontraktet har en mer spridd handel och används av företag i Europa för prissäkring. Vi ser också att det råder contango i NYBOT-kontraktet för korta löptider (kanske pga long-only-indexfonder) medan det är backwardation i London-kontraktet. Även kakao följer alltså samma mönster som t ex vete, där det råder contango i USA, men backwardation i Europa.
Vi rekommenderar en neutral position vid dagens situation.
[box]SEB Veckobrev Veckans råvarukommentar är producerat av SEB Merchant Banking och publiceras i samarbete och med tillstånd på Råvarumarknaden.se[/box]
Disclaimer
The information in this document has been compiled by SEB Merchant Banking, a division within Skandinaviska Enskilda Banken AB (publ) (“SEB”).
Opinions contained in this report represent the bank’s present opinion only and are subject to change without notice. All information contained in this report has been compiled in good faith from sources believed to be reliable. However, no representation or warranty, expressed or implied, is made with respect to the completeness or accuracy of its contents and the information is not to be relied upon as authoritative. Anyone considering taking actions based upon the content of this document is urged to base his or her investment decisions upon such investigations as he or she deems necessary. This document is being provided as information only, and no specific actions are being solicited as a result of it; to the extent permitted by law, no liability whatsoever is accepted for any direct or consequential loss arising from use of this document or its contents.
About SEB
SEB is a public company incorporated in Stockholm, Sweden, with limited liability. It is a participant at major Nordic and other European Regulated Markets and Multilateral Trading Facilities (as well as some non-European equivalent markets) for trading in financial instruments, such as markets operated by NASDAQ OMX, NYSE Euronext, London Stock Exchange, Deutsche Börse, Swiss Exchanges, Turquoise and Chi-X. SEB is authorized and regulated by Finansinspektionen in Sweden; it is authorized and subject to limited regulation by the Financial Services Authority for the conduct of designated investment business in the UK, and is subject to the provisions of relevant regulators in all other jurisdictions where SEB conducts operations. SEB Merchant Banking. All rights reserved.

When it starts to move lower it moves rather quickly. Gaza, China, IEA. Brent crude is down 2.1% today to $62/b after having traded as high as $66.58/b last Thursday and above $70/b in late September. The sell-off follows the truce/peace in Gaze, a flareup in US-China trade and yet another bearish oil outlook from the IEA.

A lasting peace in Gaze could drive crude oil at sea to onshore stocks. A lasting peace in Gaza would probably calm down the Houthis and thus allow more normal shipments of crude oil to sail through the Suez Canal, the Red Sea and out through the Bab-el-Mandeb Strait. Crude oil at sea has risen from 48 mb in April to now 91 mb versus a pre-Covid normal of about 50-60 mb. The rise to 91 mb is probably the result of crude sailing around Africa to be shot to pieces by the Houthis. If sailings were to normalize through the Suez Canal, then it could free up some 40 mb in transit at sea moving onshore into stocks.
The US-China trade conflict is of course bearish for demand if it continues.
Bearish IEA yet again. Getting closer to 2026. Credibility rises. We expect OPEC to cut end of 2025. The bearish monthly report from the IEA is what it is, but the closer we get to 2026, the more likely the IEA is of being ball-park right in its outlook. In its monthly report today the IEA estimates that the need for crude oil from OPEC in 2026 will be 25.4 mb/d versus production by the group in September of 29.1 mb/d. The group thus needs to do some serious cutting at the end of 2025 if it wants to keep the market balanced and avoid inventories from skyrocketing. Given that IEA is correct that is. We do however expect OPEC to implement cuts to avoid a large increase in inventories in Q1-26. The group will probably revert to cuts either at its early December meeting when they discuss production for January or in early January when they discuss production for February. The oil price will likely head yet lower until the group reverts to cuts.
Dubai: The Mid-East anchor dragging crude oil lower. Surplus emerging in Mid-East pricing. Crude oil prices held surprisingly strong all through the summer. A sign and a key source of that strength came from the strength in the front-end backwardation of the Dubai crude oil curve. It held out strong from mid-June and all until late September with an average 1-3mth time-spread premium of $1.8/b from mid-June to end of September. The 1-3mth time-spreads for Brent and WTI however were in steady deterioration from late June while their flat prices probably were held up by the strength coming from the Persian Gulf. Then in late September the strength in the Dubai curve suddenly collapsed. Since the start of October it has been weaker than both the Brent and the WTI curves. The Dubai 1-3mth time-spread now only stands at $0.25/b. The Middle East is now exporting more as it is producing more and also consuming less following elevated summer crude burn for power (Aircon) etc.
The only bear-element missing is a sudden and solid rise in OECD stocks. The only thing that is missing for the bear-case everyone have been waiting for is a solid, visible rise in OECD stocks in general and US oil stocks specifically. So watch out for US API indications tomorrow and official US oil inventories on Thursday.
No sign of any kind of fire-sale of oil from Saudi Arabia yet. To what we can see, Saudi Arabia is not at all struggling to sell its oil. It only lowered its Official Selling Prices (OSPs) to Asia marginally for November. A surplus market + Saudi determination to sell its oil to the market would normally lead to a sharp lowering of Saudi OSPs to Asia. Not yet at least and not for November.
The 5yr contract close to fixed at $68/b. Of importance with respect to how far down oil can/will go. When the oil market moves into a surplus then the spot price starts to trade in a large discount to the 5yr contract. Typically $10-15/b below the 5yr contract on average in bear-years (2009, 2015, 2016, 2020). But the 5yr contract is usually pulled lower as well thus making this approach a moving target. But the 5yr contract price has now been rock solidly been pegged to $68/b since 2022. And in the 2022 bull-year (Brent spot average $99/b), the 5yr contract only went to $72/b on average. If we assume that the same goes for the downside and that 2026 is a bear-year then the 5yr goes to $64/b while the spot is trading at a $10-15/b discount to that. That would imply an average spot price next year of $49-54/b. But that is if OPEC doesn’t revert to cuts and instead keeps production flowing. We think OPEC(+) will trim/cut production as needed into 2026 to prevent a huge build-up in global oil stocks and a crash in prices. But for now we are still heading lower. Into the $50ies/b.
Some rebound but not much. Brent crude rebounded 1.5% yesterday to $65.47/b. This morning it is inching 0.2% up to $65.6/b. The lowest close last week was on Thursday at $64.11/b.
The curve structure is almost as week as it was before the weekend. The rebound we now have gotten post the message from OPEC+ over the weekend is to a large degree a rebound along the curve rather than much strengthening at the front-end of the curve. That part of the curve structure is almost as weak as it was last Thursday.
We are still on a weakening path. The message from OPEC+ over the weekend was we are still on a weakening path with rising supply from the group. It is just not as rapidly weakening as was feared ahead of the weekend when a quota hike of 500 kb/d/mth for November was discussed.
The Brent curve is on its way to full contango with Brent dipping into the $50ies/b. Thus the ongoing weakening we have had in the crude curve since the start of the year, and especially since early June, will continue until the Brent crude oil forward curve is in full contango along with visibly rising US and OECD oil inventories. The front-month Brent contract will then flip down towards the $60/b-line and below into the $50ies/b.
At what point will OPEC+ turn to cuts? The big question then becomes: When will OPEC+ turn around to make some cuts? At what (price) point will they choose to stabilize the market? Because for sure they will. Higher oil inventories, some more shedding of drilling rigs in US shale and Brent into the 50ies somewhere is probably where the group will step in.
There is nothing we have seen from the group so far which indicates that they will close their eyes, let the world drown in oil and the oil price crash to $40/b or below.
The message from OPEC+ is also about balance and stability. The world won’t drown in oil in 2026. The message from the group as far as we manage to interpret it is twofold: 1) Taking back market share which requires a lower price for non-OPEC+ to back off a bit, and 2) Oil market stability and balance. It is not just about 1. Thus fretting about how we are all going to drown in oil in 2026 is totally off the mark by just focusing on point 1.
When to buy cal 2026? Before Christmas when Brent hits $55/b and before OPEC+ holds its last meeting of the year which is likely to be in early December.
Brent crude oil prices have rebounded a bit along the forward curve. Not much strengthening in the structure of the curve. The front-end backwardation is not much stronger today than on its weakest level so far this year which was on Thursday last week.

The front-end backwardation fell to its weakest level so far this year on Thursday last week. A slight pickup yesterday and today, but still very close to the weakest year to date. More oil from OPEC+ in the coming months and softer demand and rising inventories. We are heading for yet softer levels.

Down to the lowest since early May. Brent crude has fallen sharply the latest four days. It closed at USD 64.11/b yesterday which is the lowest since early May. It is staging a 1.3% rebound this morning along with gains in both equities and industrial metals with an added touch of support from a softer USD on top.
What stands out the most to us this week is the collapse in the Dubai one to three months time-spread.
Dubai is medium sour crude. OPEC+ is in general medium sour crude production. Asian refineries are predominantly designed to process medium sour crude. So Dubai is the real measure of the balance between OPEC+ holding back or not versus Asian oil demand for consumption and stock building.
A sharp weakening of the front-end of the Dubai curve. The front-end of the Dubai crude curve has been holding out very solidly throughout this summer while the front-end of the Brent and WTI curves have been steadily softening. But the strength in the Dubai curve in our view was carrying the crude oil market in general. A source of strength in the crude oil market. The core of the strength.
The now finally sharp decline of the front-end of the Dubai crude curve is thus a strong shift. Weakness in the Dubai crude marker is weakness in the core of the oil market. The core which has helped to hold the oil market elevated.
Facts supports the weakening. Add in facts of Iraq lifting production from Kurdistan through Turkey. Saudi Arabia lifting production to 10 mb/d in September (normal production level) and lifting exports as well as domestic demand for oil for power for air con is fading along with summer heat. Add also in counter seasonal rise in US crude and product stocks last week. US oil stocks usually decline by 1.3 mb/week this time of year. Last week they instead rose 6.4 mb/week (+7.2 mb if including SPR). Total US commercial oil stocks are now only 2.1 mb below the 2015-19 seasonal average. US oil stocks normally decline from now to Christmas. If they instead continue to rise, then it will be strongly counter seasonal rise and will create a very strong bearish pressure on oil prices.
Will OPEC+ lift its voluntary quotas by zero, 137 kb/d, 500 kb/d or 1.5 mb/d? On Sunday of course OPEC+ will decide on how much to unwind of the remaining 1.5 mb/d of voluntary quotas for November. Will it be 137 kb/d yet again as for October? Will it be 500 kb/d as was talked about earlier this week? Or will it be a full unwind in one go of 1.5 mb/d? We think most likely now it will be at least 500 kb/d and possibly a full unwind. We discussed this in a not earlier this week: ”500 kb/d of voluntary quotas in October. But a full unwind of 1.5 mb/d”
The strength in the front-end of the Dubai curve held out through summer while Brent and WTI curve structures weakened steadily. That core strength helped to keep flat crude oil prices elevated close to the 70-line. Now also the Dubai curve has given in.

Brent crude oil forward curves

Total US commercial stocks now close to normal. Counter seasonal rise last week. Rest of year?

Total US crude and product stocks on a steady trend higher.


Guld och silver stiger hela tiden mot nya höjder
The Mid-East anchor dragging crude oil lower

Samtal om sällsynta jordartsmetaller, guld och silver

Brookfield köper bränsleceller för 5 miljarder USD av Bloom Energy för att driva AI-datacenter

Teck Resources kan förse Nordamerika och kanske hela G7 med all germanium som behövs

Tyskland har så höga elpriser att företag inte har råd att använda elektricitet

OPEC+ missar produktionsmål, stöder oljepriserna

Ett samtal om guld, olja, fjärrvärme och förnybar energi
Brent crude ticks higher on tension, but market structure stays soft

Guld nära 4000 USD och silver 50 USD, därför kan de fortsätta stiga
-
Nyheter4 veckor sedan
Tyskland har så höga elpriser att företag inte har råd att använda elektricitet
-
 Nyheter3 veckor sedan
OPEC+ missar produktionsmål, stöder oljepriserna
-
 Nyheter3 veckor sedan
Ett samtal om guld, olja, fjärrvärme och förnybar energi
-
Analys4 veckor sedan
Brent crude ticks higher on tension, but market structure stays soft
-
 Nyheter2 veckor sedan
Guld nära 4000 USD och silver 50 USD, därför kan de fortsätta stiga
-
Analys3 veckor sedan
Are Ukraine’s attacks on Russian energy infrastructure working?
-

 Nyheter3 veckor sedan
Guldpriset uppe på nya höjder, nu 3750 USD
-

 Nyheter2 veckor sedan
Blykalla och amerikanska Oklo inleder ett samarbete